Giter Site home page Giter Site logo

ozunconf18's Introduction

(invitation only), Nov 22 - 23, 2018. Melbourne

Welcome to the repository for the 2018 ozunconf. rOpenSci will be hosting its fourth major developer meeting and open science hackathon this time in Melbourne, Australia.

  • Participants
  • You can see the ideas for projects, discussion topics, and sessions as issues
  • The projects that were worked on at the unconf are here

Code of conduct

To ensure a safe, enjoyable, and friendly experience for everyone who participates, we have a code of conduct. This applies to people attending in person or remotely, and for interacting over the issues, other online venues and times outside the unconf.

Support

This meeting is made possible by generous support from:

  • rOpenSci
  • Microsoft Azure
  • The R Consortium
  • RStudio
  • The University of Melbourne
  • The Monash Business School

ozunconf18's People

Contributors

imgbotapp avatar lingtax avatar markdly avatar njtierney avatar robjhyndman avatar

Stargazers

 avatar  avatar  avatar  avatar  avatar  avatar  avatar  avatar  avatar  avatar  avatar  avatar  avatar  avatar  avatar  avatar  avatar  avatar  avatar  avatar  avatar  avatar  avatar  avatar  avatar  avatar  avatar  avatar  avatar  avatar  avatar

Watchers

 avatar  avatar  avatar  avatar  avatar  avatar  avatar  avatar  avatar  avatar  avatar  avatar  avatar  avatar  avatar

ozunconf18's Issues

Recipe making AI

Just an idea at this point but I wonder if there could be a way to develop an AI that could make recipes. Something uses a recipe bank to understand ingredient commonalities etc and can make a β€˜new’ recipe.

The extension would be a Twitter bot you ask for a recipe based on key flavours, cuisines or similar.

Further to this it could then be extended into a β€˜spotify’esque recipe list...

No surprises that this came to me while prepping dinner tonight.

Visualising flows

It would be great to either build or enhance a package that helps with clearly visualising flows of sequences. There are existing packages like ggalluvial or a simple sankey package, but it would be great if there were some better ways to be able to include visualisation for churn.

audio diagnostics for MCMC πŸ“‰ πŸ”‰

background

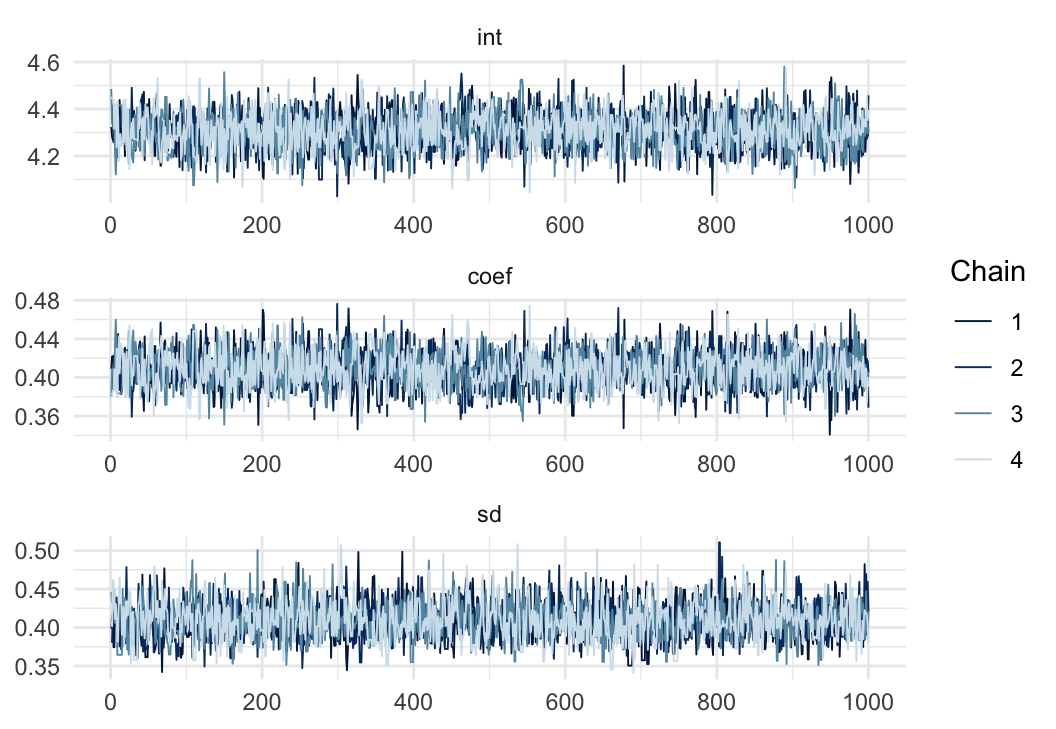
MCMC is a method for estimating parameters in (Bayesian) statistical models. It results in a bunch of multivariate time series of parameter values, that are often plotted like this:

For your inferences to be correct, those chains need to have converged on the correct distribution of values. There are some summary statistics and visualisations you can use to assess this, but none of these alone is always sufficient, and they often tell you nothing about in what way the chains have not converged.

One of the reasons that's difficult is that there are usually several of these time-series (chains) and that each one describes moving around in a high-dimensional space (4 chains of a 10-parameters model means that each time step gives a 4 different points in a 10D space, and the trajectory of the points may well be correlated). So it's difficult to get a single optimal summary statistic, or to visualise them all at once.

idea

This morning I saw this tweet:

The troubleshooting section for our new fridge has melted my heart. Imagine being the copywriter who sat there for hours trying to decipher the language of fridge...

β€” Claire Varley (clairepvarley) November 9, 2018

and subsequent link to this web page on diagnosing failing hard drives by their sounds.

Since MCMC chains are time-series and so are sounds, could we assess convergence of all of those parameters simultaneously by converting each of the parameters to different notes, converting them into sound waves, and playing them to the user?

If they were all happily converged, I would expect the sound to be a constant hum (@hollylkirk had the idea of making the notes for the parameters harmonize, so it sounds nice), whereas a lack of convergence would have a wavering/wobbling sound. Possibly something even weirder if there's a strange dependence to the parameters, like rotational invariance (pdf).

To diagnose which parameters are troublesome, we could create a dashboard to turn up or down the volume of each parameter.

tasks

  • create examples of MCMC chains that are converged / not converged in different ways
  • work out how to convert time-series into sounds (requires someone with musical knowledge)
  • work out how to play that back to the user, live
  • create a shiny dashboard that looks like a mixing desk
  • package it all up
  • provide a reference library of different sounds and what they tell you about convergence

Note: this idea may not be at all useful, but it'll be fun to find out!

Easier power calculations

It would be great to just provide a fitted model of a pilot and its data and one could get a power analysis back.

tldr for R functions ⏳ πŸ“„

TL;DR

create a community-contributed set of quick reference guides for R functions, like the tldr project does for the command line.

background

There's an awesome command-line tool, tldr, that lets you access a community-curated list of quick-reference helpfiles for command-line tools.

So when you get into a knotty command-line situation (like this), you can type a quick command and rapidly get common use cases:

tldr tar
 tar

  Archiving utility.
  Often combined with a compression method, such as gzip or bzip.

  - Create an archive from files:
    tar cf target.tar file1 file2 file3

  - Create a gzipped archive:
    tar czf target.tar.gz file1 file2 file3

  - Extract an archive in a target folder:
    tar xf source.tar -C folder

  - Extract a gzipped archive in the current directory:
    tar xzf source.tar.gz

  - Extract a bzipped archive in the current directory:
    tar xjf source.tar.bz2

  - Create a compressed archive, using archive suffix to determine the compression program:
    tar caf target.tar.xz file1 file2 file3

  - List the contents of a tar file:
    tar tvf source.tar

  - Extract files matching a pattern:
    tar xf source.tar --wildcards "*.html"

Each of those help files is stored as a small markdown document on GitHub, and these pages are contributed by community members (631 contributors and counting for tldr). If there isn't a page for the command you type, you're invited to submit a PR:

tldr doesnotexist
Page not found.
Feel free to send a pull request to: https://github.com/tldr-pages/tldr

These pages are not intended to replace the documentation for those commands, but they complement them, like cheatsheets do for R package documentation.

There are various interfaces to tldr, including an R package on GitHub. These interfaces all provide access to information about command-line tools, not R functions.

proposal

Build an equivalent library of quick reference guides for R functions, and a package to call them!

You wouldn't want to load the package before running the command, so I'd propose naming the package tl, with a single function dr, so you can just load the namespace and get a page rapidly like this:

tl::dr("hist")
 hist

  Plot histograms.

  - Plot a histogram in grey:
    hist(vector, col = "grey")

  - Plot a horizontal histogram:
    hist(vector, horiz = TRUE)

  - Get the binned histogram data, but don't plot it:
    data <- hist(vector, plot = FALSE)

tasks

  • create a GitHub repo to store the pages
  • write a package to download (and possibly cache?) and display the pages
  • create guidelines, templates (and possibly automatic checks) for the formatting, style, and content of submitted pages
  • start writing pages for R functions!

🚢walkability package🚢

It looks like there isn't a walkability R package yet. There's a defined API here: https://www.walkscore.com/professional/api.php

This could be a fun package to make to explore interacting with APIs. I imagine the main function would be something like

walkability("University of Melbourne Arts West North Wing Rooms 453-455, Building 148a University of Melbourne")

And the output could be a tibble with columns: walkability, lat, long, message

In terms of output, I could imagine it would be fun/interesting to create a walkability map of Melbourne or other areas in Australia and compare this with things like hospital catchments or other data

Mapping πŸ—Ί geographical 🌐 flows

It won't be a surprise for you to hear that #Rstats is becoming more and more capable in working with spatial data πŸ—ΊοΈ
With awesome tools like sf and tmap working already very well there is very little need for standalone Geographic Information Systems (GIS) software and it's great to have all your munging, analyses and cartography all in one place.

One thing that I think is lagging behind in this domain is visualization of geographical flows. If you ignore geography - there are some interesting tools for visualization like Sankey diagrams or RCircos.

Some seriously pretty #Rstats graphs were generated already a while ago (example, and one more). My feeling though is that they were more focused on the prettiness factor than what cartography and visualization would advise to do.

Recent paper formalized what good flow maps should look like and some attempts have been done in GIS to implement that.

I think it'd be super cool to have a ggplot (or other?) way of visualising flows like that. There are some neat data from Austrlian Census that would make a perfect testbed for the project looking at commuting to work or difference between de facto and de jure populations on various scales of geography.

Improving the experience of adding references to a document

I recently taught an intro to rmarkdown course. It was great to expose people to the world of rmarkdown, but one thing that seemed rather annoying and manual process was that of adding references to a document.

It would be awesome to have some tooling in R to improve how we cite packages and papers.

I wrote about this at the rOpenSci unconf in the USA in 2017 (issue here), but decided to work on a different project.

So, here is an adapted summary of that issue


Citing packages in R can be tricky.

One path for improving this at the unconf could be to create a set of functions to assist the process of making citations for software and using citations for software

These might either be wrapped up in their own package, or perhaps even as a pull request to devtools, usethis, or goodpractice.

  • cite_pkgs:
    • makes a .bib file that contains citations from the R packages that are called or used. This could perhaps build off of knitr::write_bib(c(.packages(), 'bookdown','knitr', 'rmarkdown'), 'packages.bib')
  • use_citation (for use in R package development)
  • project_citations()
    • Grabs citations for packages used in a project/repo.
    • The user could then choose from and then export appropriately.
  • get_doi()
    • auto-generates citations to be the same or compatible citation that would be extracted by citation()
    • It also encourages authors to be explicit in what they want.
  • cleanup_bib()
    • This code would go through and clean up the .bib file, arranging all of the .bib entries in alphabetical order, and deleting exact duplicates. Some of this has been implemented in @HughParsonage 's TeXCheckR
  • use_cls()
    • Provides a way to add .cls files, from the repo: citation language styles.
    • This function would allow you to:
      • Search for a CLS
      • add a cls (adding it to the .RProj/current directory, and
  • use_badge()
    • Create a DOI or other citation badges ("please cite me!", or something).

Existing work

There is already some work on this in the papaja package, which has a really nice description in this chapter on citation, and the package citr by @crsh

Although, looking at these packages now, they are quite well developed!

Perhaps one outcome of this project could be to create a lightweight citation package that incorporates features missing from citr, and might end up being incorporated into a pull request, or perhaps into a blog post to discuss this topic.

Visualise through gganimate all possible plots of same type for a dataset

So I was thinking, what about when you know you need to visualise some data and you know already there are different ways to visualise it but you don't know what will be the most informative one.

What about creating a function that given a set of variables performs all possible visualisation of a certain type and presents them in a handy gganimate gif.

Also, the types of visualisations that I was thinking about have already a handy source code that can be found here. πŸ˜ƒ

self-portrait R functions πŸ‘©β€πŸŽ¨

This one's a bit left-field; it's a self-reflective art project.

Recently, @softloud tweeted:

If you were an rstats function, what function would you be.

Obviously mine would come from the purrr package. Hard not to choose purrr::cross.

β€” Charles T. Gray (cantabile) 27 August 2018

which got a lot of love and entertaining responses on twitter.

I didn't join in as I couldn't think of a function that represented me (and all the good jokes were taken by the time I got there), but thought for a while how I would go about writing one.

This project would be about generating multimedia art pieces in R, each piece of art being viewed by calling a function, gallery notes stored as documentation, and the art gallery being a package.

This feels like a timely thing, because the unconf is being held in the new Arts building at unimelb, and because the R community is probably the most cohesive and supportive, honest and self-reflective, and imaginative professional communities. We all inject our creativity into our R project in various ways, but rarely as a pure exercise in self-expression.

I can imagine the team (collective?) working on this would share ideas and code, but ultimately write their own function/functions, and they could all be combined together. What is in each of those functions would be entirely up to the creator, they could be static images, audio, animations, random text, some algorithm.

The level of technical difficulty of this project would be entirely up to each person, but I imagine this will be challenging in terms of thinking about how to express oneself via a new medium, and possibly emotionally difficult, depending on the subject matter!

what R version should I depend on?

Issue idea credit to: @Robbie90, as suggested in the day 0 unconf training

When creating an R package, we need to decide what is the earliest version of R we should depend on. I.e. how up-to-date must a user's R version be before they can install and use this package.

One option is to depend on the current release of R, but then people need to update their R installation before they can install the package (so might not bother with the package), and the package might work just fine on earlier versions.

Another option is to check and test the package on earlier versions of R, and see which is the earliest version that works. But that's really hard and time consuming!

We could write a package to help work out the earliest version that will work. The package could:

  • check the R dependency of packages that this one depends on (e.g. there's no point depending on R <3.0.0 if you depend on Rcpp, which requires R >3.0.0)
  • check whether R functions (or arguments to functions?) that are used in this package are available in each previous version of R
  • check whether this package passes checks and tests on previous versions of R, perhaps using bisection

The last of these approaches might be quite tricky, slow, and limited to recent-ish versions of R but could potentially leverage rhub or some other remote build system.

improving the track changes experience in rmarkdown πŸ“

I'd like to make it as easy as possible to track changes from one rmarkdown document as possible, whether it be in HTML, PDF, or even Word (although this might be complex).

I wrote a tweet about this here and had some really great responses from people.

There were two packages that stood out,

So I was thinking that we could try and flesh out example use of these packages, perhaps creating a vignette, a separate package, if we think that will mean we can do more, and perhaps incorporate some of the nice links people linked:

Untweetable species Twitterbot thing 🐜 🐌

Some of my colleagues just published a paper showing that 57% of Australian threatened species have been mentioned fewer than 20 times on Twitter. We have named the species that have never been tweeted about the #untweetables. 🐸 πŸ› 🐍 πŸͺ²

I propose a project to do the following:

  • regularly scrape Twitter to look for mentions of the 40 untweetable species that have never been tweeted about.
  • update the original dataset from the paper and do some live plotting
  • create a twitterbot that automatically retweets any tweets that mention the 40 zero tweet species and then tweets the updated live plot.

NB. I have 0 experience with doing Twitter stuff in R, but I am very enthusiastic! 😺

Dockerise your R project in one-click? time-capsules for R projects :package:

Problem

During the course of a computational replication, many sources of error might arise, causing the replication to fail. One critical component in a computational replication is the computing environment -- should, for example, any dependencies, like R packages, be no longer available, anyone wishing to reproduce your analyses in R will be unable to do so. Tools like Docker and The Rocker Project provide completely containerised environments -- including all dependencies -- for reproducing R analyses and projects.

Unfortunately this model of facilitating computational reproducibility across machines and analysts is extremely difficult to implement for the regular R user wishing to time-capsule their work. Specialised knowledge, and a good deal of time, is needed to get docker up and running. Some folk might not even know that Docker exists!

Consequently one of the most common models of open science involves authors submitting data and code to repositories like Dryad, and then providing the link inside their journal article. Whilst this ticks the transparency box of open science, it certainly does not guarantee reproducibility, for the reasons exemplified above.

Proposed solution

The fundamental objective is to create some sort of a time-capsule:

  1. R package - set of commands akin to blogdown for hugo in Rstudio. The user can timecapsule their R project.
  2. Shiny App - This package will be loaded so that the functions are available for implementation in a shinhy app, where the user can simply upload their data + code + etc etc and then hit "TImecapsule my R project", and the app using the package creates a docker container, that the user can then download.

The goal of the package, and the Shiny App, if we get there, is to create a "docker-like" system where the user can:

a) match the environment such that you can at least get the code to run
b) run the code, in a make-like manner
c) access the computing environment such that you can engage with raw, intermediate, and output objects in the data analysis pipeline of a scientific study to check the validity of the coding implementation of its analyses.

It should make the process of going from code, data, packages, and some set of assemblage instructions --> docker EASY!! The ultimate aim of making this process easy is to increase the generation of more reproducible scientific outputs, such that independent analysts can 1. obtain, and 2. re-run scientific analyses -- and, hopefully, reproduce them!

Thanks:

Thank you to @smwindecker and @stevekambouris for the initial ideas and impromptu workshopping today!

Friday lunchtime β€˜fireside’ chat. How to keep the ozunconf flame flickering

Last year , Roger Peng lead a very relaxed, informal lunchtime chat. I felt it was a really good fit for that time of the ozunconf.
The topic was β€˜how do you encourage others to get into R’
My suggestion is to hear people’s ideas and feelings about keeping a little bit of the ozunconf vibe going for the rest of the year when we go back to our home worlds.

Create functions for coding free-text gender responses

Some researchers (myself included) are starting to use free-text response option to obtain gender information from participants. This means we can get richer gender data and avoids 'othering' participants but creates some annoying workload issues for coding those responses for analysis.

Specifically, while I don't want to collapse all gender responses into two categories - typographical errors, inconsistency in capitalisation etc. creates more levels of the gender factor than is actually available in the data. Hand recoding all gender responses within every dataset presents a barrier to entry for some researchers. It would be useful to create some example script/functions that recodes common responses to reduce the workload associated with this task.

For reference here is how I achieved this in a recent dataset

dat <- dat %>% 
  mutate(
    gender = case_when(
      gender == "F"  ~ "Female",
      gender == "FAMELA"  ~ "Female",
      gender == "FEAMLE"  ~ "Female",
      gender == "EMALE" ~ "Female",
      gender == "FEM"  ~ "Female",
      gender == "FEMAIL"  ~ "Female",
      gender == "FEMAL"  ~ "Female",
      gender == "FEMALE"  ~ "Female",
      gender == "WOMAN"  ~ "Female",
      gender == "M" ~ "Male",
      gender == "MALE" ~ "Male",
      gender == "AGENDER (WOMAN)" ~ "Agender",
      gender == "NON BINARY" ~ "Non-binary",
      gender == "NONBINARY" ~ "Non-binary",
      gender == "NON-BINARY" ~ "Non-binary",
      gender == "MASCULINO" ~ "Male",
      gender == "40" ~ "NA",
      gender == "GENDER" ~ "NA")

  )

πŸ”Parser for Qualtrics survey πŸ“‹ files (QSF) to 2D Metadata

Human and machine readable metadata is important to making data open.

Users of qualtrics (a widely used online survey platform) have access to JSON metadata files (labelled QSF), but due to the nested layout of these, they are not human friendly.

I think there is scope to develop functions (for integration into existing qualtRics package, or standalone) to read critical information from these files and reorganise into a flat, 2D structure, streamlining and therefore promoting the production of these comprehensive metadata files.

Happy to provide examples.

Uncertainty vizualisation.

I'm interested in helping people add uncertainty to their visualisations a little easier. Not sure of the solution, need to do a little more research on what is available already. But interested in this space.

Marvel Comics API wrapper 🦸

I recently found out the Marvel Comics API can be used to access text and image data related to over 70 years of Marvel comics and characters.

There are some existing wrappers to the API written in Python such as marvel, marvelous, marvelator, PyMarvel, marvelapi, PyMarvelSimple. And also some tutorials such as this and this. But I can’t seem to find any existing R related code.

If nothing already exists, perhaps it might be fun to build a wrapper for the API in R?

R Markdown RΓ©sumΓ©/CV templates

RΓ©sumΓ©s for R Markdown πŸ‘·β€β™‚οΈ πŸ‘·β€β™€οΈ

I've had my rΓ©sumΓ© as a R Markdown template for a few months now, and @robjhyndman has recently converted his CV too (https://github.com/robjhyndman/CV).

I think using R Markdown for CVs is a great match. This is especially true for listed elements (education, experience, accolades) which can be filled in from an external source (or perhaps filtered by tags).

Possible features

My hopes and dreams for a RΓ©sumΓ©s package would include these features:

  • A variety of templates (list of popular open source resumes templates)
  • Functions to produce listed sections (education, experience, accolades)
  • Functions/add-in(s) to maintain a rΓ©sumΓ© contents dataset
  • Tagging system for entries, to support generation of tag-specific rΓ©sumΓ©s

Potential name(s)

available::available("vitae")
#> ── vitae ───────────────────────────────────────────────────────────────────────────────────────────────────────────────────────────────────────────
#> Name valid: βœ”
#> Available on CRAN: βœ” 
#> Available on Bioconductor: βœ”
#> Available on GitHub:  βœ” 
#> Bad Words: βœ”
#> Abbreviations: http://www.abbreviations.com/vitae
#> Wikipedia: https://en.wikipedia.org/wiki/vitae
#> Wiktionary: https://en.wiktionary.org/wiki/vitae
#> Urban Dictionary:
#>   the russian soprano singer who uses [falsetto] so beautifully  that no one escapes [the charm]^o^ the one who owns 5 times more  fans than orlando bloom does in china...  the one whose voice is  so [purified]....  the one you'll love more than yourself...  the one whom you are physically unable to stop listening to...
#>   http://vitas.urbanup.com/1933059
#> Sentiment:???

Created on 2018-11-19 by the reprex package (v0.2.1)

available::available("CV")
#> ── CV ──────────────────────────────────────────────────────────────────────────────────────────────────────────────────────────────────────────────
#> Name valid: βœ”
#> Available on CRAN: βœ” 
#> Available on Bioconductor: βœ”
#> Available on GitHub:  βœ– 
#> Bad Words: βœ”
#> Abbreviations: http://www.abbreviations.com/CV
#> Wikipedia: https://en.wikipedia.org/wiki/CV
#> Wiktionary: https://en.wiktionary.org/wiki/CV
#> Urban Dictionary:
#>   1. a [curriculum vitae] or resume is a list of your  [qualifications], achievements, skills etc that you give to a  [prospective] employer.  2. tits.
#>   http://cv.urbanup.com/3007232
#> Sentiment:???

Created on 2018-11-13 by the reprex package (v0.2.1)

Brisbane road traffic challenge πŸš— 🚌 🚚

Brisbane City Council @brisbanecityqld provides access to Traffic Management β€” Intersection volume
πŸš— 🚌 🚚 dataset (access with login, data under CC BY 4.0 license). Every minute a JSON file is exposed to the world providing:

Real time data of traffic volume and occupancy of lanes at Brisbane City Council signalised intersections and approaches.

There are ~960 geocoded 🌐 intersections. Each intersection has minute by minute πŸ•™ data on measured & reconstituted flow and degree of saturation (docs here and here).

IMHO, there are at least two possibilities to work with this challenging dataset:

  1. Dynamic approach: trying to digest JSON and build interactive dashboard monitoring traffic and other important factors (public transport? cycling? shared bikes? weather? etc.)

  2. Static approach: trying to digest large(ish) historical dataset and try to model, explain and predict traffic either in a city as a whole or spatiotemporally. I've been collecting data since mid Sept. It's a challenging set that could generate over 22k JSON files per month and will require pulling some tricks to process and model that. Analysing hourly, weekday/weekend or holiday/regular day traffic would be probably first exploratory step. As one potential explanatory variable we could use weather ⛅️. UQ SEES exposes minutely updated data that could be used for such purpose. It would be cool to see what a certain amount of rain 🌧 could do Brisbane traffic!

Meta-package for creating package and handling data from CKAN sources

The idea is to create a small meta-package that helps with handling data from CKAN sources (like data.gov.au).

e.g. Create a package for the dataset of ASIC business names from https://data.gov.au/dataset/asic-business-names/resource/839cc783-876f-47a2-a70c-0fe606977517

create_package(r_package_name = "ASICnames", ckan_source = "data.gov.au", 
datasets = c(ASIC = "839cc783-876f-47a2-a70c-0fe606977517"))

This package would:

  • Have the user define the CKAN source (e.g. data.gov.au) and the package_id
  • Create a package skeleton for a data-only R package
  • Use the meta-info supplied by the data source to populate README.Rmd, description and Roxygen
  • Set up scripts in data-raw for pulling the data from the source and creating the data for the package. (Would need some special handlers for different data: csv, zip, shp, kml, json, xml)
  • Helper scripts to see if you have the latest data
  • Helper scripts for managing multiple versions of the data i.e. keep historical versions for reference.

This would borrow some ideas from datagovau

simplified NLP and text mining functions

I am thinking of a series of Natural Language Processing functions that take care of the pre-processing and allow the user to focus on the task and the output. This would be most useful where the objective is to extract something from a vector of text.

There are some common NLP or text-mining tasks to begin with could be entity extraction (people, places), keyword extraction and perhaps even topic modelling or text classification.

The functions would all be self-descriptive so: extract_place(), extract_people(), extract_topics() etc.

Inputs would be simple vectors of text and outputs a vector or list of the same length. So this could easily slot into a tidy workflow:

df %>%
  mutate(keywords = extract_keywords(text_column))

For me, the most complex part of NLP is the pre-processing. But I suspect (hope) it would be possible to setup a robust and generic process. And I think for 90% of use cases a generic pre-processing with only a few options would be sufficient.

The question I have is whether or not something like this already exists, I will check.

`syn`: a package for generating synonyms and antonyms πŸ“˜ πŸ”‘

What is says on the tin!

I've had this idea for a little while, mainly to stop me from going to google to look for synonyms - I haven't made any progress, but a stub of a package is here: https://github.com/njtierney/syn

The goal of syn is to provide two main functions:

  • syn - generate synonyms
  • ant - generate antonyms

There are other packages that do this, but they usually do this in the context of other text-related work.

In terms of applications, I would use this all the time to output a set of (syn/ant)onyms for words in the terminal, but I imagine it could also be useful for type of text analysis where you might want to search for similar words? I have 0 experience with text analysis, so perhaps there are better tools for that already.

πŸ–Ό Infographics with the grid πŸ“¦ . workshop/experiment πŸ”¬

It might be fun to experiment on creating a infographic with the grid πŸ“¦ and then produce some blog posts sharing how it can be done in R (along with learnings and further questions) without using a post processing tool like illustrator or inkscape.

Among many thing ggplot2 is an interface to the grid πŸ“¦ for creating visualisations. Recently I was working though some of the grid documentation examples to improve my knowledge of this super important low level package. It's pretty fun - and powerful . Like many powerful things the trade off between the complete control it gives you is you have to do nearly everything yourself, which is why the ggplot2 (and the lattice πŸ“¦ ) abstraction is such a great extension of grid.

Anyway , inspired by this great example πŸ‘ I started to play around with recreating one of Steph De Silva's great infographics πŸ₯‡ in this repo πŸ“ and the underdeveloped πŸ₯ of my labour here πŸ–Ό

Recommend Projects

  • React photo React

    A declarative, efficient, and flexible JavaScript library for building user interfaces.

  • Vue.js photo Vue.js

    πŸ–– Vue.js is a progressive, incrementally-adoptable JavaScript framework for building UI on the web.

  • Typescript photo Typescript

    TypeScript is a superset of JavaScript that compiles to clean JavaScript output.

  • TensorFlow photo TensorFlow

    An Open Source Machine Learning Framework for Everyone

  • Django photo Django

    The Web framework for perfectionists with deadlines.

  • D3 photo D3

    Bring data to life with SVG, Canvas and HTML. πŸ“ŠπŸ“ˆπŸŽ‰

Recommend Topics

  • javascript

    JavaScript (JS) is a lightweight interpreted programming language with first-class functions.

  • web

    Some thing interesting about web. New door for the world.

  • server

    A server is a program made to process requests and deliver data to clients.

  • Machine learning

    Machine learning is a way of modeling and interpreting data that allows a piece of software to respond intelligently.

  • Game

    Some thing interesting about game, make everyone happy.

Recommend Org

  • Facebook photo Facebook

    We are working to build community through open source technology. NB: members must have two-factor auth.

  • Microsoft photo Microsoft

    Open source projects and samples from Microsoft.

  • Google photo Google

    Google ❀️ Open Source for everyone.

  • D3 photo D3

    Data-Driven Documents codes.