This is a unfinished program that can draw maps through python 2.7 and R. (Created in 2016)
This program is stopped due to time and environment reason.
The baisc solution for this is:
-
let R read .shp file and location data
-
use R to draw the points / bar plot / pie plot / density plot on the map
-
use R output .png pictures
-
use .bat files to run R files .bat -> go*.R -> .R script
-
use .pyw to build windows program in python and create UI
-
use python run the .bat files and combine all plots layers we need.
python 2.7
wxPython
python PIL
R package "sp" and "maptools"
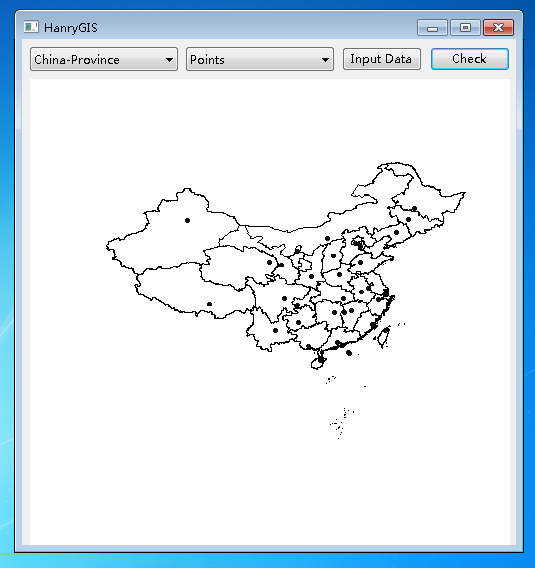
Acutally, the program can only draw province level map in a national view. Other scale options are not avaliable.
Currently, I cannot run the program because I no longer use python 2.7.
Here is a snapshot of this program drawing a national point plot.