Giter Site home page Giter Site logo

sertalpbilal / rocket_league_analytics Goto Github PK

View Code? Open in Web Editor NEW
4.0 3.0 4.0 726.79 MB

Fun with Rocket League tracking data

Home Page: https://sertalpbilal.github.io/rocket_league_analytics/

Python 8.13% Dockerfile 0.02% Batchfile 0.01% Jupyter Notebook 90.08% HTML 0.82% CSS 0.05% JavaScript 0.90%
xg-model dashboard pc-gaming e-sports machine-learning expected-goals sports-analytics tracking-data

rocket_league_analytics's Introduction

Rocket League Analytics

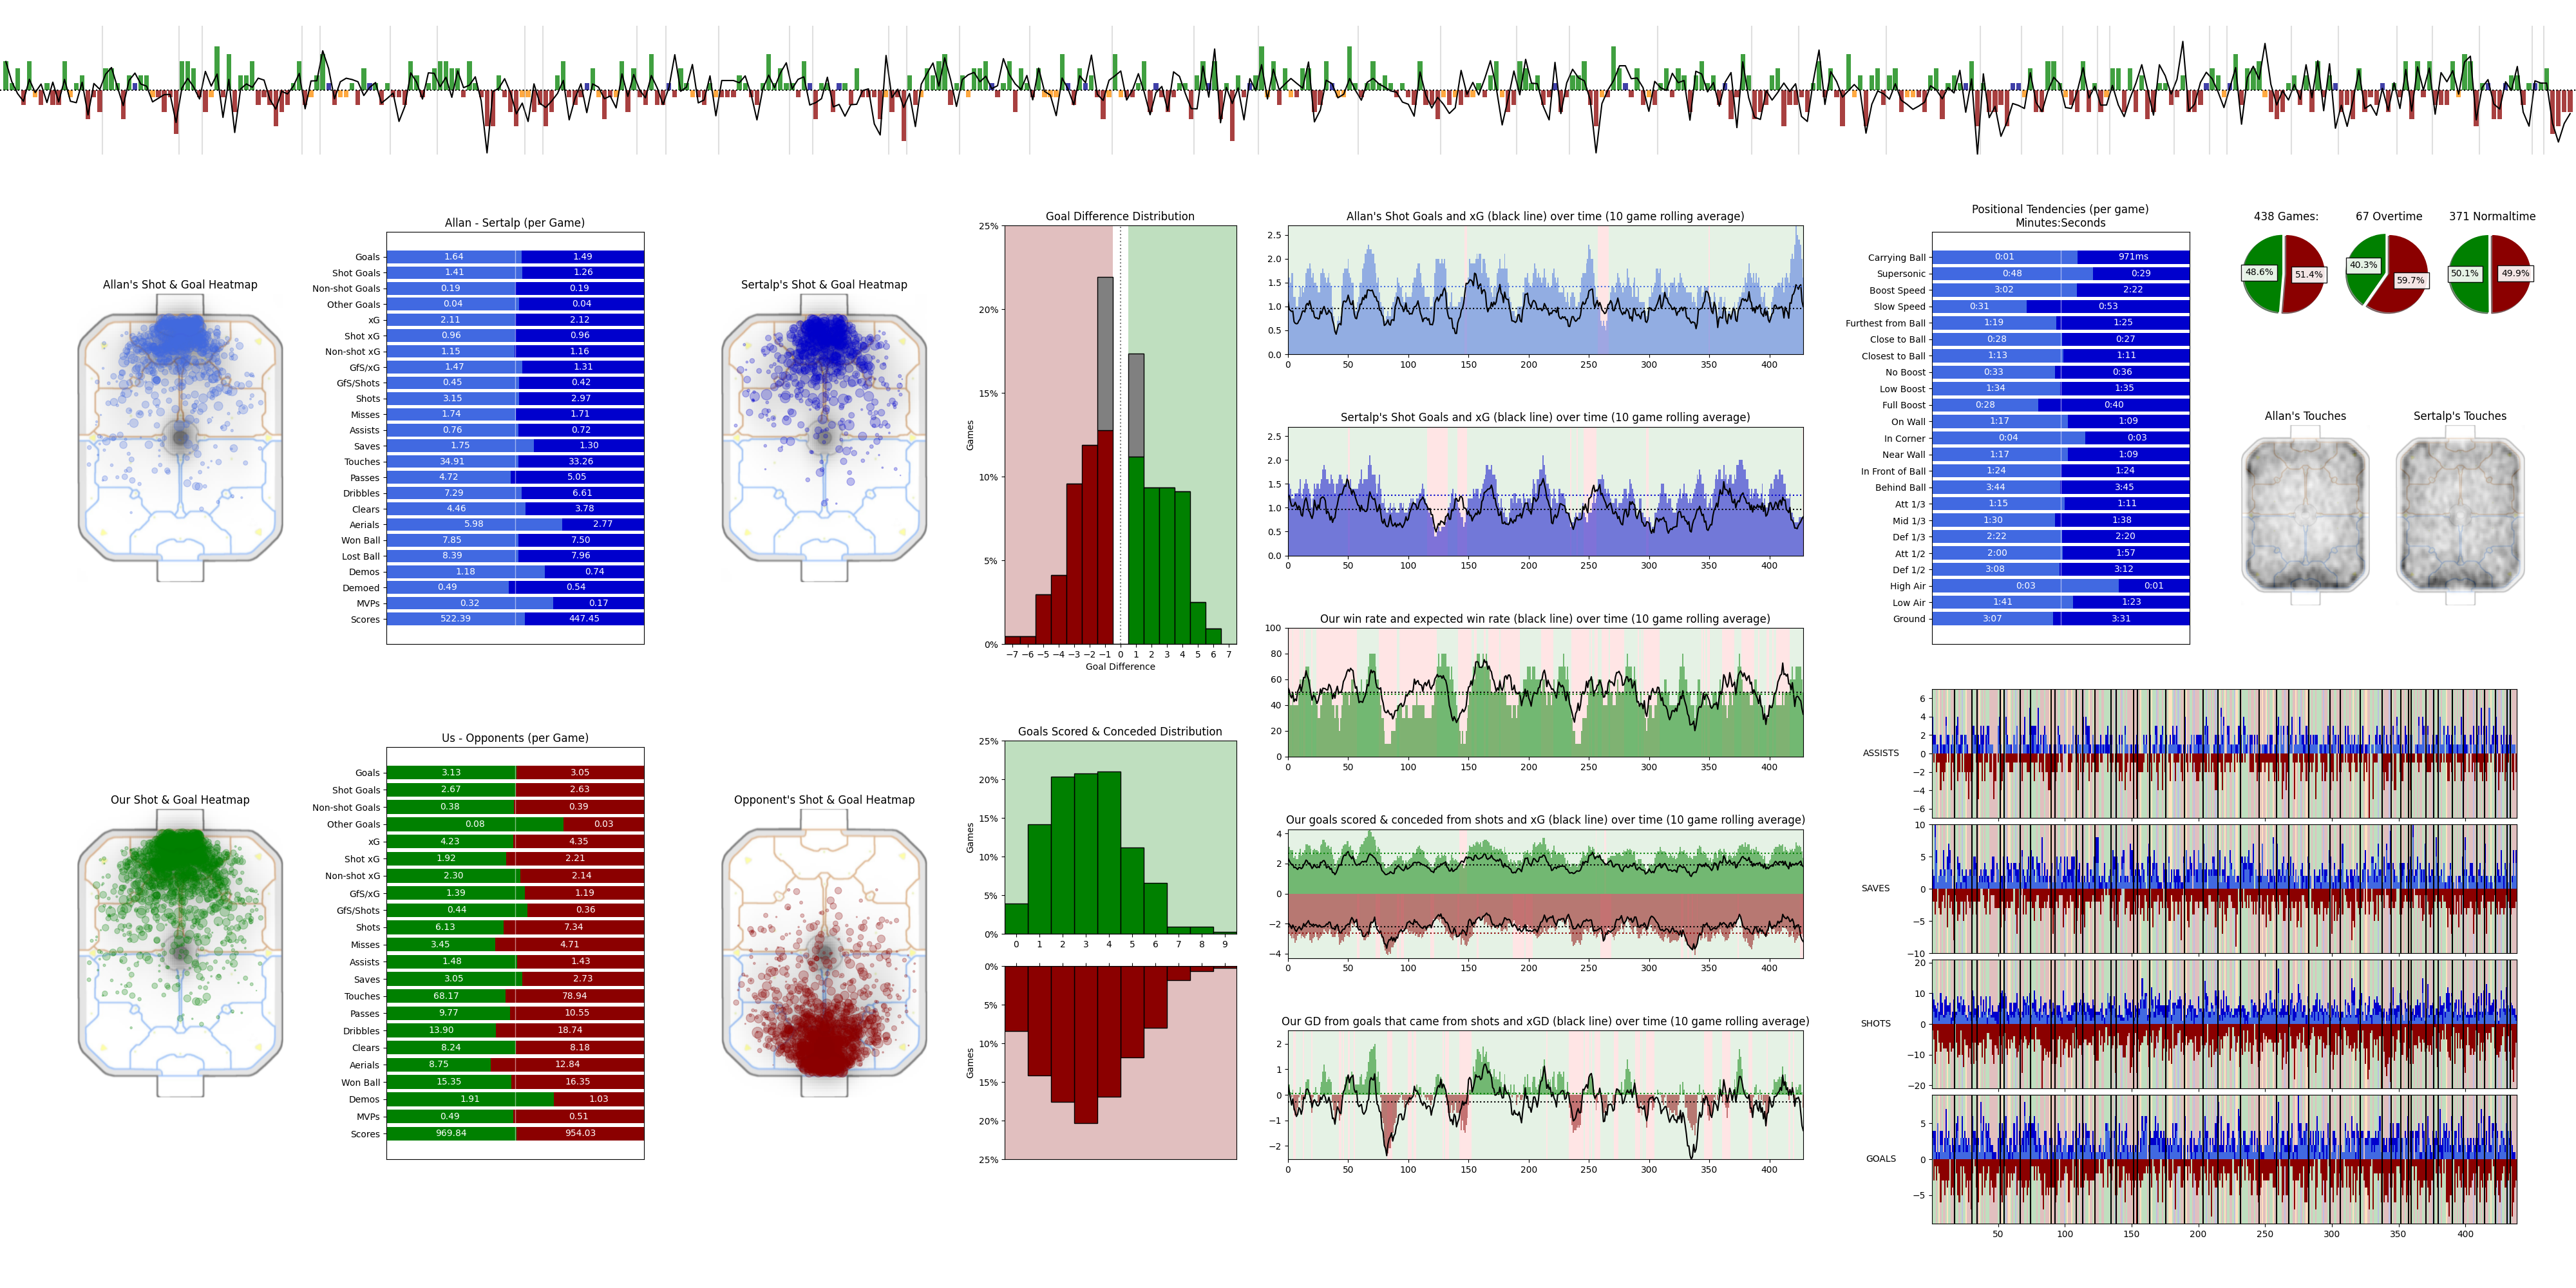
Rocket League detailed stat dashboard with expected goals analysis.

See dashboard here: https://sertalpbilal.github.io/rocket_league_analytics

Generating xG model and dashboard

The xG model file is under src/xg_model. The model depends on having a valid key from ballchasing.com API.

Steps:

  1. Setting up environment
    Add your BallChasing token to .env.sample file and rename it to .env
  2. Collecting random game data (optional)
    Navigate to src/scripts and run python collect_model_games.py
    This step will download latest 1000 ranked double games under data/model directory.
  3. Generating xG model (optional)
    Run python generate_xg.py to populate xG model.
    Note that you might need to run this inside a Docker container if you cannot install carball package.
    This step will populate two files under data/model: xg.model (gradient boosting xG model) and xg.scaler (feature scaler)
  4. Download your games
    You can go to scripts folder and run python download_my_games.py
    This step will download your games to data/replay and will populate data/json and data/dataframe directories for future use.
  5. Generate the dashboard
    Finally you can go to src and run python boxcartest.py to populate the dashboard.

Screenshots:

Considering all games

Click here to view in an alternative format

full_canvas.png

Considering the latest streak of games

Click here to view in an alternative format

full_canvas.png

Output:

Alongside all of the charts produced by the program, the program also outputs 11 tables.

  1. Game Records
  2. Per Game Data
  3. Player 1's Positional Tendencies
  4. Player 2's Positional Tendencies
  5. Player Comparison
  6. Player Records
  7. Results
  8. Scorelines
  9. Streaks
  10. Team Comparison
  11. Team Records

Tables for the latest streak of matches can be found here.

rocket_league_analytics's People

Contributors

sertalpbilal avatar

Stargazers

 avatar  avatar  avatar  avatar

Watchers

 avatar  avatar  avatar

Recommend Projects

  • React photo React

    A declarative, efficient, and flexible JavaScript library for building user interfaces.

  • Vue.js photo Vue.js

    ๐Ÿ–– Vue.js is a progressive, incrementally-adoptable JavaScript framework for building UI on the web.

  • Typescript photo Typescript

    TypeScript is a superset of JavaScript that compiles to clean JavaScript output.

  • TensorFlow photo TensorFlow

    An Open Source Machine Learning Framework for Everyone

  • Django photo Django

    The Web framework for perfectionists with deadlines.

  • D3 photo D3

    Bring data to life with SVG, Canvas and HTML. ๐Ÿ“Š๐Ÿ“ˆ๐ŸŽ‰

Recommend Topics

  • javascript

    JavaScript (JS) is a lightweight interpreted programming language with first-class functions.

  • web

    Some thing interesting about web. New door for the world.

  • server

    A server is a program made to process requests and deliver data to clients.

  • Machine learning

    Machine learning is a way of modeling and interpreting data that allows a piece of software to respond intelligently.

  • Game

    Some thing interesting about game, make everyone happy.

Recommend Org

  • Facebook photo Facebook

    We are working to build community through open source technology. NB: members must have two-factor auth.

  • Microsoft photo Microsoft

    Open source projects and samples from Microsoft.

  • Google photo Google

    Google โค๏ธ Open Source for everyone.

  • D3 photo D3

    Data-Driven Documents codes.