Giter Site home page Giter Site logo

sg-s / stg-embedding Goto Github PK

View Code? Open in Web Editor NEW
4.0 2.0 2.0 20.04 MB

Embedding spike times from a small neural circuit to map how collective dynamics change under different conditions

Home Page: https://www.biorxiv.org/content/10.1101/2021.07.06.451370v1.full.pdf

License: GNU General Public License v3.0

MATLAB 93.09% C 3.58% Shell 0.25% Python 2.50% C++ 0.54% M 0.04%
neural-embeddings pyloric-network t-sne neural-circuits mapping stg

stg-embedding's Introduction

stg embedding

This repository contains code to reproduce every figure in

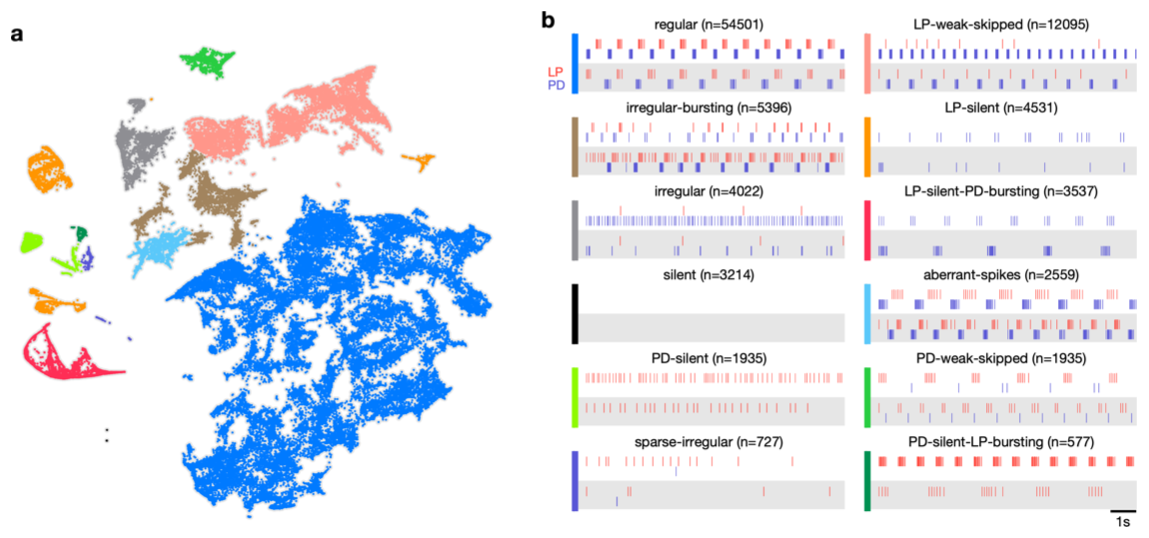
Mapping circuit dynamics during function and dysfunction

Installation and prerequisites

You will need MATLAB.

Download the following repositories and add them to your MATLAB path:

https://github.com/sg-s/stg-embedding
https://github.com/sg-s/srinivas.gs_mtools
https://github.com/sg-s/crabsort
https://github.com/KlugerLab/FIt-SNE

Data

The raw data is >30TB and getting it into your hands is not easy. Instead we provide reduced data consisting of spiketimes, metadata and various annotations. This should allow you to reproduce every figure in the paper.

To get the data, download it from Zenodo.

How to regenerate figures

  1. First, download the code and add to path (see above).
  2. Then, download the data and put it in a folder called "reduced-data" within your "stg-embedding" folder. You will have to create this if needed.
  3. Then, navigate to the paper-figures folder and run any script to generate that figure. For example, to generate Figure 2, run: fig_embedding.

License

GPL v3

stg-embedding's People

Contributors

cosmojg avatar sg-s avatar

Stargazers

 avatar  avatar  avatar  avatar

Watchers

 avatar  avatar

Forkers

marderlab cosmojg

stg-embedding's Issues

Use Bayes' rule to estiamte...

we can estiamte p(state | mdoulator)

Now estiamte p(modulator | )

and see:

  1. the mode -- this tells us about most likely modulator
  2. the distribution around the mode -- this tells us how stereotypic that modulator is

This data is probably worth looking at

776_031

776_040 -- include in analysis

776_050
Missing common file!
776_064
Missing common file!
776_067
Missing common file!
776_072
Missing common file!
776_080
Missing common file!
776_082
Missing common file!
776_088
Missing common file!
776_120
Missing common file!
904_042
Missing common file!
906_080
Missing common file!
930_075
Missing common file!
930_087
Missing common file!
930_090
Missing common file!
930_093
Missing common file!
930_106
Missing common file!
930_111
Missing common file!
930_114
Missing common file!
930_128

A new way to embed data

  1. Compute all N-th order ISIs
  2. Truncate order when max_isi in order > 2*max_isi in 1st order
  3. from all these isis, compute p(spike after t seconds) vs t -- this is just the histogram
  4. compute percentiles of these ISIs -- chances are 90th percentile is the burst period.

Need to do:

  1. check that this works for long bursts (with lots of spikes)
  2. check that this works for bursts with variable # of spikes (but fixed period)

uMAP embedding validation

  • Label the whole dataset a few times. And color points that have different labels. Measure fraction of points that are different. Should be very small.
  • Label half the points (subsample data, label all subsampled data), and then use that to semi-supervised embed the whole dataset. This shows that semi-supervised embedding is good. Compare to fully-supervised embedding.

for the distance metric, we should modify it as followss

for two sets of spike trains, the units of the distance are in time

however, for a distance b/w an empty set and some non-empty set, it is not.

let's modify the distance metric so that the distance b/w an empty sety and a non-empty set is the sum of all ISIs

then the units of all distances are in time

Missing data

  • 879_009
  • 879_012
  • 879_018
  • 834_150
  • 830_106
  • 834_148
  • 834_132
  • 825_151
  • 834_104
  • 825_147
  • 825_143
  • 825_139
  • 825_107
  • 825_079
  • 825_115
  • 936_001
  • 825_063
  • 811_147
  • 897_010

two ways of going from voltage traces to high-D feature vector

we want this step to have the following propoerties:

  1. all dimensions should have the same units
  2. all dimensions should have non-crazy distributions

method 1

  • measure all times b/w spikes. so that includes time to last spike on AB, and more complex measures like time from most recent AB spike to next LP spikes.
  • this measure is defined at every time t, and should be capped at a maximum T, which is the only parameter here

method 2

  • for a given temperature, for a given window length, plot all the ISIs. bin and discretize. that's it.
  • do the same for more complex ISIs like b/w neurons. so we get a very long discretized vector for each set. think about ISI bifurcation diagrams with temperature on the x axis

These files need to be re-done, or checked, or something

828_052_1 -- sorted
828_052_2 -- sorted
828_114_1
828_114_2
828_136_1
830_100
834_058_1
834_058_2
834_086_1
834_086_2
845_018_1
857_012
857_020_1
857_142
862_021
862_024
862_085
862_089
862_101
862_104
862_114
862_127
862_128
862_129
862_130
862_141
862_143
862_145
876_012
876_013
876_017
876_018
876_020
876_021
876_022
876_027
876_029
876_031
876_033
876_047
876_052
876_106
876_112
876_115
876_117
876_122
876_125
876_129
876_131
876_135
876_139
876_141
876_143
876_147
931_053

they are supposed to have neuromodualtor-compatible data, but for weird reasons, they dont

Distance in umap space -- voronoi vis

Voronoi segment the umap cloud. measure:

  1. distances (in units of the embedding) between similar and dissimalr triangles. i expect to see distances between dissimalr triangles being much greater.

  2. distances (using ISI distances). show that distances between similar and dissimilar trianges are different.

Roadmap for future work

  • Get all spikes from PD neurons in high-K data
  • measure distances using new distance metric in high-K data
  • show distance matrix for PD neurons in high K data
  • embed using t-SNE
  • embed using UMAP

list of papers to read:

  • Tensor Compnent Analysis (Williams et al Neuron 2018)
  • Gaussian Process Factor Analysis (Yu et al 2009 J Neurophysiology)
  • Latent Dynamical System Models (Gao et al NIPS 29 2016)
  • also; Gao et al 2015 Curr. Opinion Neurobio

Recommend Projects

  • React photo React

    A declarative, efficient, and flexible JavaScript library for building user interfaces.

  • Vue.js photo Vue.js

    ๐Ÿ–– Vue.js is a progressive, incrementally-adoptable JavaScript framework for building UI on the web.

  • Typescript photo Typescript

    TypeScript is a superset of JavaScript that compiles to clean JavaScript output.

  • TensorFlow photo TensorFlow

    An Open Source Machine Learning Framework for Everyone

  • Django photo Django

    The Web framework for perfectionists with deadlines.

  • D3 photo D3

    Bring data to life with SVG, Canvas and HTML. ๐Ÿ“Š๐Ÿ“ˆ๐ŸŽ‰

Recommend Topics

  • javascript

    JavaScript (JS) is a lightweight interpreted programming language with first-class functions.

  • web

    Some thing interesting about web. New door for the world.

  • server

    A server is a program made to process requests and deliver data to clients.

  • Machine learning

    Machine learning is a way of modeling and interpreting data that allows a piece of software to respond intelligently.

  • Game

    Some thing interesting about game, make everyone happy.

Recommend Org

  • Facebook photo Facebook

    We are working to build community through open source technology. NB: members must have two-factor auth.

  • Microsoft photo Microsoft

    Open source projects and samples from Microsoft.

  • Google photo Google

    Google โค๏ธ Open Source for everyone.

  • D3 photo D3

    Data-Driven Documents codes.