Giter Site home page Giter Site logo

data-visualization's Introduction

Data-Visualization

1. What is the data that you chose? Why?

For this assignment, we will visualize social networking data using anonymized data from Facebook,

The first file we will use, edges.csv, contains variables V1 and V2, which label the endpoints of edges in our network. Each row represents a pair of users in our graph who are Facebook friends. For a pair of friends A and B, edges.csv will only contain a single row -- the smaller identifier will be listed first in this row. From this row, we will know that A is friends with B and B is friends with A.

The second file, users.csv, contains information about the Facebook users, who are the vertices in our network. This file contains the following variables:

In our visualizations, the vertices in our network will represent Facebook users and the edges will represent these users being Facebook friends with each other.

2. Did you use a subset of the data? If so, what was it?

Yes, I want to know what is the gender of the users with the highest degree in the graph?

3. Are there any particular aspects of your visualization to which you would like to bring attention?

We can update the colors by setting the color to black for all vertices, than setting it to red for the vertices with gender A and setting it to gray for the vertices with gender B:

V(g)$color = "black"

V(g)$color[V(g)$gender == "A"] = "red"

V(g)$color[V(g)$gender == "B"] = "gray"

plot

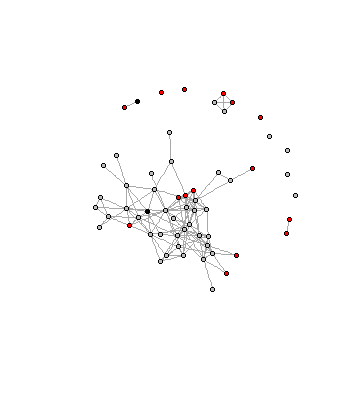
Gender B with the highest degree in the graph

4. What do you think the data, and your visualization, shows?

Because the data is anonymized, we don't know which value refers to males and which value refers to females. The cliche goes that the world is an increasingly interconnected place, and the connections between different entities are often best represented with a graph. Graphs are comprised of vertices (also often called "nodes") and edges connecting those nodes.

data-visualization's People

Contributors

shanekao avatar

Watchers

 avatar  avatar

Recommend Projects

  • React photo React

    A declarative, efficient, and flexible JavaScript library for building user interfaces.

  • Vue.js photo Vue.js

    ๐Ÿ–– Vue.js is a progressive, incrementally-adoptable JavaScript framework for building UI on the web.

  • Typescript photo Typescript

    TypeScript is a superset of JavaScript that compiles to clean JavaScript output.

  • TensorFlow photo TensorFlow

    An Open Source Machine Learning Framework for Everyone

  • Django photo Django

    The Web framework for perfectionists with deadlines.

  • D3 photo D3

    Bring data to life with SVG, Canvas and HTML. ๐Ÿ“Š๐Ÿ“ˆ๐ŸŽ‰

Recommend Topics

  • javascript

    JavaScript (JS) is a lightweight interpreted programming language with first-class functions.

  • web

    Some thing interesting about web. New door for the world.

  • server

    A server is a program made to process requests and deliver data to clients.

  • Machine learning

    Machine learning is a way of modeling and interpreting data that allows a piece of software to respond intelligently.

  • Game

    Some thing interesting about game, make everyone happy.

Recommend Org

  • Facebook photo Facebook

    We are working to build community through open source technology. NB: members must have two-factor auth.

  • Microsoft photo Microsoft

    Open source projects and samples from Microsoft.

  • Google photo Google

    Google โค๏ธ Open Source for everyone.

  • D3 photo D3

    Data-Driven Documents codes.