Giter Site home page Giter Site logo

stefanprodan / dockprom Goto Github PK

View Code? Open in Web Editor NEW
5.9K 137.0 1.7K 2.48 MB

Docker hosts and containers monitoring with Prometheus, Grafana, cAdvisor, NodeExporter and AlertManager

License: MIT License

docker monitoring prometheus alertmanager grafana cadvisor

dockprom's Introduction

dockprom

A monitoring solution for Docker hosts and containers with Prometheus, Grafana, cAdvisor, NodeExporter and alerting with AlertManager.

Install

Clone this repository on your Docker host, cd into dockprom directory and run compose up:

git clone https://github.com/stefanprodan/dockprom
cd dockprom

ADMIN_USER='admin' ADMIN_PASSWORD='admin' ADMIN_PASSWORD_HASH='$2a$14$1l.IozJx7xQRVmlkEQ32OeEEfP5mRxTpbDTCTcXRqn19gXD8YK1pO' docker-compose up -d

Caddy v2 does not accept plaintext passwords. It MUST be provided as a hash value. The above password hash corresponds to ADMIN_PASSWORD 'admin'. To know how to generate hash password, refer Updating Caddy to v2

Prerequisites:

  • Docker Engine >= 1.13
  • Docker Compose >= 1.11

Updating Caddy to v2

Perform a docker run --rm caddy caddy hash-password --plaintext 'ADMIN_PASSWORD' in order to generate a hash for your new password. ENSURE that you replace ADMIN_PASSWORD with new plain text password and ADMIN_PASSWORD_HASH with the hashed password references in docker-compose.yml for the caddy container.

Containers:

  • Prometheus (metrics database) http://<host-ip>:9090
  • Prometheus-Pushgateway (push acceptor for ephemeral and batch jobs) http://<host-ip>:9091
  • AlertManager (alerts management) http://<host-ip>:9093
  • Grafana (visualize metrics) http://<host-ip>:3000
  • NodeExporter (host metrics collector)
  • cAdvisor (containers metrics collector)
  • Caddy (reverse proxy and basic auth provider for prometheus and alertmanager)

Setup Grafana

Navigate to http://<host-ip>:3000 and login with user admin password admin. You can change the credentials in the compose file or by supplying the ADMIN_USER and ADMIN_PASSWORD environment variables on compose up. The config file can be added directly in grafana part like this

grafana:
  image: grafana/grafana:7.2.0
  env_file:
    - config

and the config file format should have this content

GF_SECURITY_ADMIN_USER=admin
GF_SECURITY_ADMIN_PASSWORD=changeme
GF_USERS_ALLOW_SIGN_UP=false

If you want to change the password, you have to remove this entry, otherwise the change will not take effect

- grafana_data:/var/lib/grafana

Grafana is preconfigured with dashboards and Prometheus as the default data source:

Docker Host Dashboard

Host

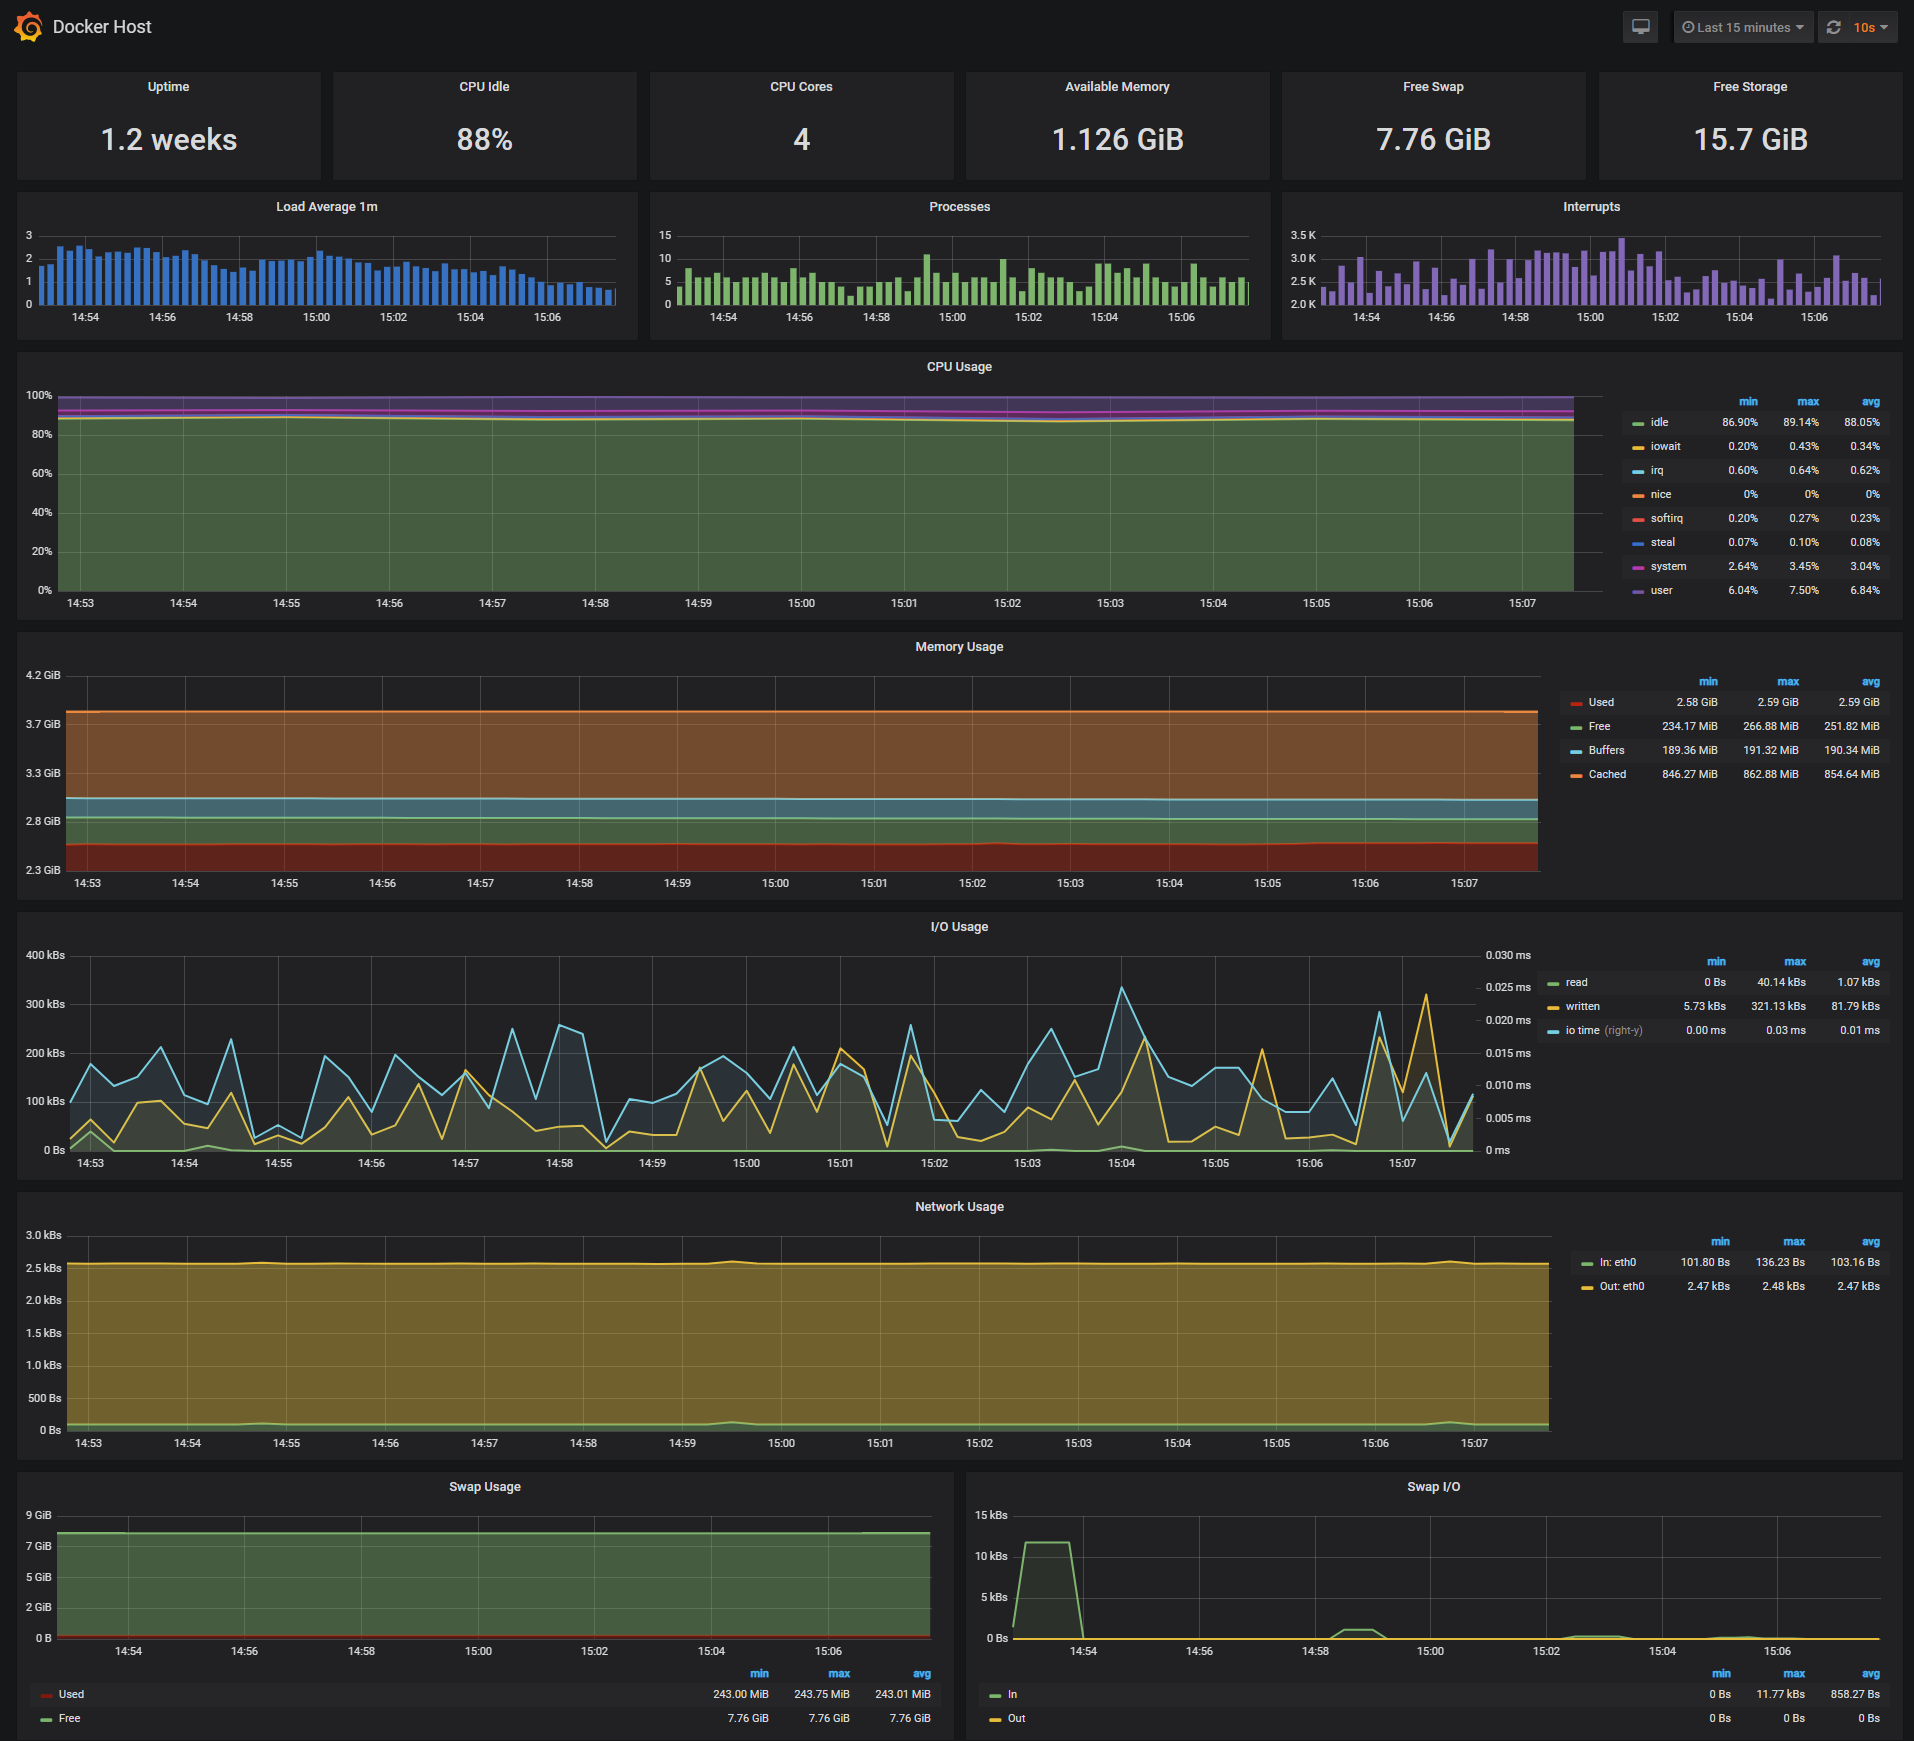
The Docker Host Dashboard shows key metrics for monitoring the resource usage of your server:

  • Server uptime, CPU idle percent, number of CPU cores, available memory, swap and storage
  • System load average graph, running and blocked by IO processes graph, interrupts graph
  • CPU usage graph by mode (guest, idle, iowait, irq, nice, softirq, steal, system, user)
  • Memory usage graph by distribution (used, free, buffers, cached)
  • IO usage graph (read Bps, read Bps and IO time)
  • Network usage graph by device (inbound Bps, Outbound Bps)
  • Swap usage and activity graphs

For storage and particularly Free Storage graph, you have to specify the fstype in grafana graph request. You can find it in grafana/provisioning/dashboards/docker_host.json, at line 480 :

"expr": "sum(node_filesystem_free_bytes{fstype=\"btrfs\"})",

I work on BTRFS, so i need to change aufs to btrfs.

You can find right value for your system in Prometheus http://<host-ip>:9090 launching this request :

node_filesystem_free_bytes

Docker Containers Dashboard

Containers

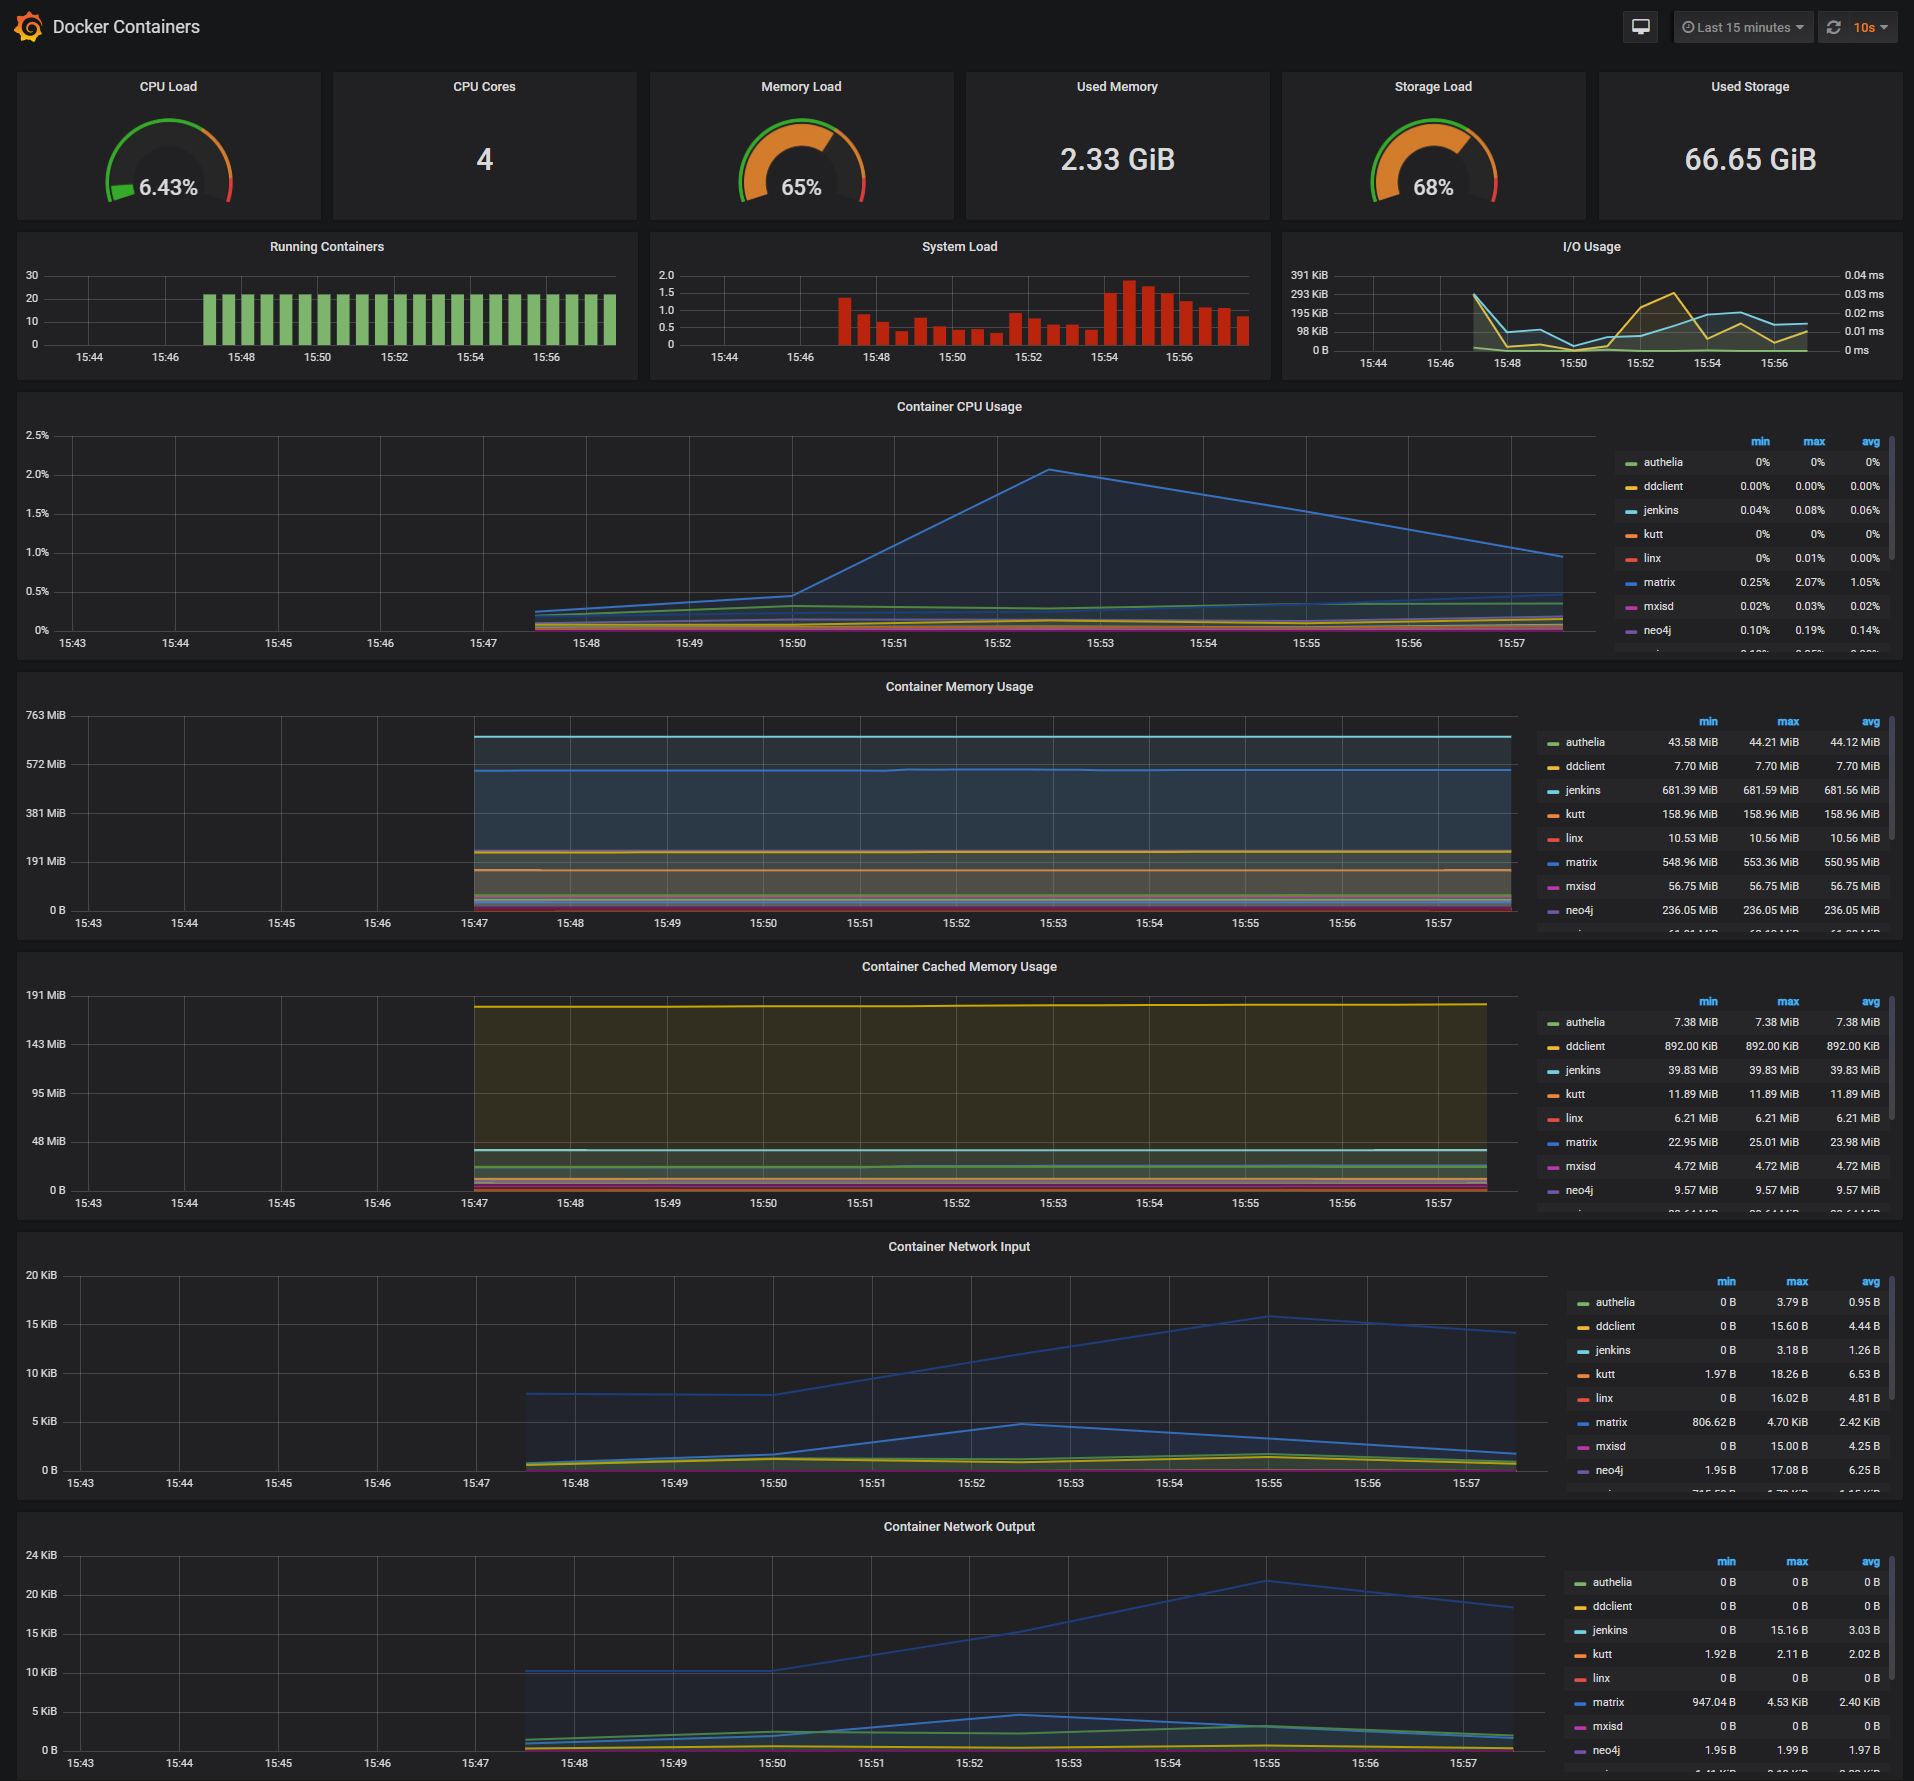
The Docker Containers Dashboard shows key metrics for monitoring running containers:

  • Total containers CPU load, memory and storage usage
  • Running containers graph, system load graph, IO usage graph
  • Container CPU usage graph
  • Container memory usage graph
  • Container cached memory usage graph
  • Container network inbound usage graph
  • Container network outbound usage graph

Note that this dashboard doesn't show the containers that are part of the monitoring stack.

For storage and particularly Storage Load graph, you have to specify the fstype in grafana graph request. You can find it in grafana/provisioning/dashboards/docker_containers.json, at line 406 :

"expr": "(node_filesystem_size_bytes{fstype=\"btrfs\"} - node_filesystem_free_bytes{fstype=\"btrfs\"}) / node_filesystem_size_bytes{fstype=\"btrfs\"}  * 100"

I work on BTRFS, so i need to change aufs to btrfs.

You can find right value for your system in Prometheus http://<host-ip>:9090 launching this request :

node_filesystem_size_bytes
node_filesystem_free_bytes

Monitor Services Dashboard

Monitor Services

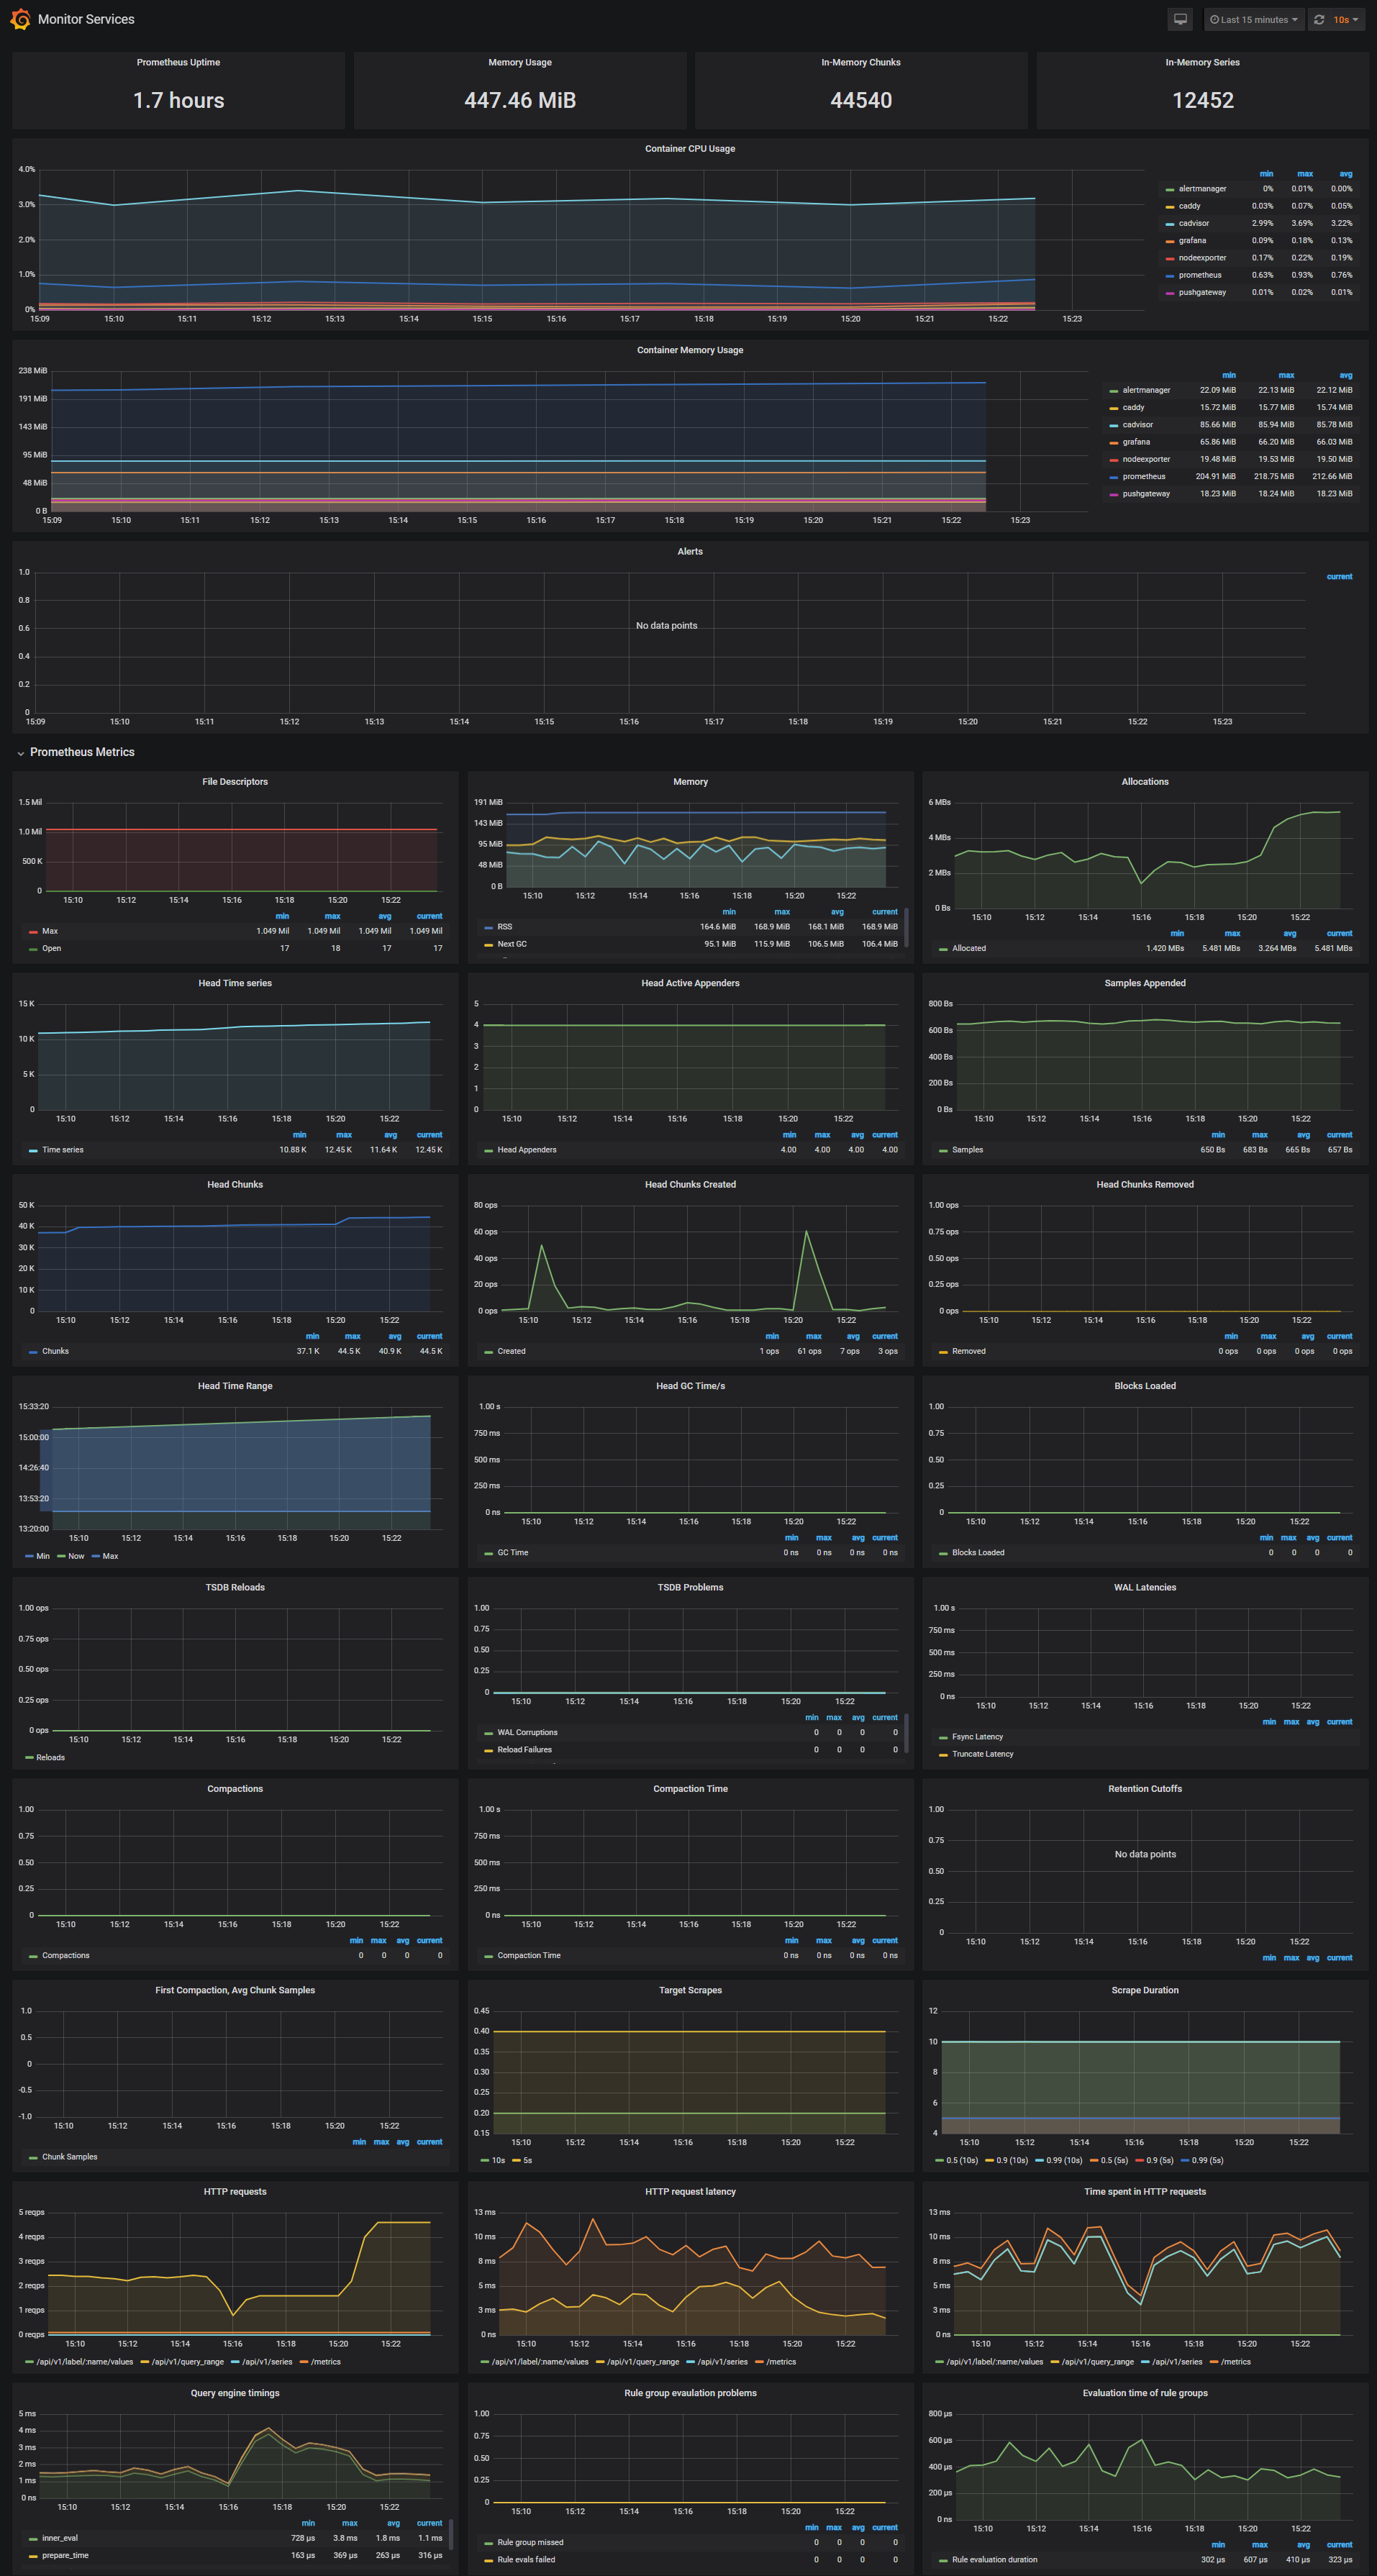
The Monitor Services Dashboard shows key metrics for monitoring the containers that make up the monitoring stack:

  • Prometheus container uptime, monitoring stack total memory usage, Prometheus local storage memory chunks and series
  • Container CPU usage graph
  • Container memory usage graph
  • Prometheus chunks to persist and persistence urgency graphs
  • Prometheus chunks ops and checkpoint duration graphs
  • Prometheus samples ingested rate, target scrapes and scrape duration graphs
  • Prometheus HTTP requests graph
  • Prometheus alerts graph

Define alerts

Three alert groups have been setup within the alert.rules configuration file:

You can modify the alert rules and reload them by making a HTTP POST call to Prometheus:

curl -X POST http://admin:admin@<host-ip>:9090/-/reload

Monitoring services alerts

Trigger an alert if any of the monitoring targets (node-exporter and cAdvisor) are down for more than 30 seconds:

- alert: monitor_service_down
    expr: up == 0
    for: 30s
    labels:
      severity: critical
    annotations:
      summary: "Monitor service non-operational"
      description: "Service {{ $labels.instance }} is down."

Docker Host alerts

Trigger an alert if the Docker host CPU is under high load for more than 30 seconds:

- alert: high_cpu_load
    expr: node_load1 > 1.5
    for: 30s
    labels:
      severity: warning
    annotations:
      summary: "Server under high load"
      description: "Docker host is under high load, the avg load 1m is at {{ $value}}. Reported by instance {{ $labels.instance }} of job {{ $labels.job }}."

Modify the load threshold based on your CPU cores.

Trigger an alert if the Docker host memory is almost full:

- alert: high_memory_load
    expr: (sum(node_memory_MemTotal_bytes) - sum(node_memory_MemFree_bytes + node_memory_Buffers_bytes + node_memory_Cached_bytes) ) / sum(node_memory_MemTotal_bytes) * 100 > 85
    for: 30s
    labels:
      severity: warning
    annotations:
      summary: "Server memory is almost full"
      description: "Docker host memory usage is {{ humanize $value}}%. Reported by instance {{ $labels.instance }} of job {{ $labels.job }}."

Trigger an alert if the Docker host storage is almost full:

- alert: high_storage_load
    expr: (node_filesystem_size_bytes{fstype="aufs"} - node_filesystem_free_bytes{fstype="aufs"}) / node_filesystem_size_bytes{fstype="aufs"}  * 100 > 85
    for: 30s
    labels:
      severity: warning
    annotations:
      summary: "Server storage is almost full"
      description: "Docker host storage usage is {{ humanize $value}}%. Reported by instance {{ $labels.instance }} of job {{ $labels.job }}."

Docker Containers alerts

Trigger an alert if a container is down for more than 30 seconds:

- alert: jenkins_down
    expr: absent(container_memory_usage_bytes{name="jenkins"})
    for: 30s
    labels:
      severity: critical
    annotations:
      summary: "Jenkins down"
      description: "Jenkins container is down for more than 30 seconds."

Trigger an alert if a container is using more than 10% of total CPU cores for more than 30 seconds:

- alert: jenkins_high_cpu
    expr: sum(rate(container_cpu_usage_seconds_total{name="jenkins"}[1m])) / count(node_cpu_seconds_total{mode="system"}) * 100 > 10
    for: 30s
    labels:
      severity: warning
    annotations:
      summary: "Jenkins high CPU usage"
      description: "Jenkins CPU usage is {{ humanize $value}}%."

Trigger an alert if a container is using more than 1.2GB of RAM for more than 30 seconds:

- alert: jenkins_high_memory
    expr: sum(container_memory_usage_bytes{name="jenkins"}) > 1200000000
    for: 30s
    labels:
      severity: warning
    annotations:
      summary: "Jenkins high memory usage"
      description: "Jenkins memory consumption is at {{ humanize $value}}."

Setup alerting

The AlertManager service is responsible for handling alerts sent by Prometheus server. AlertManager can send notifications via email, Pushover, Slack, HipChat or any other system that exposes a webhook interface. A complete list of integrations can be found here.

You can view and silence notifications by accessing http://<host-ip>:9093.

The notification receivers can be configured in alertmanager/config.yml file.

To receive alerts via Slack you need to make a custom integration by choose incoming web hooks in your Slack team app page. You can find more details on setting up Slack integration here.

Copy the Slack Webhook URL into the api_url field and specify a Slack channel.

route:
    receiver: 'slack'

receivers:
    - name: 'slack'
      slack_configs:
          - send_resolved: true
            text: "{{ .CommonAnnotations.description }}"
            username: 'Prometheus'
            channel: '#<channel>'
            api_url: 'https://hooks.slack.com/services/<webhook-id>'

Slack Notifications

Sending metrics to the Pushgateway

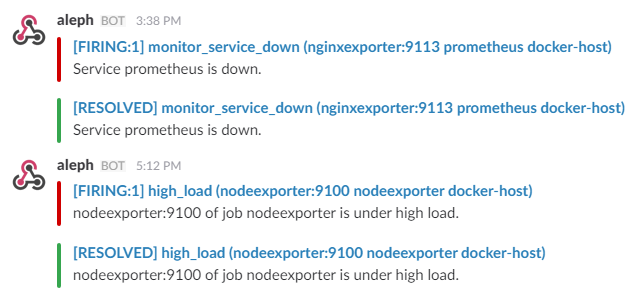
The pushgateway is used to collect data from batch jobs or from services.

To push data, simply execute:

echo "some_metric 3.14" | curl --data-binary @- http://user:password@localhost:9091/metrics/job/some_job

Please replace the user:password part with your user and password set in the initial configuration (default: admin:admin).

Updating Grafana to v5.2.2

In Grafana versions >= 5.1 the id of the grafana user has been changed. Unfortunately this means that files created prior to 5.1 won’t have the correct permissions for later versions.

Version User User ID
< 5.1 grafana 104
>= 5.1 grafana 472

There are two possible solutions to this problem.

  1. Change ownership from 104 to 472
  2. Start the upgraded container as user 104

Specifying a user in docker-compose.yml

To change ownership of the files run your grafana container as root and modify the permissions.

First perform a docker-compose down then modify your docker-compose.yml to include the user: root option:

  grafana:
    image: grafana/grafana:5.2.2
    container_name: grafana
    volumes:
      - grafana_data:/var/lib/grafana
      - ./grafana/datasources:/etc/grafana/datasources
      - ./grafana/dashboards:/etc/grafana/dashboards
      - ./grafana/setup.sh:/setup.sh
    entrypoint: /setup.sh
    user: root
    environment:
      - GF_SECURITY_ADMIN_USER=${ADMIN_USER:-admin}
      - GF_SECURITY_ADMIN_PASSWORD=${ADMIN_PASSWORD:-admin}
      - GF_USERS_ALLOW_SIGN_UP=false
    restart: unless-stopped
    expose:
      - 3000
    networks:
      - monitor-net
    labels:
      org.label-schema.group: "monitoring"

Perform a docker-compose up -d and then issue the following commands:

docker exec -it --user root grafana bash

# in the container you just started:
chown -R root:root /etc/grafana && \
chmod -R a+r /etc/grafana && \
chown -R grafana:grafana /var/lib/grafana && \
chown -R grafana:grafana /usr/share/grafana

To run the grafana container as user: 104 change your docker-compose.yml like such:

  grafana:
    image: grafana/grafana:5.2.2
    container_name: grafana
    volumes:
      - grafana_data:/var/lib/grafana
      - ./grafana/datasources:/etc/grafana/datasources
      - ./grafana/dashboards:/etc/grafana/dashboards
      - ./grafana/setup.sh:/setup.sh
    entrypoint: /setup.sh
    user: "104"
    environment:
      - GF_SECURITY_ADMIN_USER=${ADMIN_USER:-admin}
      - GF_SECURITY_ADMIN_PASSWORD=${ADMIN_PASSWORD:-admin}
      - GF_USERS_ALLOW_SIGN_UP=false
    restart: unless-stopped
    expose:
      - 3000
    networks:
      - monitor-net
    labels:
      org.label-schema.group: "monitoring"

dockprom's People

Contributors

appleboy avatar b3nk3 avatar bhumijgupta avatar davidalger avatar dbachko avatar dlh avatar guykh avatar halcyondude avatar howiezhao avatar mchukhrii avatar ncareau avatar nightah avatar ntimo avatar pascalandy avatar philyuchkoff avatar ptemplier avatar sakkiii avatar scottbrenner avatar sebastianzillessen avatar sebthemonster avatar stefanprodan avatar yunchih avatar

Stargazers

 avatar  avatar  avatar  avatar  avatar  avatar  avatar  avatar  avatar  avatar  avatar  avatar  avatar  avatar  avatar  avatar  avatar  avatar  avatar  avatar  avatar  avatar  avatar  avatar  avatar  avatar  avatar  avatar  avatar  avatar  avatar  avatar  avatar  avatar  avatar  avatar  avatar  avatar  avatar  avatar  avatar  avatar  avatar  avatar  avatar  avatar  avatar  avatar  avatar  avatar  avatar  avatar  avatar  avatar  avatar  avatar  avatar  avatar  avatar  avatar  avatar  avatar  avatar  avatar  avatar  avatar  avatar  avatar  avatar  avatar  avatar  avatar  avatar  avatar  avatar  avatar  avatar  avatar  avatar  avatar  avatar  avatar  avatar  avatar  avatar  avatar  avatar  avatar  avatar  avatar  avatar  avatar  avatar  avatar  avatar  avatar  avatar  avatar  avatar  avatar

Watchers

 avatar  avatar  avatar  avatar  avatar  avatar  avatar  avatar  avatar  avatar  avatar  avatar  avatar  avatar  avatar  avatar  avatar  avatar  avatar  avatar  avatar  avatar  avatar  avatar  avatar  avatar  avatar  avatar  avatar  avatar  avatar  avatar  avatar  avatar  avatar  avatar  avatar  avatar  avatar  avatar  avatar  avatar  avatar  avatar  avatar  avatar  avatar  avatar  avatar  avatar  avatar  avatar  avatar  avatar  avatar  avatar  avatar  avatar  avatar  avatar  avatar  avatar  avatar  avatar  avatar  avatar  avatar  avatar  avatar  avatar  avatar  avatar  avatar  avatar  avatar  avatar  avatar  avatar  avatar  avatar  avatar  avatar  avatar  avatar  avatar  avatar  avatar  avatar  avatar  avatar  avatar  avatar  avatar  avatar  avatar  avatar  avatar  avatar  avatar  avatar

dockprom's Issues

Memory limits

Hey again,

I think it would be best practice to use memory/cpu reservation & limits. I know how to do this using a stack but I don't know the syntax for compose 2.1 .

Here is an example :)

stack example

version: "3.1"

services:

  home:
    image: abiosoft/caddy
    networks:
      - ntw_front
    volumes:
      - ./www/home/srv/:/srv/
    deploy:
      mode: replicated
      replicas: 2
      #placement:
      #  constraints: [node.role==manager]
      restart_policy:
        condition: on-failure
      resources:
        limits:
          cpus: '0.20'
          memory: 9M
        reservations:
          cpus: '0.05'
          memory: 9M
      labels:
        - "traefik.backend=home"
        - "traefik.frontend.rule=PathPrefixStrip:/"
        - "traefik.port=2015"
        - "traefik.enable=true"
        - "traefik.backend.loadbalancer.method=drr"
        - "traefik.frontend.entryPoints=http"
        - "traefik.docker.network=ntw_front"
        - "traefik.weight=10"

  who1:
    image: nginx:alpine
    networks:
      - ntw_front
    volumes:
      - ./www/who1/html/:/usr/share/nginx/html/
    deploy:
      mode: replicated
      replicas: 2
      #placement:
      #  constraints: [node.role==manager]
      restart_policy:
        condition: on-failure
      resources:
        limits:
          cpus: '0.20'
          memory: 9M
        reservations:
          cpus: '0.05'
          memory: 9M
      labels:
        - "traefik.backend=who1"
        - "traefik.frontend.rule=PathPrefixStrip:/who1"
        - "traefik.port=80"
        - "traefik.enable=true"
        - "traefik.backend.loadbalancer.method=drr"
        - "traefik.frontend.entryPoints=http"
        - "traefik.docker.network=ntw_front"
        - "traefik.weight=10"

  who2:
    image: emilevauge/whoami
    networks:
      - ntw_front
    deploy:
      mode: replicated
      replicas: 2
      #placement:
      #  constraints: [node.role==manager]
      restart_policy:
        condition: on-failure
      resources:
        limits:
          cpus: '0.20'
          memory: 9M
        reservations:
          cpus: '0.05'
          memory: 9M
      labels:
        - "traefik.backend=who2"
        - "traefik.frontend.rule=PathPrefixStrip:/who2"
        - "traefik.port=80"
        - "traefik.enable=true"
        - "traefik.backend.loadbalancer.method=drr"
        - "traefik.frontend.entryPoints=http"
        - "traefik.docker.network=ntw_front"
        - "traefik.weight=10"

networks:
  ntw_front:
    external: true

# With a real domain name you will need "traefik.frontend.rule=Host:mydummysite.tk"
#
# by Pascal Andy | # https://twitter.com/askpascalandy
# https://github.com/pascalandy/docker-stack-this
#

How to have data written to the local disk

I am trying to get the data written to the local disk so that the data can be retained .

Can you please guide me how to achieve this kind of setup .

I am trying with the below configuration however everytime the container is failing to start if i remove the hash for PROMETHEUS_DATA volume

services:
prometheus:
image: prom/prometheus:v2.0.0
container_name: Prometheus-Monitoring
volumes:
- ./PROMETHEUS:/etc/prometheus/

- ./PROMETHEUS_DATA:/etc/prometheus/data

command:
  - '--config.file=/etc/prometheus/prometheus.yml'

- '--storage.tsdb.path=/etc/prometheus/data'

  - '--web.enable-lifecycle'
  - '--web.console.templates=consoles'
  - '--web.console.libraries=/etc/prometheus/console_libraries'
  - '--storage.tsdb.retention=15d'
  - '--log.level=debug'
  - '--web.enable-admin-api'
restart: unless-stopped
expose:
  - 9090
ports:
  - 9090:9090
networks:
  - monitoring
labels:
  app: monitoring

Big CPU usage while viewing Graphana

Hi!
When i open any dashboard Graphana in any browser (any OS, any PC and etc.) CPU usage increases to very high values and the browser hangs... How i can solve this problem?
2017-10-14 21-51-151

DockerFile

Is there a Dockerfile for this repo or is it missing?

Not working some of the graphs

Hi,

On dashboard docker containers, the storage load does not work and I have those errors:

Error: Multiple Series Error
at e.setValues (http://localhost:3000/public/build/0.be20b78823b4c9d93a84.js:7:277367)
at e.onDataReceived (http://localhost:3000/public/build/0.be20b78823b4c9d93a84.js:7:274881)
at o.emit (http://localhost:3000/public/build/vendor.2305a8e1d478628b1297.js:15:520749)
at t.emit (http://localhost:3000/public/build/app.5331f559bd9a1bed9a93.js:1:29217)
at e.handleQueryResult (http://localhost:3000/public/build/0.be20b78823b4c9d93a84.js:7:19860)

Container Memory usage, Sample Ingested 5M rate and container cached memory usage do not show anything.

I am using Debian OS like the host for Docker containers.

Thank you,
Ionut

cannot reload alerts

When calling the below
curl -X POST http://admin:admin@<host-ip>:9090/-/reload
it returns: Lifecycle APIs are not enabled

Add memory limits

Are you interested to add memory limits?

Something like:

    deploy:
      mode: replicated
      replicas: 2
      placement:
        constraints: [node.role==manager]
      restart_policy:
        condition: on-failure
      resources:
        limits:
          cpus: '0.25'
          memory: 192M
        reservations:
          memory: 96M

If yes, I'll do a PR.
Cheers!

Nginx dashboard - no data points

Hi,
First of all thanks for this repo. It's great work and I was looking for something like that long time. Appreciate it!

I have no data points in the Nginx dashboard. Only CPU usage.
Any idea why and what should I do to get the data?

docker-compose version error

I have docker version:
Docker version 17.06.1-ce, build 874a737

and got error:

ERROR: Version in "./docker-compose.yml" is unsupported. You might be seeing this error because you're using the wrong Compose file version. Either specify a version of "2" (or "2.0") and place your service definitions under the services key, or omit the version key and place your service definitions at the root of the file to use version 1.
For more on the Compose file format versions, see https://docs.docker.com/compose/compose-file/

is it possible to monitor containers inside another server?

Hi @stefanprodan

It seems this is not an issue.
I am just following your blog post to deploy this project and it's very nice.

I have a case that I need to install Prometheus only on one server and is it possible to monitor all containers inside another server? maybe by adding source "IP from another server" which previously we install a Prometheus client on that server.

Thank you

Unable to start Prometheus on new install

Hi

After issuing docker-compose up -d on a freshly cloned repo of dockprom with $DOCKER_HOST set to a new Debian install running a few containers, I see prometheus and alertmanager are failing to start with similar errors:

time="2017-04-03T16:03:43Z" level=info msg="Starting prometheus (version=1.5.2, branch=master, revision=bd1182d29f462c39544f94cc822830e1c64cf55b)" source="main.go:75"
time="2017-04-03T16:03:43Z" level=info msg="Build context (go=go1.7.5, user=root@1a01c5f68840, date=20170210-16:23:28)" source="main.go:76"
time="2017-04-03T16:03:43Z" level=info msg="Loading configuration file /etc/prometheus/prometheus.yml" source="main.go:248"
time="2017-04-03T16:03:43Z" level=error msg="Error loading config: couldn't load configuration (-config.file=/etc/prometheus/prometheus.yml): open /etc/prometheus/prometheus.yml: no such file or directory" source="main.go:150"

And also:

time="2017-04-03T16:20:09Z" level=info msg="Starting alertmanager (version=0.5.1, branch=master, revision=0ea1cac51e6a620ec09d053f0484b97932b5c902)" source="main.go:101"
time="2017-04-03T16:20:09Z" level=info msg="Build context (go=go1.7.3, user=root@fb407787b8bf, date=20161125-08:14:40)" source="main.go:102"
time="2017-04-03T16:20:09Z" level=info msg="Loading configuration file" file="/etc/alertmanager/config.yml" source="main.go:195"
time="2017-04-03T16:20:09Z" level=error msg="Loading configuration file failed: open /etc/alertmanager/config.yml: no such file or directory" file="/etc/alertmanager/config.yml" source="main.go:198"`

Other info:

# apt show docker-ce
[...]
Package: docker-ce
Version: 17.03.1~ce-0~debian-jessie
[...]

# lsb_release -d
Description:	Debian GNU/Linux 8.7 (jessie)

Have I misunderstood the instructions?

Thank you

No container statistics with Docker 18.01

I upgraded to Docker 18.01-ce today and it appears that I do not get any container statistics showing up from the point where I restarted the dockprom containers.

I have attempted to recreate these containers, with no luck. Everything starts up correctly, cAdvisor and the other containers do not seem to throw any errors alluding to a specific problem.

If I downgrade to Docker 17.11 this seems to work (I haven't tried 17.12, though can if required).

I am also using a zfs dataset so I had to ensure to include the following in the docker-compose.yml:

devices:
  - /dev/zfs:/dev/zfs

This was to prevent zfs errors cAdvisor was spitting out on launch (both for version 17.11 and 18.01)

# docker info
Containers: 38
 Running: 38
 Paused: 0
 Stopped: 0
Images: 41
Server Version: dev
Storage Driver: zfs
 Zpool: nerv
 Zpool Health: ONLINE
 Parent Dataset: nerv/ROOT/void
 Space Used By Parent: 10682224640
 Space Available: 471921729536
 Parent Quota: no
 Compression: on
Logging Driver: json-file
Cgroup Driver: cgroupfs
Plugins:
 Volume: local
 Network: bridge host macvlan null overlay
 Log: awslogs fluentd gcplogs gelf journald json-file logentries splunk syslog
Swarm: inactive
Runtimes: runc
Default Runtime: runc
Init Binary: docker-init
containerd version: 89623f28b87a6004d4b785663257362d1658a729
runc version: b2567b37d7b75eb4cf325b77297b140ea686ce8f
init version: 949e6fa
Security Options:
 seccomp
  Profile: default
Kernel Version: 4.14.12_4
Operating System: void
OSType: linux
Architecture: x86_64
CPUs: 4
Total Memory: 31.4GiB
Name: nerv
ID: 2J4W:CXSO:LGMT:S5YB:FZQ7:UMO6:JGPB:G2YF:IWZF:C4EO:A2SF:BV5L
Docker Root Dir: /var/lib/docker
Debug Mode (client): false
Debug Mode (server): false
Registry: https://index.docker.io/v1/
Labels:
Experimental: false
Insecure Registries:
 127.0.0.0/8
Live Restore Enabled: false
# docker version
Client:
 Version:      17.06.0-ce
 API version:  1.30
 Go version:   go1.8.3
 Git commit:   02c1d87
 Built:        Fri Jun 23 21:15:15 2017
 OS/Arch:      linux/amd64

Server:
 Version:      dev
 API version:  1.35 (minimum version 1.12)
 Go version:   go1.9.2
 Git commit:   v18.01.0-ce
 Built:        Tue Nov 28 17:25:15 2017
 OS/Arch:      linux/amd64
 Experimental: false

Inconsistent values after upgrade to Prom 2.0

Values on some graphs keep changing inconsistently and most of the time they are just N/A or 0.
screenshot from 2017-12-13 11-21-20
screenshot from 2017-12-13 11-21-30

Executing the expressions behind these graphs on the prometheus dashboard is inline with what the dashboard is showing so this could be a prometheus problem.

Here, container memory usage graph has some broken points. But I think it shouldn't have.
screenshot from 2017-12-13 11-25-57

Memory load seems fine though.
screenshot from 2017-12-13 11-26-03

On my observation the three somewhat broken graphs have one thing in common, they use container_memory_usage_bytes{image!=""}.

Hoping for someone to confirm that this does not only happen to me.

External host/containers monitoring?

I'm new to the wonderful world of containers and am having difficulty deploying this to monitor external hosts/nodes. How can I monitor additional hosts/containers beyond what this is deployed on? Maybe a more in-depth version of this comment.

How can I export these containers to another server?

Hi,
The first I'd like to thank you to provided the great tools!
I confired these suites on my Mac client, now I would like to export these containers to my monitoring server(Cetnos 7, the server has been deployed docker-ce) and installed other node exporter such as snmp_exporter, blackbox_exporter, do you know how can I migrate the suites to my server?

node exporter failed

Hi @stefanprodan :

with node_exporter 0.15.0 I am getting the following error message:

node_exporter: error: unknown short flag '-c', try --help

I have to add the following patch:

diff --git a/docker-compose.yml b/docker-compose.yml
index 6a65bff..9a1403a 100644
--- a/docker-compose.yml
+++ b/docker-compose.yml
@@ -56,9 +56,9 @@ services:
       - /sys:/host/sys:ro
       - /:/rootfs:ro
     command:
-      - '-collector.procfs=/host/proc'
-      - '-collector.sysfs=/host/sys'
-      - '-collector.filesystem.ignored-mount-points=^/(sys|proc|dev|host|etc)($$|/)'
+      - '--path.procfs=/host/proc'
+      - '--path.sysfs=/host/sys'
+      - '--collector.filesystem.ignored-mount-points=^/(sys|proc|dev|host|etc)($$|/)'

If you also confirm this as an issue, maybe allow me to make a PR to fix it, for the sake of this 😆.

I will also modify docker-compose.exporters.yml as necessary.

I think it'd be good to pin node_exporter to a specific version, say 0.14.0, what do you think?

The same issue in your technology stack between prometheus and alertmanager

Hello, here you can see error trace
{"status":"error","errorType":"bad_data","error":"start time must be before end time"}
As i understood from prometheus/prometheus#3543
This issue between Prometheus: 2.1.0 & Alertmanager: 0.13.0, actually prometheus send invalid data to alertmanager and it can't processed them. So what should we do for resolve this trouble, may be wait for new Prometheus 2.2 and Alertmanager 0.14, or how we can downgrade to Prometheus 2.0(it's resolve this issue) based on Docker Compose.
Thanks a lot for your work, you project is amazing!
P.S . In Alertmanager 0.14 Release Notes i see [BUGFIX] Don't count alerts with EndTime in the future as resolved

Monitor metrics endpoints on services

I'm trying to get the prometheus configured here to scrape the metrics endpoints of the containers, not just the stats coming from cadvisor. Maybe finding them via a label?

Just wondering if you've seen or done something similar.

Cheers,
E.

Multiple Series Error when getting Free Space

I am trying to get the free space graph working. I am using btrfs too so I set that entry in the docker_host.json.. I so went and edited the dashboard panel but when I set it to btrfs I get a "Multiple Series Error" because the response I get back from the node_exporter is an array and not a single object.

I am not sure how to filter down to the device I want. Do you have any suggestions?

my current config is just the default

(node_filesystem_size{fstype="btrfs"} - node_filesystem_free{fstype="btrfs"}) / node_filesystem_size{fstype="btrfs"}  * 100

here is the json it returns.

[{"datapoints":[[23.06336212158203,1515775249000]],"label":"{device="/dev/loop0",fstype="btrfs",instance="nodeexporter:9100",job="nodeexporter",mountpoint="/"}","id":"{device="/dev/loop0",fstype="btrfs",instance="nodeexporter:9100",job="nodeexporter",mountpoint="/"}","alias":"{device="/dev/loop0",fstype="btrfs",instance="nodeexporter:9100",job="nodeexporter",mountpoint="/"}","stats":{"total":23.06336212158203,"max":23.06336212158203,"min":23.06336212158203,"logmin":23.06336212158203,"avg":23.06336212158203,"current":23.06336212158203,"first":23.06336212158203,"delta":0,"diff":0,"range":0,"timeStep":1.7976931348623157e+308,"count":1},"legend":true,"hasMsResolution":false,"allIsNull":false,"allIsZero":false,"flotpairs":[[1515775249000,23.06336212158203]]},{"datapoints":[[23.06336212158203,1515775249000]],"label":"{device="/dev/loop0",fstype="btrfs",instance="nodeexporter:9100",job="nodeexporter",mountpoint="/rootfs/var/lib/docker"}","id":"{device="/dev/loop0",fstype="btrfs",instance="nodeexporter:9100",job="nodeexporter",mountpoint="/rootfs/var/lib/docker"}","alias":"{device="/dev/loop0",fstype="btrfs",instance="nodeexporter:9100",job="nodeexporter",mountpoint="/rootfs/var/lib/docker"}","stats":{"total":23.06336212158203,"max":23.06336212158203,"min":23.06336212158203,"logmin":23.06336212158203,"avg":23.06336212158203,"current":23.06336212158203,"first":23.06336212158203,"delta":0,"diff":0,"range":0,"timeStep":1.7976931348623157e+308,"count":1},"legend":true,"hasMsResolution":false,"allIsNull":false,"allIsZero":false,"flotpairs":[[1515775249000,23.06336212158203]]},{"datapoints":[[23.06336212158203,1515775249000]],"label":"{device="/dev/loop0",fstype="btrfs",instance="nodeexporter:9100",job="nodeexporter",mountpoint="/rootfs/var/lib/docker/btrfs"}","id":"{device="/dev/loop0",fstype="btrfs",instance="nodeexporter:9100",job="nodeexporter",mountpoint="/rootfs/var/lib/docker/btrfs"}","alias":"{device="/dev/loop0",fstype="btrfs",instance="nodeexporter:9100",job="nodeexporter",mountpoint="/rootfs/var/lib/docker/btrfs"}","stats":{"total":23.06336212158203,"max":23.06336212158203,"min":23.06336212158203,"logmin":23.06336212158203,"avg":23.06336212158203,"current":23.06336212158203,"first":23.06336212158203,"delta":0,"diff":0,"range":0,"timeStep":1.7976931348623157e+308,"count":1},"legend":true,"hasMsResolution":false,"allIsNull":false,"allIsZero":false,"flotpairs":[[1515775249000,23.06336212158203]]},{"datapoints":[[23.06336212158203,1515775249000]],"label":"{device="/dev/loop0",fstype="btrfs",instance="nodeexporter:9100",job="nodeexporter",mountpoint="/rootfs/var/lib/docker/btrfs/subvolumes/b25055e26df1be10643aa21e2963a8955cdd07ebf2a7bcad3465bdfd808a4081"}","id":"{device="/dev/loop0",fstype="btrfs",instance="nodeexporter:9100",job="nodeexporter",mountpoint="/rootfs/var/lib/docker/btrfs/subvolumes/b25055e26df1be10643aa21e2963a8955cdd07ebf2a7bcad3465bdfd808a4081"}","alias":"{device="/dev/loop0",fstype="btrfs",instance="nodeexporter:9100",job="nodeexporter",mountpoint="/rootfs/var/lib/docker/btrfs/subvolumes/b25055e26df1be10643aa21e2963a8955cdd07ebf2a7bcad3465bdfd808a4081"}","stats":{"total":23.06336212158203,"max":23.06336212158203,"min":23.06336212158203,"logmin":23.06336212158203,"avg":23.06336212158203,"current":23.06336212158203,"first":23.06336212158203,"delta":0,"diff":0,"range":0,"timeStep":1.7976931348623157e+308,"count":1},"legend":true,"hasMsResolution":false,"allIsNull":false,"allIsZero":false,"flotpairs":[[1515775249000,23.06336212158203]]},{"datapoints":[[87.30685779913249,1515775249000]],"label":"{device="/dev/md1",fstype="btrfs",instance="nodeexporter:9100",job="nodeexporter",mountpoint="/rootfs/mnt/disk1"}","id":"{device="/dev/md1",fstype="btrfs",instance="nodeexporter:9100",job="nodeexporter",mountpoint="/rootfs/mnt/disk1"}","alias":"{device="/dev/md1",fstype="btrfs",instance="nodeexporter:9100",job="nodeexporter",mountpoint="/rootfs/mnt/disk1"}","stats":{"total":87.30685779913249,"max":87.30685779913249,"min":87.30685779913249,"logmin":87.30685779913249,"avg":87.30685779913249,"current":87.30685779913249,"first":87.30685779913249,"delta":0,"diff":0,"range":0,"timeStep":1.7976931348623157e+308,"count":1},"legend":true,"hasMsResolution":false,"allIsNull":false,"allIsZero":false,"flotpairs":[[1515775249000,87.30685779913249]]},{"datapoints":[[87.71065207811158,1515775249000]],"label":"{device="/dev/md2",fstype="btrfs",instance="nodeexporter:9100",job="nodeexporter",mountpoint="/rootfs/mnt/disk2"}","id":"{device="/dev/md2",fstype="btrfs",instance="nodeexporter:9100",job="nodeexporter",mountpoint="/rootfs/mnt/disk2"}","alias":"{device="/dev/md2",fstype="btrfs",instance="nodeexporter:9100",job="nodeexporter",mountpoint="/rootfs/mnt/disk2"}","stats":{"total":87.71065207811158,"max":87.71065207811158,"min":87.71065207811158,"logmin":87.71065207811158,"avg":87.71065207811158,"current":87.71065207811158,"first":87.71065207811158,"delta":0,"diff":0,"range":0,"timeStep":1.7976931348623157e+308,"count":1},"legend":true,"hasMsResolution":false,"allIsNull":false,"allIsZero":false,"flotpairs":[[1515775249000,87.71065207811158]]},{"datapoints":[[86.93418322690847,1515775249000]],"label":"{device="/dev/md3",fstype="btrfs",instance="nodeexporter:9100",job="nodeexporter",mountpoint="/rootfs/mnt/disk3"}","id":"{device="/dev/md3",fstype="btrfs",instance="nodeexporter:9100",job="nodeexporter",mountpoint="/rootfs/mnt/disk3"}","alias":"{device="/dev/md3",fstype="btrfs",instance="nodeexporter:9100",job="nodeexporter",mountpoint="/rootfs/mnt/disk3"}","stats":{"total":86.93418322690847,"max":86.93418322690847,"min":86.93418322690847,"logmin":86.93418322690847,"avg":86.93418322690847,"current":86.93418322690847,"first":86.93418322690847,"delta":0,"diff":0,"range":0,"timeStep":1.7976931348623157e+308,"count":1},"legend":true,"hasMsResolution":false,"allIsNull":false,"allIsZero":false,"flotpairs":[[1515775249000,86.93418322690847]]},{"datapoints":[[86.96944050202295,1515775249000]],"label":"{device="/dev/md4",fstype="btrfs",instance="nodeexporter:9100",job="nodeexporter",mountpoint="/rootfs/mnt/disk4"}","id":"{device="/dev/md4",fstype="btrfs",instance="nodeexporter:9100",job="nodeexporter",mountpoint="/rootfs/mnt/disk4"}","alias":"{device="/dev/md4",fstype="btrfs",instance="nodeexporter:9100",job="nodeexporter",mountpoint="/rootfs/mnt/disk4"}","stats":{"total":86.96944050202295,"max":86.96944050202295,"min":86.96944050202295,"logmin":86.96944050202295,"avg":86.96944050202295,"current":86.96944050202295,"first":86.96944050202295,"delta":0,"diff":0,"range":0,"timeStep":1.7976931348623157e+308,"count":1},"legend":true,"hasMsResolution":false,"allIsNull":false,"allIsZero":false,"flotpairs":[[1515775249000,86.96944050202295]]},{"datapoints":[[48.815854517282645,1515775249000]],"label":"{device="/dev/sdf1",fstype="btrfs",instance="nodeexporter:9100",job="nodeexporter",mountpoint="/rootfs/mnt/cache"}","id":"{device="/dev/sdf1",fstype="btrfs",instance="nodeexporter:9100",job="nodeexporter",mountpoint="/rootfs/mnt/cache"}","alias":"{device="/dev/sdf1",fstype="btrfs",instance="nodeexporter:9100",job="nodeexporter",mountpoint="/rootfs/mnt/cache"}","stats":{"total":48.815854517282645,"max":48.815854517282645,"min":48.815854517282645,"logmin":48.815854517282645,"avg":48.815854517282645,"current":48.815854517282645,"first":48.815854517282645,"delta":0,"diff":0,"range":0,"timeStep":1.7976931348623157e+308,"count":1},"legend":true,"hasMsResolution":false,"allIsNull":false,"allIsZero":false,"flotpairs":[[1515775249000,48.815854517282645]]}]

Bug with cAdvisor on ZFS/Ubuntu

I had to add this line in docker-compose.yml:

    devices:
      - "/dev/zfs:/dev/zfs"

in the cadvisor: section.

Otherwise I got this error:

cadvisor        | Try running 'udevadm trigger' and 'mount -t proc proc /proc' as root.
cadvisor        | E0308 23:14:11.066788       1 fs.go:418] Stat fs failed. Error: exit status 1: "/usr/sbin/zfs zfs list -Hp -o name,origin,used,available,mountpoint,compression,type,volsize,quota,referenced,written,logicalused,usedbydataset myzfspool/home/root" => /dev/zfs and /proc/self/mounts are required.

No data synchronized between Docker and Prometheus

Hi,
Sometimes I can't get any data in Prometheus and although I restart the containers (Grafana, Nodeexporter, cAdvisor, Prometheus) nothing happens. So I did docker logs Prometheus and the result is :

 @[1486967534.497] source="scrape.go:579"
time="2017-02-13T06:32:15Z" level=warning msg="Error on ingesting out-of-order samples" numDropped=554 source="scrape.go:517"
time="2017-02-13T06:32:15Z" level=warning msg="Scrape health sample discarded" error="sample timestamp out of order" sample=up{instance="localhost:9090", job="prometheus"} => 1 @[1486967535.088] source="scrape.go:570"
time="2017-02-13T06:32:15Z" level=warning msg="Scrape duration sample discarded" error="sample timestamp out of order" sample=scrape_duration_seconds{instance="localhost:9090", job="prometheus"} => 0.020098991 @[1486967535.088] source="scrape.go:573"
time="2017-02-13T06:32:15Z" level=warning msg="Scrape sample count sample discarded" error="sample timestamp out of order" sample=scrape_duration_seconds{instance="localhost:9090", job="prometheus"} => 0.020098991 @[1486967535.088] source="scrape.go:576"
time="2017-02-13T06:32:15Z" level=warning msg="Scrape sample count post-relabeling sample discarded" error="sample timestamp out of order" sample=scrape_duration_seconds{instance="localhost:9090", job="prometheus"} => 0.020098991 @[1486967535.088] source="scrape.go:579"
time="2017-02-13T06:32:18Z" level=warning msg="Error on ingesting out-of-order samples" numDropped=852 source="scrape.go:517"
time="2017-02-13T06:32:18Z" level=warning msg="Scrape health sample discarded" error="sample timestamp out of order" sample=up{instance="cadvisor:8080", job="cadvisor"} => 1 @[1486967538.095] source="scrape.go:570"
time="2017-02-13T06:32:18Z" level=warning msg="Scrape duration sample discarded" error="sample timestamp out of order" sample=scrape_duration_seconds{instance="cadvisor:8080", job="cadvisor"} => 0.058924147 @[1486967538.095] source="scrape.go:573"
time="2017-02-13T06:32:18Z" level=warning msg="Scrape sample count sample discarded" error="sample timestamp out of order" sample=scrape_duration_seconds{instance="cadvisor:8080", job="cadvisor"} => 0.058924147 @[1486967538.095] source="scrape.go:576"
time="2017-02-13T06:32:18Z" level=warning msg="Scrape sample count post-relabeling sample discarded" error="sample timestamp out of order" sample=scrape_duration_seconds{instance="cadvisor:8080", job="cadvisor"} => 0.058924147 @[1486967538.095] source="scrape.go:579"
time="2017-02-13T06:32:19Z" level=warning msg="Error on ingesting out-of-order samples" numDropped=978 source="scrape.go:517"
time="2017-02-13T06:32:19Z" level=warning msg="Scrape health sample discarded" error="sample timestamp out of order" sample=up{instance="nodeexporter:9100", job="nodeexporter"} => 1 @[1486967539.499] source="scrape.go:570"
time="2017-02-13T06:32:19Z" level=warning msg="Scrape duration sample discarded" error="sample timestamp out of order" sample=scrape_duration_seconds{instance="nodeexporter:9100", job="nodeexporter"} => 0.021957840000000003 @[1486967539.499] source="scrape.go:573"
time="2017-02-13T06:32:19Z" level=warning msg="Scrape sample count sample discarded" error="sample timestamp out of order" sample=scrape_duration_seconds{instance="nodeexporter:9100", job="nodeexporter"} => 0.021957840000000003 @[1486967539.499] source="scrape.go:576"
time="2017-02-13T06:32:19Z" level=warning msg="Scrape sample count post-relabeling sample discarded" error="sample timestamp out of order" sample=scrape_duration_seconds{instance="nodeexporter:9100", job="nodeexporter"} => 0.021957840000000003 @[1486967539.499] source="scrape.go:579"
time="2017-02-13T06:32:22Z" level=warning msg="Error on ingesting out-of-order result from rule evaluation" numDropped=1 source="manager.go:296"
time="2017-02-13T06:32:23Z" level=warning msg="Error on ingesting out-of-order samples" numDropped=852 source="scrape.go:517"

and after Google research I have found that is something like I collect data from multiple hosts or I don't know.

Could you help me ?

[UPDATE] So it was working perfectly last week but when I started my computer I got this errors. Next point sometimes it sync the data but then it stop

To open or to not open public ports

It make sense to open grafana port to the public.

But I'm not not sure to understand why prometheus and alertmanager have their port public. Any particular reason for this behaviour?

Many cheers!

[Issue] can't change the password in user.config

Hi,
I want to change the password "changeme" by something like "admin" for example, so I did this in the config file:

GF_SECURITY_ADMIN_USER=admin
GF_SECURITY_ADMIN_PASSWORD=admin
GF_USERS_ALLOW_SIGN_UP=false

Then I do a docker-compose up -d

And when I go to "localhost:3000" I can only login with "changeme" (I tried with private navigator)

Alert manager SMTP

Hi Stefan,

I'm trying to set up SMTP by using the config.yml in alertmanager.

global:
  smtp_smarthost: 'x.xx.xx.xxx:25'
  smtp_from: '[email protected]'
  require_tls: false
  
route:
    receiver: 'email'

receivers:
    - name: 'email'
      email_configs:
          - to: '[email protected]'
            require_tls: false```

The alertmanager container is always in a restart loop and is not up. Could this be to the changes in config.yml file? 

[Request] Could you create a docker-compose.yml without Grafana ?

Hi,
I'm trying to make a docker-compose.yml without Grafana to deploy it on others machines and with my central one collect the infos and display them on a graphic. So to resume I want to create a docker-compose.yml to export the data of others machines.

To make that I think we only need Prometheus, cAdvisor, NodeExporter and AlertManager.
So I tried to remove the Grafana parts of the .yml but it doesn't work. Prometheus can't run and in the logs I have:

level=info msg="Starting prometheus (version=1.5.2, branch=master, revision=bd1182d29f462c39544f94cc822830e1c64cf55b)" source="main.go:75"
level=info msg="Build context (go=go1.7.5, user=root@1a01c5f68840, date=20170220-07:00:00)" source="main.go:76"
level=info msg="Loading configuration file /etc/prometheus/prometheus.yml" source="main.go:248"
level=error msg="Error opening memory series storage: leveldb: manifest corrupted (field 'comparer'): missing [file=MANIFEST-000009]" source="main.go:182"

This is the .yml that I have made :

version: '2'

networks:
  monitor-net:
    driver: bridge

volumes:
    prometheus_data: {}

services:

  prometheus:
    image: prom/prometheus
    container_name: prometheus
    volumes:
      - ./prometheus/:/etc/prometheus/
      - prometheus_data:/prometheus
    command:
      - '-config.file=/etc/prometheus/prometheus.yml'
      - '-storage.local.path=/prometheus'
      - '-alertmanager.url=http://alertmanager:9093'
      - '-storage.local.memory-chunks=100000'
    restart: unless-stopped
    expose:
      - 9090
    ports:
      - 9090:9090
    networks:
      - monitor-net
    labels:
      org.label-schema.group: "monitoring"

  alertmanager:
    image: prom/alertmanager
    container_name: alertmanager
    volumes:
      - ./alertmanager/:/etc/alertmanager/
    command:
      - '-config.file=/etc/alertmanager/config.yml'
      - '-storage.path=/alertmanager'
    restart: unless-stopped
    expose:
      - 9093
    ports:
      - 9093:9093
    networks:
      - monitor-net
    labels:
      org.label-schema.group: "monitoring"

  nodeexporter:
    image: prom/node-exporter
    container_name: nodeexporter
    restart: unless-stopped
    expose:
      - 9100
    networks:
      - monitor-net
    labels:
      org.label-schema.group: "monitoring"

  cadvisor:
    image: google/cadvisor
    container_name: cadvisor
    volumes:
      - /:/rootfs:ro
      - /var/run:/var/run:rw
      - /sys:/sys:ro
      - /var/lib/docker/:/var/lib/docker:ro
    restart: unless-stopped
    expose:
      - 8080
    networks:
      - monitor-net
    labels:
      org.label-schema.group: "monitoring"

Thank you for the help

PS: I know you have already made something like this but there isn't the Prometheus part in yours and I need it

adding new hosts

This looks great btw, fantastic work and great use of grafana.

re: "all you need to do is to deploy a node-exporter and a cAdvisor container on each host and point the Prometheus server to scrape those"

It's not clear in the docs how to do this. After deploying node-exporter and cAdvisor container on a new host, do we simply add something like this?

- job_name: 'nodeexporter'
scrape_interval: 5s
static_configs:
- targets: ['nodeexporter:9100', 'new.host.ip.address:9100']

- job_name: 'cadvisor'
scrape_interval: 5s
static_configs:
- targets: ['cadvisor:8080', 'new.host.ip.address:8080']

Or do we need to create new -job_name: entries for each host (with host IP:9100 | 8080 as the targets?

Swarm

First; VERY nice put toghter! Thank you very much for this!

I must admit, I don't have much experience with prometheus, but how would a swarm-mode setup work with this project? Would it be as easy as setting up collectors on all node and have the monitor network on overlay?

ps: Sorry for submitting this as an issue.. It is sort of a feature request 👍

Swarm mode?

This is a great combination for monitoring our Docker environment. However we are trying to get swarm mode services to show without any luck. Any suggestions?

Thanks!

nodeexporter permission denied

Got this error:

nodeexporter | time="2017-10-12T07:19:45Z" level=error msg="Error on statfs() system call for "/rootfs/var/lib/docker/containers/3ba4123c2ff67826a1869c0c3e2ac7e36beea1601b97ff3075e117448af39300/shm": permission denied" source="filesystem_linux.go:57"

Is it ok?

Docker Host: Network graph not updating

Hello,
My Host: Ubuntu Mini 16.04 LTS x64
The Network Usage graph of Host in grafana does not update.
Tested by downloading a 1 GB file using wget in host.

I thought of changing the ubuntu network interface naming from enp0s3 to eth0 on the host would work, but it didn't. Any idea how to troubleshoot?

Thanks

Docker Host Dashboard Issues

Fresh install, I've noticed that the top row (uptime, cpu, memory, etc) all display N/A unless they are deleted and re-created.

Has anyone seen this before, and is there a fix/workaround other than re-creating everything?

edit - this happens on other tabs as well

No mount in nodeexporter

Thanks, this is a great project, really helps to see all those components into action.
I'm not sure to understand how metrics are collected from the node though, as nodeexporter does not use any mounts in the compose file.
Anything I'm missing ?

Cadvisor issues on Ubuntu16.04 host

When running the project as-is on an Ubuntu16.04 host, the cadvisor fails to get to most data for the "Data Containers" dashboard. "Container Memory Usage" et al remain blank.

This is fixed by adding a /cgroup mount to the docker-compose.yml files.

Service monitoring not working

When I try to monitor an application, for example Redis, I'm having issues.
My config:

*docker-compose.yml:

prometheus:
image: stefanprodan/swarmprom-prometheus
environment:
- JOBS=redis-exporter:9121

*prometheus.yml:

  • job_name: 'redis-exporter'
    dns_sd_configs:
    • names:
      • 'tasks.redis-exporter'
        type: 'A'
        port: 9121

*compose-redis.yml:

version: '3'

networks:
mon_net:
external: true

services:
redis:
image: redis
networks:
- mon_net
ports:
- "6379:6379"
deploy:
mode: global

redis-exporter:
image: oliver006/redis_exporter
networks:
- mon_net
ports:
- "9121:9121"
deploy:
mode: global

When I run the monitoring stack and then compose-redis:

Prometheus goes up and down all the time.

Log shows:

level=error ts=2018-02-19T16:49:15.594740858Z caller=main.go:582 err="Error loading config couldn't load configuration (--config.file=/etc/prometheus/prometheus.yml): parsing YAML file /etc/prometheus/prometheus.yml: unknown fields in alertmanager config: job_name"

I have no idea how to fix this or what I did wrong.
Any help would be appreciated.

Thanks

Incorrect values for storage related graphs

For Used Storage under Docker Containers dashboard I get
screenshot from 2018-03-07 17-51-40
Which is clearly not true because I only have a 500GB drive

Then for Free Storage under Docker Host dashboard, I am not sure what my fstype is, querying node_filesystem_free on prometheus gave a lot of output. So I tried
aufs which gave
screenshot from 2018-03-07 17-51-55
and ext4 which gave
screenshot from 2018-03-07 17-58-07

which is still incorrect because df -h shows that I have 68G free.

No Datapoints

Following the README to the letter, I get no datapoints in prometheus.
Three target's are "UP".
/graph on any basic metric reports "No Datapoints"
Grafana reports the datasource "is working".
Grafana Dashboard for "Docker Containers" is empty of data.

OSX, Docker for Mac
Version 17.03.1-ce-mac5 (16048)
Channel: stable
b18e2a50cc

cAdvisor - Get http://x.x.x.x:8080/metrics: EOF

Hello team,

I'm trying to monitoring cAdvisor but i get this error message:

image

Im using this version docker:

docker-compose version 1.16.1, build 6d1ac21
Docker version 17.03.2-ce, build 7392c3b/17.03.2-ce

I was trying to change some different images of Prometheus but i get the same error.

Use different network interface

Hello,

Newer versions of Ubuntu will often have different network interface names (instead of eth0, it'll be something like enp1s0f0).

By default, if this is the case, the network monitor doesn't show any traffic and I'm afraid I can't figure out how to change this.

Could you shed some light please?

Thanks.

CPU stats not working ?

Hello,

I think I got a problem w/ CPU stats in the Container and Service Monitor dashboards while the CPU Host seems to be OK.

For example, if I run stress -c 1 in a given container, I get those data:

Host:
host

Container:
container

As you can see, I have no stats and sometimes stats stucking to 0 for my container (postgres) in the CPU Usage but the System Load seems to be good according to the stress test.

I have the same dashboard configuration as those defined in this repository and all the Dockprom containers are alive.

That's pretty strange and I don't know how to solve it, so if you have some tips it would be great !

What is this monitoring?

I am a bit confused about the different default dashboards. Does "Docker Host" live show stats for the actual machine the container is running on? Same for Prometheus? And do "Docker Containers" just show stats for all docker processes running on the system?

Caddy licensing

Hi,

We would like to use Dockprom for our company internal needs but the Caddy licensing is a no-go.
Is there a way to pull off Caddy from Dockprom ?
Strong authentication is not a need for us because we will only use it inside private networks.

Thanks

Recommend Projects

  • React photo React

    A declarative, efficient, and flexible JavaScript library for building user interfaces.

  • Vue.js photo Vue.js

    🖖 Vue.js is a progressive, incrementally-adoptable JavaScript framework for building UI on the web.

  • Typescript photo Typescript

    TypeScript is a superset of JavaScript that compiles to clean JavaScript output.

  • TensorFlow photo TensorFlow

    An Open Source Machine Learning Framework for Everyone

  • Django photo Django

    The Web framework for perfectionists with deadlines.

  • D3 photo D3

    Bring data to life with SVG, Canvas and HTML. 📊📈🎉

Recommend Topics

  • javascript

    JavaScript (JS) is a lightweight interpreted programming language with first-class functions.

  • web

    Some thing interesting about web. New door for the world.

  • server

    A server is a program made to process requests and deliver data to clients.

  • Machine learning

    Machine learning is a way of modeling and interpreting data that allows a piece of software to respond intelligently.

  • Game

    Some thing interesting about game, make everyone happy.

Recommend Org

  • Facebook photo Facebook

    We are working to build community through open source technology. NB: members must have two-factor auth.

  • Microsoft photo Microsoft

    Open source projects and samples from Microsoft.

  • Google photo Google

    Google ❤️ Open Source for everyone.

  • D3 photo D3

    Data-Driven Documents codes.