This is a project for Social Web course. We use the data from Bilibili live to detect the communities of live streamers. Github Link. Since Bilibili is a Chinese video platform/community, some of output in the notebook will have Chinese characters.
git clone this repository, open and run the jupyter notebooks in an order of p1, p2 to p6.
Since some notebooks involve a large number of web page requests and long time calculations, we have decoupled them from each other and saved all middleware (.csv) to facilitate the presentation of results.
Please read the Workflow section below to avoid the long running time that may occur.
- python packeges:
- pandas
- numpy
- igraph
- leidenalg
- matplotlib
- requests
Explaination and motivation of the code are in the code comment at the beginning of each code cell. Markdown cells are used to divide the code into different parts.
This notebook is used to get the streamers' information from Bilibili and vtb.moe via their APIs. It will generate a csv file named streamer_info.csv in the ./data folder.
This notebook is used to get all active viewers(fans) of each streamer that collect from p1. For each streamer, we save all the viewers in a csv file named by its name to the ./data/fans folder.
For real usage, you can run the p2_xxx.py script to get the same result in a faster way. It uses multi-processing to speed up the process.
This notebook is used to calculate the common (overlapping) viewers of each pair of streamers. For each streamer, we save the result in a csv file named by its name to the ./data/result folder. Eventually, we concat all the csv files to a single csv file named result.csv in the ./data folder. We add a limit of scope in line 5 to reduce the running time. You can change the limit to get the result of all streamers.
This notebook contains two parts: Data preprocessing and Community Detection. In the first part, we filter streamers with scale and add extra attributes. In the second part, we use iGraph package to build the network and use the leiden algorithm to detect communities. Basic visualization is also included. In the end, we save the information of nodes and edges to the ./data folder.
This is an auxiliary notebook used to transform the data of nodes and edges to .js or .json format that can be used in the visualization webpages.
This notebook is used to draw the plots in the report and evaluate the performance of each of the community detection algorithm.
Apart from the figures we attached in report, we also made dynamic webpages to give an more intuitive visualization of the streamer network. The webpages are in the ./visualization folder, end with .html. You can open the .html file in the browser to see the visualization.
The visualization folder contains the following files:
graph-force.html: A force-directed graph of the network.graph.html: A relationship graph (in circle style) of the network.graph-force-vsub.html: A force-directed graph of the network using a subset of original communities (all V-tubers).
(In chrome) To open the .html file correctly, you need to install a browser extension called Moesif Origin & CORS Changer. Then you can open the .html file in the browser and see the force-directed graph.
Keep the botton on when you open the .html file. 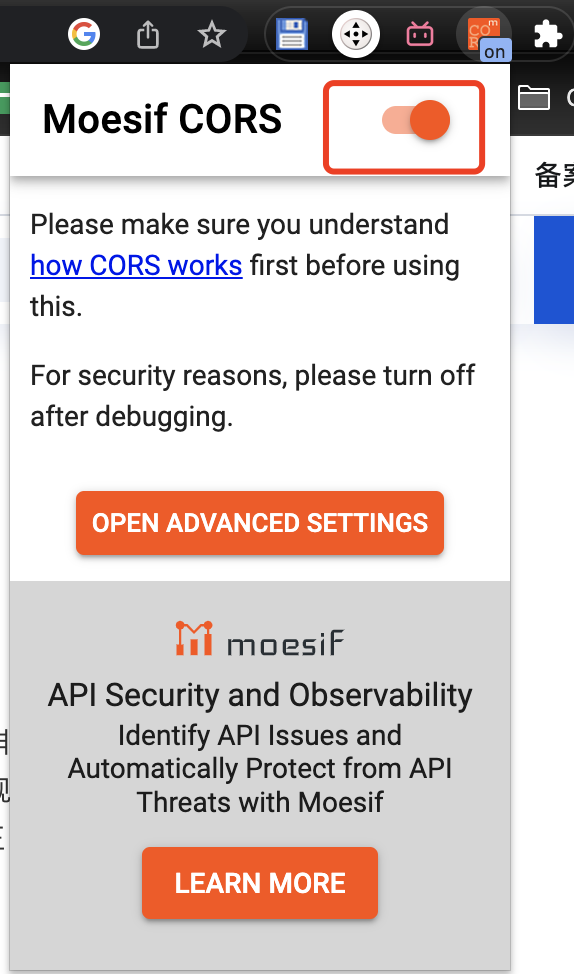
It is a problem caused by the CORS policy. Due to lack of frontend knowledge, we cannot solve this problem right now. The solution is listed above -- to use a browser extension to bypass the CORS policy.
