Plot Heatmap from latitude and longtitude using Python. Then make it work with Tile Map Service. It also has option between speed and density.
To draw a heatmap, it requires several programs. I divide them it to 4 parts:
-
Clean data
This method handles duplicate latitude,longtitude points using MySQL.
-
Divide data into small pieces
Sometimes, data is too large to load into memory at once. We should split them into chunks and process one by one. Remind that we need to normallize them to make color looks smooth.
-
Process each piece
After we split data, 1 chunk means 1 tile. We plot each tile and crop them to make them fit to map. Then we will have a full heatmap of 1 zoom level. To get the other levels we don't need to clean,split and plot them again. We just stitch four tiles as one and recursively do this to a lower zoom level.
Note that you cannot use this method to a higher zoom level.
-
Arrange the output
This method is required if we use TMS. It will modify file's name and location to the correct form.
Firstly, install the following modules: PyMySQL, NumPy, Matplotlib and Pillow.
-
Create database by Apache, MySQL and name it "test2".
-
Open Command Prompt
-
Change directory to your python directory
cd C:\Users\user\Documents\GitHub -
Run each file in order:
Example of plotting heatmap from zoomRange 6 to 12
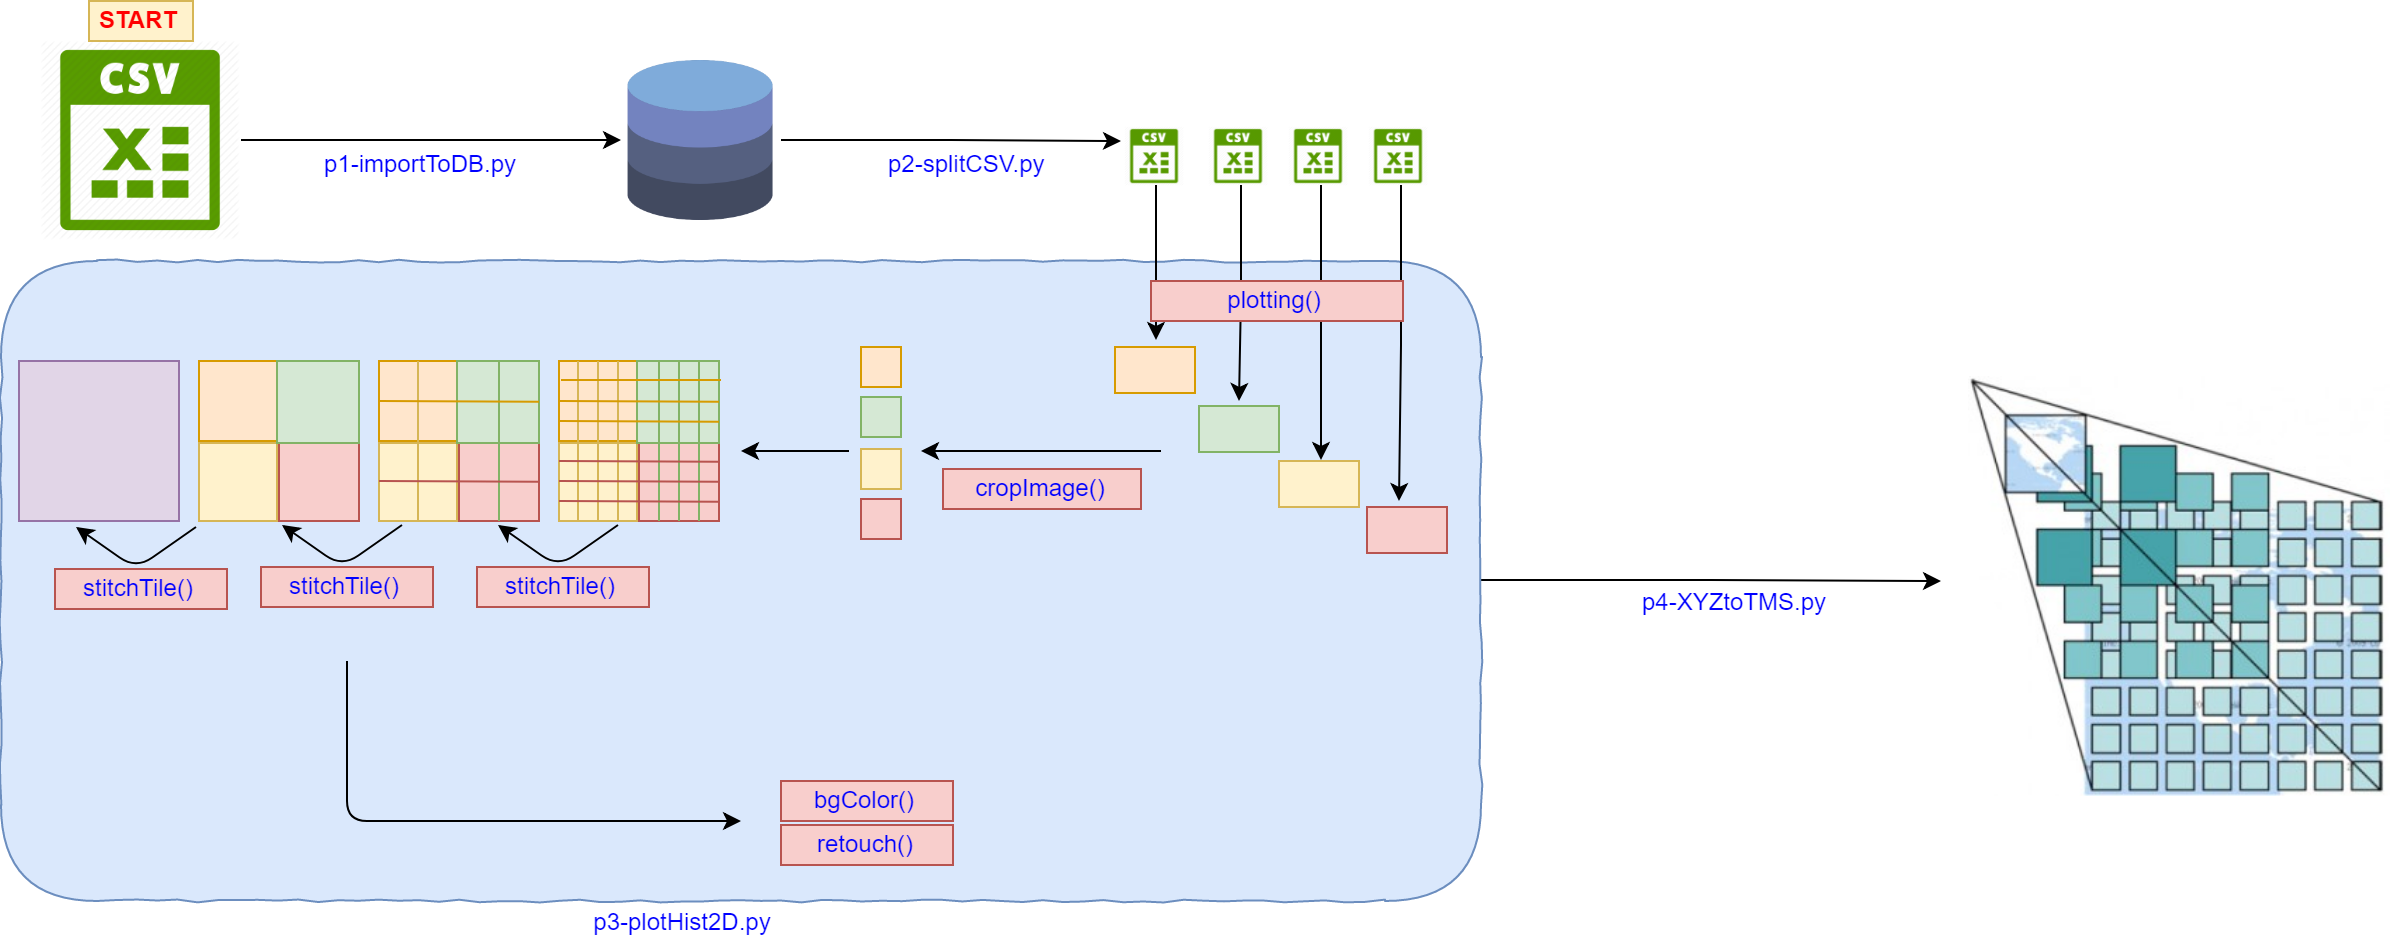
python p1-importToDB.py "/Users/user/Documents/GitHub/MapHistPlot/GPSData/mappoint.csv" --> Clean data and import them to database.
python p2-splitCSV.py --zoom 12 --> Create csv for each tile where zoomRange=12.
python p3-plotHist2d.py --min 6 --max 12 --opacity 130 --mode "speed" --> Draw heatmap of zoomRange=12 then recursively stitch them to make heatmap for zoom level 6-11 descending.
python p4-XYZtoTMS.py --min 6 --max 12 --opacity 130 --mode "speed" --> Arrange images in zoomRange 6 to 12 in the correct format.
- Open mymap.html to see the result. Learn more about Longdo Map API.
-
--csvPath:string- location of raw CSV fileImport raw data in format of .csv file to database. The form of data is shown in table below.
| ID | latitude | longtitude | speed | date | direction | xx |
|---|---|---|---|---|---|---|
| int | float | float | float | date | int | int |
An example of source file is in the "GPSData" folder.
p1CreateCSVImport()
Create table name "CSVImport" in "test2" database.
p2ImportToTable(filePath)
filePath:string- location of raw CSV file
Import .csv file from filePath to CSVImport table. The uploading size limit may cause an error.
p3CreateTemp()
Create table name "temp" in "test2" database to store data after cleaning. The primary keys are lat and lon.
getTotalRows()
Return total count of row of table "CSVImport" in database "test2".
p4UpsertTemp(totalRows)
chunkSize:int- limit of reading rowstotalRows:int- total rows of raw CSV file
Insert rows from "CSVImport" to "temp". The duplicate primary key will be recalculate to a new row.
-
--zoom:int- Range of zoomExport data from database into CSV file.
splitCSV(zoomRange,tile)
Read table "temp" from database name "test2" then export data in given zoomRange and tile(x,y). Tile must be in Google Map tile format.
The output will be stored in "/output/zoomZ/dataZ", where Z is zoomRange. For example, if zoomRange = 10, CSV file will be stored in "/output/zoom10/data10".
-
--minZoomRange:int- minimunm range of zoom -
--maxZoomRange:int- maximunm range of zoom -
--mode:string- "speed" or "density" -
--opacity:int- opacity of background image(between 0-255)Plot data into 512x512 PNG files. The format can be use in Google Map Overlay an Longdo Map Layer.
generateCmap()
Return hot array colormap but first nt(minimum value) will be transparent.
plotting(zoomRange,xmin,xmax,ymin,ymax,colorMap)
zoomRange:int- Range of zoomxmin:int- most left value of x axis in map tile systemxmax:int- most right value of x axiss in map tile systemymin:int- top value of y axis in map tile systemymax:int- bottom value of y axis in map tile systemcolorMap:list- list of 4-tuples in format of (R,G,B,A)
Read CSV file from "output/zoomZ/dataZ" and store in 2 lists, latitude and longtitude. This function will append point to a list equal to speed of that point.
For example, if (lat,lon,spd) = (10.3,15.2,120). The latitude list will append 10.2 equal to 120 times.
After this function read 500,000 rows of data or read to the end of csv soruce file, it will call createHist2d(...).
createHist2d(lonList,latList, binSize,imgName,lt,rb,cm)
latList:float- array of latitudelonList:float- array of longtitudebinSize:int- matplotlib.pyplot.hist2d binsimgName:string- output file name(need .png at the end)lt:(float,float)- (lat,lon) of left top point of a boundrb:(float,float)- (lat,lon) of bottom right point of a boundcm:list- list of 4-tuples in format of (R,G,B,A)
Draw 2D histogram on canvas size equal to lt and rb bound and save to imgName.
cropImage(zoomRange,xmin,xmax,ymin,ymax)
zoomRange:int- Range of zoomxmin:int- most left value of x axis in map tile systemxmax:int- most right value of x axiss in map tile systemymin:int- top value of y axis in map tile systemymax:int- bottom value of y axis in map tile system
Create template images for cropping and trim all images in zoomRange using bounding box range from getRange().
getRange(zoomRange,x,y)
zoomRange:int- Range of zoomx:int- x coordinate for reference tile (template image)y:int- y coordinate for reference tile (template image)
Return ranges of x axis and y axis in pixel .These ranges will be used for cropping other images.
stitchTile(zoomRange)
zoomRange:int- Range of zoom
Create a new tile in given zoomRange by stitching 4 tiles(images) from zoomRange+1 as one.
-
--min:int- minimunm range of zoom -
--max:int- maximunm range of zoom -
--mode:string- "speed" or "density" -
--opacity:int- background opacity of border image(between 0-255)Change file's name and organize them in Tile Map Service format.
toTMS(zoomRange,xmin,xmax,ymin,ymax,opacity)
zoomRange:int- Range of zoomxmin:int- most left value of x axis in map tile systemxmax:int- most right value of x axiss in map tile systemymin:int- top value of y axis in map tile systemymax:int- bottom value of y axis in map tile systemopacity:int- opacity of background (integer between 0-255), default=130
Organize files to make them work with Longdo Map API(TMS).
These files are used as library, they locate in lib folder.
- pathCheck.py
createFolder(filePath)
filePath:string- Location for new folder
Check for filePath, if not exist, create it.
- mapTool.py
tile2long(x,z)
x:int- x coordinate of a tilez:int- zoomRange
Return a minimum longtitude of all tiles in x axis.
tile2lat(y,z)
y:int- y coordinate of a tilez:int- zoomRange
Return a minimum latitude of all tiles in y axis.
getTileBound(zoomRange)
zoomRange:int- Range of zoom
Return bouding coordinate (x,y) of all tiles those cover Thailand, the output has 5 parameters. (zoomRange,xmin,xmax,ymin,ymax).
bgColor(zoomRange,opacity)
zoomRange:int- Range of zoomopacity:int- opacity of background (integer between 0-255), default=130
Fill image background with black.
retouch(zoomRange,brightness,contrast,color,sharpness)
zoomRange:int- Range of zoombrightness:int- adjust brightness of an imagecontrast:int- adjust contrast of an imagecolor:int- adjust color of an imagesharpness:int- adjust sharpness of an image
More information about ImageEnhance.
https://www.strava.com/heatmap
http://www.maptiler.org/google-maps-coordinates-tile-bounds-projection/
https://medium.com/strava-engineering/the-global-heatmap-now-6x-hotter-23fc01d301de

