How to create the Von Koch flake with python ?
import matplotlib.pyplot as plt
import math as mt- You need two libraries :
- math : To use math funciton ( there are a lot in this project ! )
- matplotlib : To draw the flake
- If you hate math, don't worry, skip this part...
- You start with a segment of 1, and for each step, you need to split in 3 part, and generate an isosceles triangle at the middle
- Let's see a pretty schema about this :
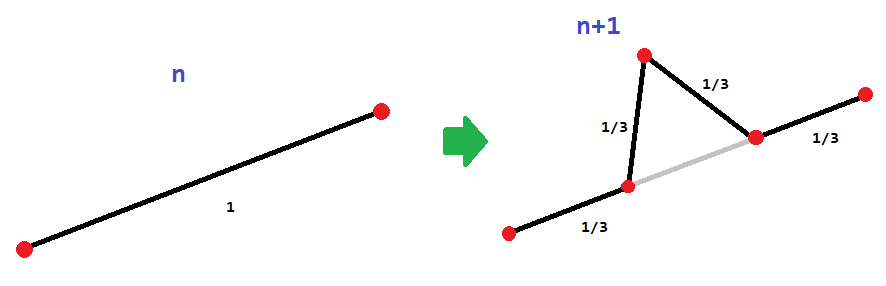
- You can do that in different way, but I choose to take two lists of position X,Y about each point.
- For example, at the beginning, i take X = [0,1] & Y = [0,0] and at the second itteration, you can add 3 points between the previous two.
- However, if you want to try this on your own, I advise you to take a pen and a piece of paper, and state the problem. Good Luck !
- This function generate the X & Y lists.
def vonkoch(order,X=[0,1],Y=[0,0]):
    if order==0:
        return (X,Y)

    for l in range(order):
        i=0
        for betwX in range(len(X)-1):
            "Math part ... "
            u = [ (X[i+1]-X[i])/3 , (Y[i+1]-Y[i])/3 ]
            v = [ 2*(X[i+1]-X[i])/3 , 2*(Y[i+1]-Y[i])/3 ]
            w = [ (X[i+1]-X[i])/2 , (Y[i+1]-Y[i])/2 ]
            n = [ -(Y[i+1]-Y[i]) , (X[i+1]-X[i]) ]
            norm_n = mt.sqrt( n[0]**2 + n[1]**2 )
            N =  [ -(Y[i+1]-Y[i])/norm_n , (X[i+1]-X[i])/norm_n ]
            L = mt.sqrt( abs(X[i+1]-X[i])**2 + abs(Y[i+1]-Y[i])**2 )
            I = [ X[i]+w[0] , Y[i]+w[1] ]
            c = L/6 * mt.tan(mt.pi/3)

            "insert at 1/3"
            X.insert(i+1, X[i]+u[0])
            Y.insert(i+1, Y[i]+u[1])

            "insert at 2/3"
            X.insert(i+2, X[i]+v[0])
            Y.insert(i+2, Y[i]+v[1])

            "insert the top"
            X.insert(i+2, I[0]+N[0]*c)
            Y.insert(i+2, I[1]+N[1]*c)

            i+= 4

return (X,Y)- You need to make a double loops, one for each operation to do in the order n, and an other to add points on all the segments.
- Furthermore, you have a part of math ( it's scary I agree ) and other part to insert new points.
- Just a function use for draw a part of the flake with matplotlib.
def trace(order):
    Xf = vonkoch(order,[0,1],[0,0])[0]
    Yf = vonkoch(order,[0,1],[0,0])[1]
    plt.plot(Xf ,Yf, color="black")
    plt.axis('equal')
    plt.show()
plt.close()- You need to do the same previous thing but with two other segments to create an isosceles triangle
def flake(order):
    X1 = vonkoch(order,[0,1],[0,0])[0]
    Y1 = vonkoch(order,[0,1],[0,0])[1]
    X2 = vonkoch(order,[1,1/2],[0,-mt.sqrt(3)/2])[0]
    Y2 = vonkoch(order,[1,1/2],[0,-mt.sqrt(3)/2])[1]
    X3 = vonkoch(order,[1/2,0],[-mt.sqrt(3)/2,0])[0]
    Y3 = vonkoch(order,[1/2,0],[-mt.sqrt(3)/2,0])[1]

    Xf = X1+X2+X3 ; Yf = Y1+Y2+Y3

    plt.plot(Xf ,Yf, color="black")
    plt.axis('equal')
    plt.show()
plt.close()- Enjoy ! You can draw a pretty lake with this command :
flake(7)- Here, n =7 it's largely enough but if you have a powerful computer, you can do better !
- Preview of the result :
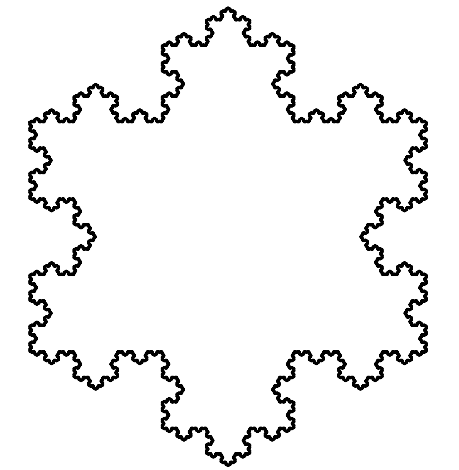
- You can zoom in to see beautiful geometry !