Giter Site home page Giter Site logo

greenflow's Introduction

greenflow

A CLI tool to help you understand how network traffic moves across the real world, what powers it, its CO2 footprint.

The dream:

Chris Adams: It works by driving a headless browser to analyse a page. My interest has been to extend it further down the stack, and then expose this, so you'd be able to picture the digital footprint of an application by seeing where geographically the packets are routed form, and what power grids they pass thorugh.

Emile Aben: that would work for both sitespeed and for traffic volumes captured by scapy / tshark , if i understand correctly

Chris Adams: yes. as I've learned more, I've figured that starting with web worked for our use case, but really, we're just looking at traffic sent over TCP and UDP

Emile Aben: trace_info_object = do_traces([[ ip1 , volume1 ], [ip2, volume2 ] .... ] )

Emile Aben: and then analyse( trace_info_object ). -> produces a report

Emile Aben: visualise( trace_info_object) => kick-ass viz of the thing

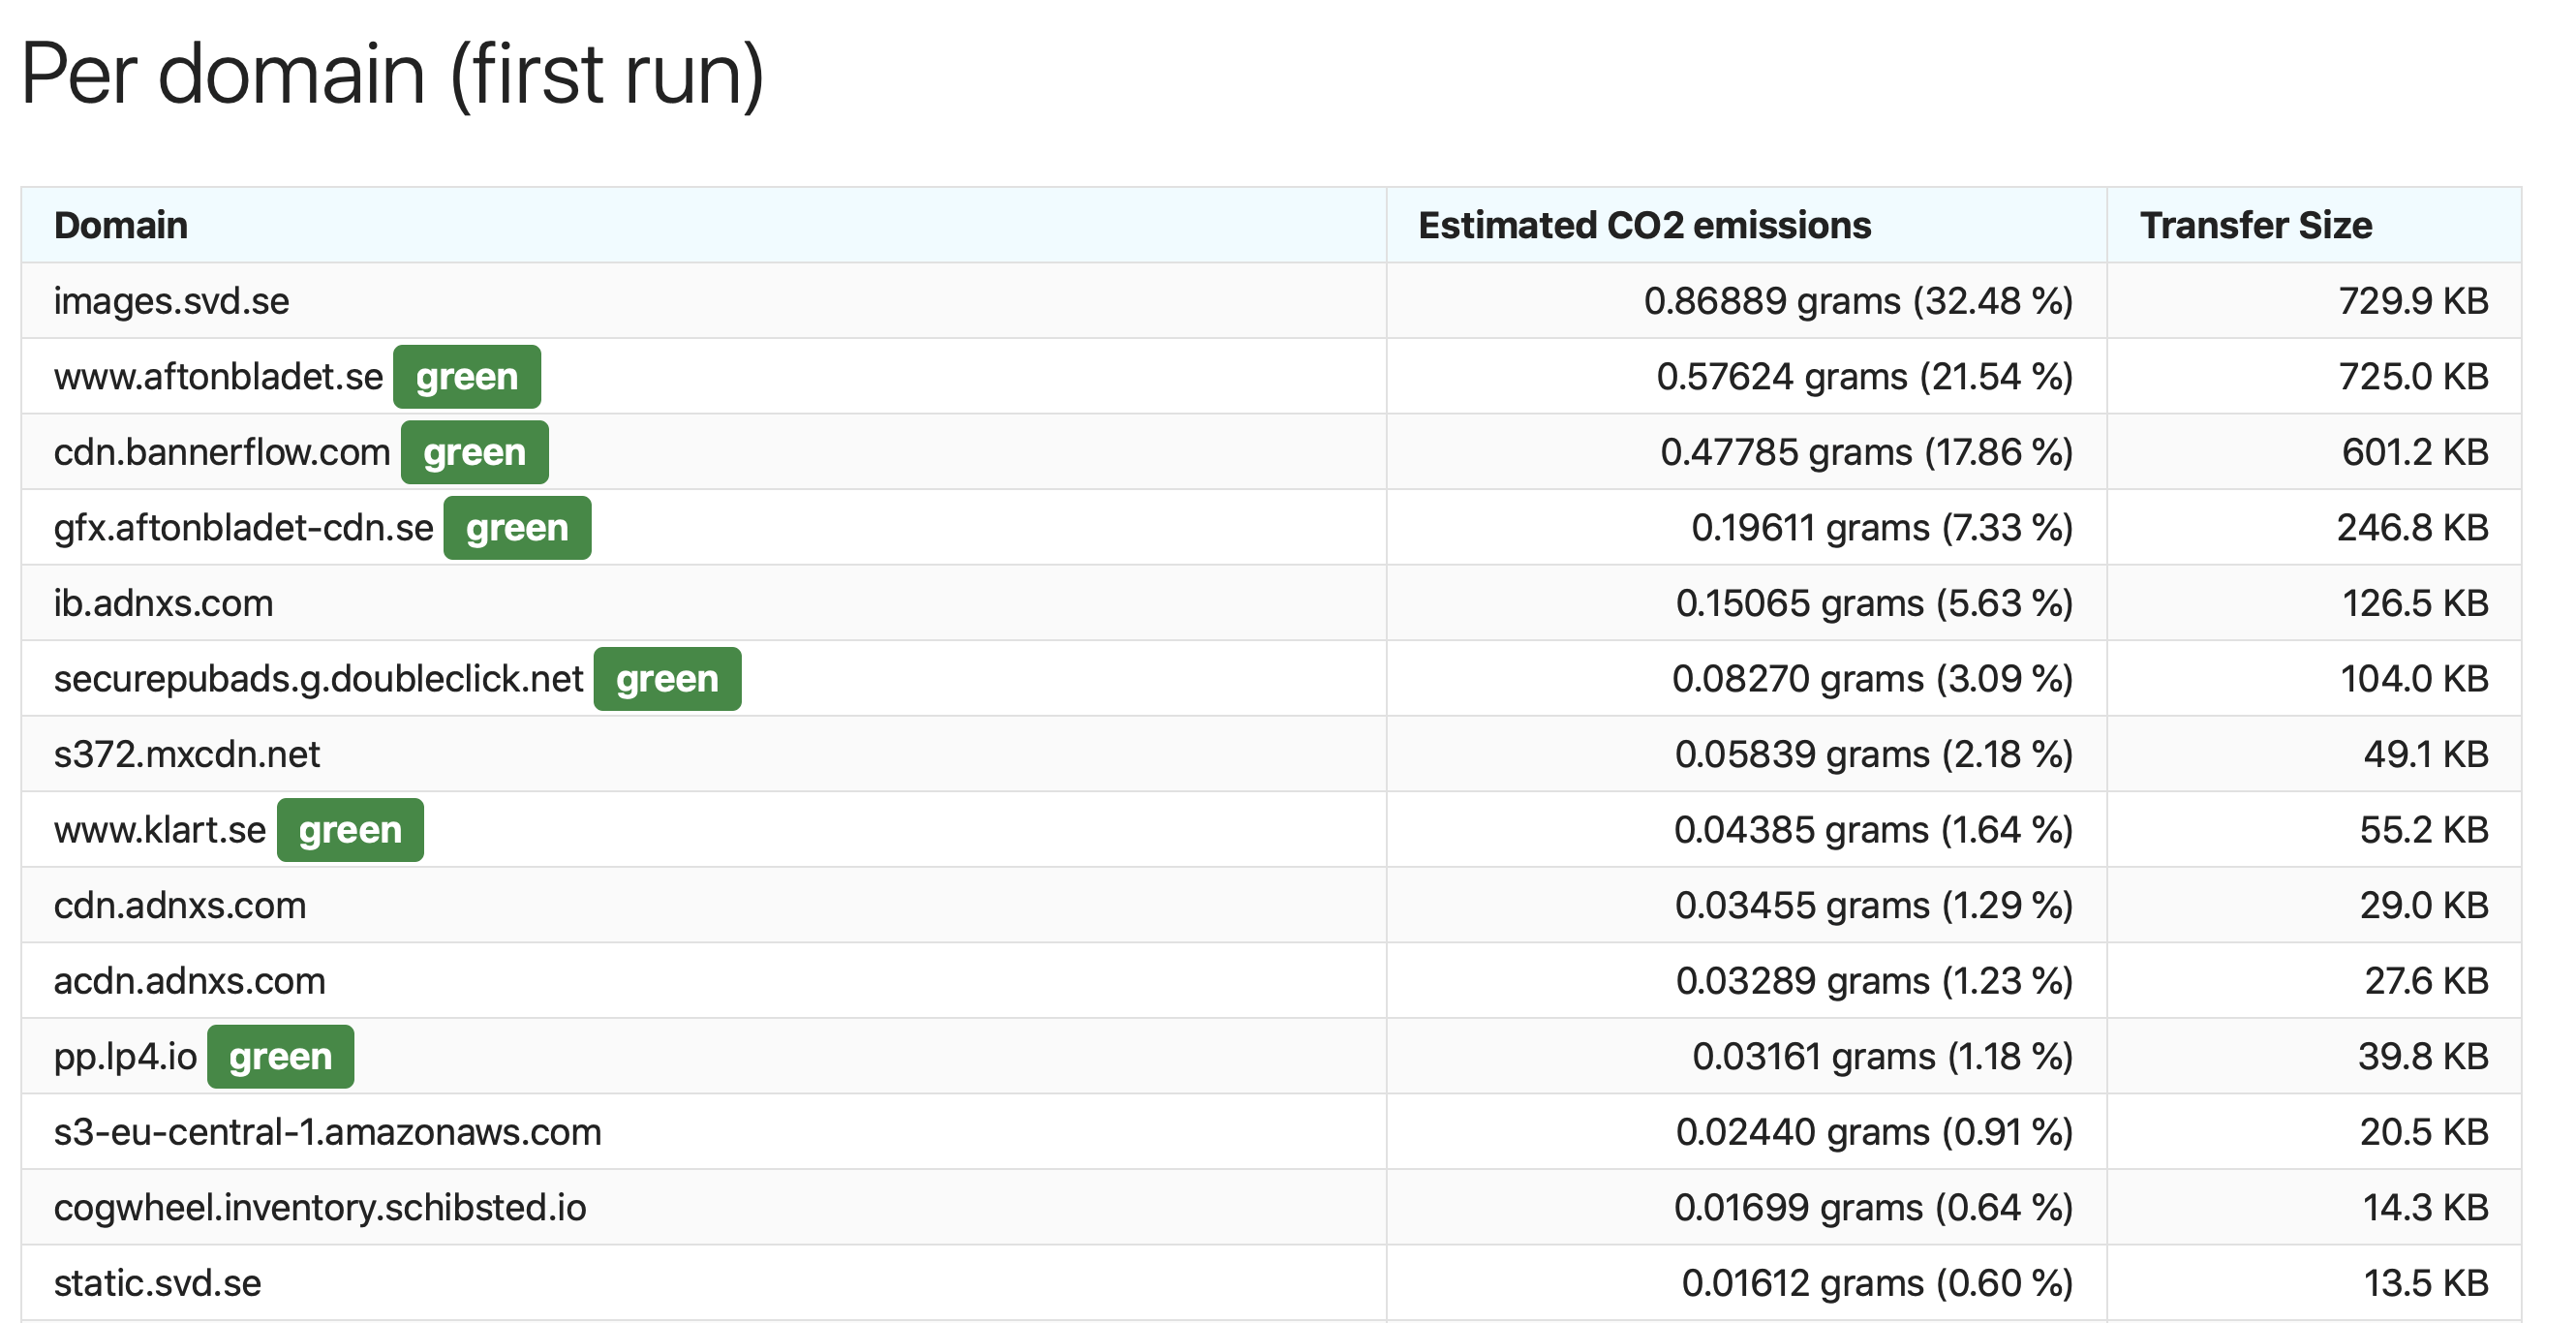
Chris Adams: EXACTLY!. See the routes, and the CO2. Websites just make lots of parallel reqs and it's easy to debug them :)

Emile Aben: trying to find the common thing (don't worry about the names of the functions just yet)

Emile Aben: ok!

Emile Aben: cool

Emile Aben: we can do this.

TODO

  • make an actual readme
  • make a starting changelog
  • sketch out a plan, and make some issues
  • actually start writing code

greenflow's People

Contributors

mrchrisadams avatar

Stargazers

 avatar

Watchers

 avatar  avatar  avatar  avatar  avatar

greenflow's Issues

Create front end vis of hops, that show how they're powered, and the volume of data transferred.

We spoke before about wanting to have a way to take:

  • the set domains/ips addresses, and corresponding volumes

And then overlay them over a geographic space, so we can encode in the viz:

  • rough geographic location of each hop
  • the volume of traffic sent
  • the grid intensity or assumed kind of power for each hop

Since I last looked, the cool viz in deck.gl got a nice python interface, which opens up new option

If we have a data structure with the correct properties on each object, i.e. (latitude, longitude, thickness), then I think we might be able to use the Arc Layer viz in in PyDeck now. Here's an example of it, and how I imagine it might look:

Screenshot 2020-08-30 at 21 17 38

Here's the format each hop needs as a minimum:

[
   *   {
   *     inbound: 72633, # the 
   *     outbound: 74735,
   *     from: {
   *       name: '19th St. Oakland (19TH)',
   *       coordinates: [-122.269029, 37.80787]
   *     },
   *     to: {
   *       name: '12th St. Oakland City Center (12TH)',
   *       coordinates: [-122.271604, 37.803664]
   *   },

Looking at the docs, there's even a couple of function that will allow us to control the colour of each hop depending on the return value for a function called on each object. This would allow us to control the color of each hop, based on whether we're going from:

  • non-green to green
  • green to green
  • green to non-green
  • non-green to non-green

We can also control the thickness of each hop in the same way, so if we have just one layer that contains all the traceroutes, we can still show the relative flow for each one.

The docs are here - there's a cool widhet to let you experiment with some of the other attributes you might want to control

https://deck.gl/docs/api-reference/layers/arc-layer

Trace routes in a sensible way, given a set of ip addresses or domain name to target.

Ideally, we want to be able to pass in a set of domains, and numerical figures for data shifted and use this to

a) make an interesting viz, showing the flow of data across each hop
b) come up with some meaningful numbers for CO2 figures data sent to and from each domain, showing them hop by hop if possible

When we discussed this, we had the idea of this working at a domain / volume level, for two reasons.

  1. It's that's something you'd be able to measure just by passively listening to your own machine
  2. We already have a source of sample data from earlier work on extending sitespeed with the sustainable web plugins.

Below is some of the sample output generated when we point sitespeed at a website url. We use a top level domain figure, where we only account for the origin server:

A screenshot of sitespeed showing the figures of carbon dioxide per domain, based on data transfer.Domains on green infrastructure are marked as 'green'

Using this library, we might get better figures, because we could take into account the energy mix of the regions packets pass through as they bounce across the planet.

Python Candidates:

  • traceroute has no documentation, and the link to the project is broken on pypi
  • dublin traceroute is much better documented, and has seen some activity in July. It seems to rely on a few C++ dependencies, which involve a bunch of steps to install separate libraries. Trying it out I saw a problem first time that I was able to fix, but then I ended up with another issue.
  • [scapy][] is the library @emileaben mentioned in earlier discussion when pointing to Julia Evan's, post.
  • traceflow is written entirely in python, but doesn't work on windows or Mac OS X. If it had wider support, I'd likely be interested in this one.

If we want to use something totally different

We also spoke about poking around in Rust. This 3 part post outlines how you might make a Python library play nicely with some underlying Rust library.

There's a few rust networking libraries that are popular and well maintained - [pnet][] looks the most interesting at the mo, but I say that as someone with basically no experience in Rust, apart from playing with the tutorial a few times.

Parking this here, as I saw David Mytton using it for some of this research at Imperial:

https://paris-traceroute.net/publications/

@emileaben - I feel like you're in a better position than me hear to make a sensible decision, and you mentioned you've played with some code already. OK if I leave this decision with you?

As long as we can output some kind of parsable format, I don't have strong preferences. Maybe an excuse to get my feet with Rust, but otherwise, not really.

Recommend Projects

  • React photo React

    A declarative, efficient, and flexible JavaScript library for building user interfaces.

  • Vue.js photo Vue.js

    ๐Ÿ–– Vue.js is a progressive, incrementally-adoptable JavaScript framework for building UI on the web.

  • Typescript photo Typescript

    TypeScript is a superset of JavaScript that compiles to clean JavaScript output.

  • TensorFlow photo TensorFlow

    An Open Source Machine Learning Framework for Everyone

  • Django photo Django

    The Web framework for perfectionists with deadlines.

  • D3 photo D3

    Bring data to life with SVG, Canvas and HTML. ๐Ÿ“Š๐Ÿ“ˆ๐ŸŽ‰

Recommend Topics

  • javascript

    JavaScript (JS) is a lightweight interpreted programming language with first-class functions.

  • web

    Some thing interesting about web. New door for the world.

  • server

    A server is a program made to process requests and deliver data to clients.

  • Machine learning

    Machine learning is a way of modeling and interpreting data that allows a piece of software to respond intelligently.

  • Game

    Some thing interesting about game, make everyone happy.

Recommend Org

  • Facebook photo Facebook

    We are working to build community through open source technology. NB: members must have two-factor auth.

  • Microsoft photo Microsoft

    Open source projects and samples from Microsoft.

  • Google photo Google

    Google โค๏ธ Open Source for everyone.

  • D3 photo D3

    Data-Driven Documents codes.