Giter Site home page Giter Site logo

jmeter-sshmon's Introduction

SSHMon Samples Collector github-actions

Overview

Apache JMeter monitoring plugin for agentless collection and plotting of remote server metrics via SSH connections.

The output of remotely executed commands can be plotted over time and/or written to JTL file (CSV or XML format).

SSHMon Samples Collector

In contrast to other plugins (such as PerfMon), the installation of a custom server agent is not required, just an SSH server and logon credentials.

The impact on the remote server is minimized by establishing a connection only once and reusing it.

This plugin is powered by JMeter-Plugins components.

Installation

Under tab "Available Plugins", select "SSHMon Samples Collector", then click "Apply Changes and Restart JMeter".

Via Package from JMeter-Plugins.org

Extract the zip package into JMeter's lib directory, then restart JMeter.

Via Manual Download

  1. Copy the jmeter-sshmon jar file into JMeter's lib/ext directory.
  2. Copy the following dependencies into JMeter's lib directory:
  3. Restart JMeter.

Important: Make sure to remove any older jar file version than jmeter-plugins-cmn-jmeter-0.6.jar from JMeter's lib directory!

Usage

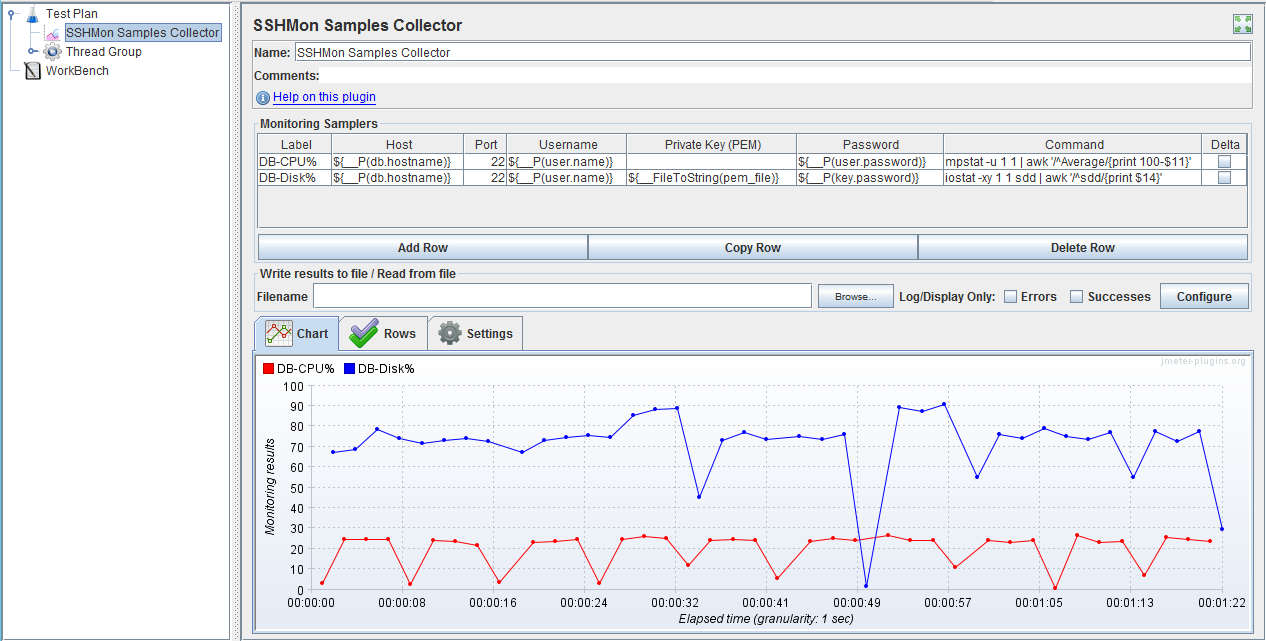
From the context menu, select "Add" / "Listeners" / "SSHMon Samples Collector".

Add one row for each metric to be collected from a remote command, such as sar, iostat, vmstat, mpstat etc.

Important: The command must return a single decimal number (integer or floating point) or it will fail! That means commands that return multiple rows and/or columns of console output will have to be filtered accordingly (e.g. via grep, awk, sed etc).

Example

Label Host Port Username Private Key (PEM) Password Command Delta
CPU% 127.0.0.1 22 jmeter secret sar -u 1 1 | awk '/^Average:/{print 100-$8}'
  • Connect to localhost on TCP port 22 with username jmeter and password secret
  • Get CPU utilisation from sar (1 sample, 1 second)
  • Filter that output for the row starting with Average
  • Take the 8th column (this may vary depending on the OS) as idle percentage and calculate the difference to 100%
  • Record and/or plot the value with label CPU%

Note that the password is not masked so it may be useful to define a variable or property (e.g. on the command line -Juser.password=secret).

Public Key Authentication

  1. Enter the username in the username field.
  2. Make the private key available in PEM format and supply the content in the private key field. In most cases when this comes from a file use the JMeter function ${__FileToString(pem_file)}.
  3. Enter the password for the private key in the password field.
  4. Make sure the public key is on the server.

Cumulative Values

In some cases the difference between sample values may be more interesting than the absolute value. The Delta check box can be ticked to record/plot the difference from the previous sample.

Chart Generation

Charts can be generated in the following ways:

  • In GUI mode, a live chart will be plotted that can be saved to an image file or copied to clipboard via right-click on the chart area.

  • In GUI mode, an output file from a previous test can be loaded via the Filename text field.

  • Without the GUI, the "Command-Line Graph Plotting Tool" may be used to generate charts by specifying the --plugin-type option like so:

    JMeterPluginsCMD.bat --plugin-type nz.co.breakpoint.jmeter.vizualizers.sshmon.SSHMonGui --input-jtl sshmon-results-filename.csv --generate-png output.png --width 800 --height 600
    

    For a full list of options refer to the plugin documentation.

Jump Hosts (since v1.3)

Sometimes the hosts to be monitored are not directly accessible from where the JMeter script runs but only through a jump host.

For this purpose, this plugin supports the SSH ProxyJump directive in an SSH config file.

The JMeter property jmeter.sshmon.sshConfig must be set to the location of such a config file. Jump hosts cannot be configured in the plugin's user interface.

Example:

The below SSH config file shows how the host target can be accessed via jumphost, in both cases authenticating as user_name with their privatekeyfile. The credentials can be omitted from the UI config.

Label Host Port Username Private Key (PEM) Password Command Delta
CPU% target 22 (some command)
Host target
    User user_name
    PreferredAuthentications publickey
    IdentityFile ./privatekeyfile
    ProxyJump jumphost
Host jumphost
    User user_name
    PreferredAuthentications publickey
    IdentityFile ./privatekeyfile

If the private key file is password protected, the JMeter property jmeter.sshmon.identityPassword can be used to define this password. (Different passwords for different files are not currently supported.)

Configuration

Chart Settings

The tabs Charts, Rows, and Settings are only relevant in GUI mode. For details refer to the JMeter-Plugins wiki.

JMeter Properties

The following properties control the plugin behaviour:

  • jmeter.sshmon.knownHosts: Filename of a known_hosts file containing public keys of trusted remote servers (in OpenSSH format). If defined, connections to unknown hosts will be rejected (via StrictHostKeyChecking=yes). If undefined, connections to unknown hosts will be established (via StrictHostKeyChecking=no). Default: undefined.
  • jmeter.sshmon.interval: Metrics collection interval in milliseconds. This is inclusive of the execution time of the remote commands. Default: 1 second.
  • jmeter.sshmon.forceOutputFile (true/false): Makes sure JMeter writes metrics to CSV file in the current directory if no filename is specified. Default: false.
  • jmeter.sshmon.locale (since v1.2; in ISO format, e.g. en_NZ): Allows to override the locale for parsing numbers returned from the monitored host, in case its locale is different from the JVM running the plugin.
  • jmeter.sshmon.sshConfig (since v1.3): Location of an optional SSH Config file to use. If undefined, an existing file (e.g. in ~/.ssh/config) will be ignored.
  • jmeter.sshmon.identityPassword (since v1.3): Password for identity files (encrypted private key).

Limitations

  • Samples are collected by a single thread, so if a command takes more than an insignificant amount of time to run, the frequency of sample collection will be limited. Even more so if more than one command is sampled. In this case, use a separate monitor for each sample command.
  • When a JMeter test ends, this plugin will not interrupt the collector thread but let the current sample finish before stopping. This may take longer than the JMeter engine waits in headless (non-GUI) mode. In this case, increase the JMeter property jmeter.exit.check.pause.
  • Cryptographic algorithms used by SSH for key exchange, signature and encryption are negotiated between client and server when a session is established. The algorithms supported by the client are determined by the Java platform's Security Provider(s). The default implementation Java Cryptography Extension (JCE) does not support all modern algorithms (e.g. Ed25519) and not all key strengths without the JCE Unlimited Strength Policy. Alternative providers can be used to overcome this limitation, such as BouncyCastle or EdDSA, by simply placing their jar file in JMeter's lib directory.
  • Only a single password can be provided for encrypted private key files (jmeter.sshmon.identityPassword), so multiple files are not supported unless they use the same password.

jmeter-sshmon's People

Contributors

tilln avatar

Stargazers

 avatar  avatar  avatar  avatar  avatar  avatar  avatar  avatar  avatar  avatar  avatar  avatar  avatar  avatar  avatar  avatar  avatar

Watchers

 avatar  avatar  avatar  avatar

jmeter-sshmon's Issues

Use meter-sshmon to get performance data from Docker instances

I am running JMeter in Kubernetes, and wanted to see how it would be possible to get performance data from Docker instances which are generated at run-time.
I have another instance of JMeter Cluster where the VMs ( where the server runs ) has known static IP addresses. In that case it's easy to run meter-sshmon.

SSHMON data parsing issue

I’m doing a performance test using Jmeter and during the test I’m collecting the statistics for backend server performance , for this purpose I use SSHMON sample collector listener in my test plan https://github.com/tilln/jmeter-sshmon

I have also configured a CSV file path to check the response data received from the server Issue is that

Data is not recorded in the CSV file and also there is no graph shown for SSHMON listener
In the jemeter logs I can see the following error

 java.text.ParseException: Unparseable number: " [2J"
    at java.text.NumberFormat.parse(NumberFormat.java:434) ~[?:?]
    at nz.co.breakpoint.jmeter.vizualizers.sshmon.SSHMonSampler.generateSamples(SSHMonSampler.java:86) [jmeter-sshmon-1.2.jar:?]
    at kg.apc.jmeter.vizualizers.MonitoringResultsCollector.processConnectors(MonitoringResultsCollector.java:215) [jmeter-plugins-cmn-jmeter-0.6.jar:?]
    at kg.apc.jmeter.vizualizers.MonitoringResultsCollector.run(MonitoringResultsCollector.java:122) [jmeter-plugins-cmn-jmeter-0.6.jar:?]   at java.lang.Thread.run(Thread.java:832) [?:?]

To verify the SSH configuration and the received data format , I tried to make a SSH connection to the backend server using putty and with same user/pwd and command , I get the data in Putty , please see the attached screenshot

Do I have to change the powershell script to change the format of CPU data, if yes then in which format? I did not get any info on plugin page.

I would really appreciate if you could provide me some help for this case.

image

Does this plugin uses ~/.ssh/config and possible to use tunnel?

Is it possible to use this plugin with configuration from ~/.ssh/config ?
For me it looks that this file is not taken into account. because i configured a hostname in config file and it get "unresolved Address"

Is it possible to use this plugin with a tunneled connection?
Because i need a tunnel to configure to the host where the interesting data is available

Custom float delimeter or parse comma as dot.

Hello,
i tried plugin i have some problem with parsing float i discovered that its not compatible with float with comma deliver like:
0,01 but it need 0.01 It would be nice to handle that, for these who are not familiar with Linux scripting, sed etc.. Comma delimeter is used for lots of locales.

Timestamp 0 in result file

Hello,

when running a test with SSHMon collecting resource utilization data, the resulting CSV is fine when running in GUI mode. However, in non-GUI mode the timestamp column's value is 0 for all the entries.

Can you please support?

Thanks
Octavian.

Running in Non gui mode in linux platform gives CannotResolveClassException

I am trying to run jmeter script with shhmo listener in linux vm using non gui mode command. Gives me the below error while starting up the test.

Error Details:

./jmeter.sh -n -t XXXXX.jmx -l results.jtl -e -o XXXX/TestRun_"date +%d%m%y%s"

Error in NonGUIDriver java.lang.IllegalArgumentException: Problem loading XML from:'XXXX.jmx'.
Cause:
CannotResolveClassException: nz.co.breakpoint.jmeter.vizualizers.sshmon.SSHMonCollector

Detail:com.thoughtworks.xstream.converters.ConversionException:
---- Debugging information ----
cause-exception : com.thoughtworks.xstream.converters.ConversionException
cause-message :
first-jmeter-class : org.apache.jmeter.save.converters.HashTreeConverter.unmarshal(HashTreeConverter.java:66)
class : org.apache.jmeter.save.ScriptWrapper
required-type : org.apache.jmeter.save.ScriptWrapper
converter-type : org.apache.jmeter.save.ScriptWrapperConverter
path : /jmeterTestPlan/hashTree/hashTree/nz.co.breakpoint.jmeter.vizualizers.sshmon.SSHMonCollector
line number : 41
version : 5.4.1

Threads get stuck on shutdown

When running in non-GUI mode with a few hundred monitoring instances (each with a single sampler row / command), threads get stuck when JMeter tries to shutdown the JVM (irrespective of increasing the jmeter.exit.check.pause) with log output like the following:

... end of run
The JVM should have exited but did not.
The following non-daemon threads are still running (DestroyJavaVM is OK):
Thread[Thread-430,5,main], stackTrace:java.lang.Object#wait
java.io.PipedInputStream#read
sun.nio.cs.StreamDecoder#readBytes
sun.nio.cs.StreamDecoder#implRead
sun.nio.cs.StreamDecoder#read
java.io.InputStreamReader#read
java.io.Reader#read
org.apache.commons.io.IOUtils#copyLarge at line:2537
org.apache.commons.io.IOUtils#copyLarge at line:2516
org.apache.commons.io.IOUtils#copy at line:2493
org.apache.commons.io.IOUtils#copy at line:2441
org.apache.commons.io.IOUtils#toString at line:1084
org.apache.commons.io.IOUtils#toString at line:1064
nz.co.breakpoint.jmeter.vizualizers.sshmon.SSHMonSampler#generateSamples at line:65
kg.apc.jmeter.vizualizers.MonitoringResultsCollector#processConnectors at line:215
kg.apc.jmeter.vizualizers.MonitoringResultsCollector#run at line:122
java.lang.Thread#run

A thread dump shows locked InputStreams, which suggests the Channel is still busy reading command output:

"Thread-430" #422 prio=5 os_prio=0 tid=0x00007f3b50388800 nid=0x504b in Object.wait() [0x00007f3b328aa000]
   java.lang.Thread.State: TIMED_WAITING (on object monitor)
	at java.lang.Object.wait(Native Method)
	at java.io.PipedInputStream.read(Unknown Source)
	- locked <0x00000000c1e94458> (a com.jcraft.jsch.Channel$MyPipedInputStream)
	at java.io.PipedInputStream.read(Unknown Source)
	- locked <0x00000000c1e94458> (a com.jcraft.jsch.Channel$MyPipedInputStream)
	at sun.nio.cs.StreamDecoder.readBytes(Unknown Source)
	at sun.nio.cs.StreamDecoder.implRead(Unknown Source)
	at sun.nio.cs.StreamDecoder.read(Unknown Source)
	- locked <0x00000000c1e964f8> (a java.io.InputStreamReader)
	at java.io.InputStreamReader.read(Unknown Source)
	at java.io.Reader.read(Unknown Source)
	at org.apache.commons.io.IOUtils.copyLarge(IOUtils.java:2537)
	at org.apache.commons.io.IOUtils.copyLarge(IOUtils.java:2516)
	at org.apache.commons.io.IOUtils.copy(IOUtils.java:2493)
	at org.apache.commons.io.IOUtils.copy(IOUtils.java:2441)
	at org.apache.commons.io.IOUtils.toString(IOUtils.java:1084)
	at org.apache.commons.io.IOUtils.toString(IOUtils.java:1064)
	at nz.co.breakpoint.jmeter.vizualizers.sshmon.SSHMonSampler.generateSamples(SSHMonSampler.java:65)
	at kg.apc.jmeter.vizualizers.MonitoringResultsCollector.processConnectors(MonitoringResultsCollector.java:215)
	at kg.apc.jmeter.vizualizers.MonitoringResultsCollector.run(MonitoringResultsCollector.java:122)
	- locked <0x00000000c015b010> (a nz.co.breakpoint.jmeter.vizualizers.sshmon.SSHMonCollector)
	at java.lang.Thread.run(Unknown Source)

Recommend Projects

  • React photo React

    A declarative, efficient, and flexible JavaScript library for building user interfaces.

  • Vue.js photo Vue.js

    🖖 Vue.js is a progressive, incrementally-adoptable JavaScript framework for building UI on the web.

  • Typescript photo Typescript

    TypeScript is a superset of JavaScript that compiles to clean JavaScript output.

  • TensorFlow photo TensorFlow

    An Open Source Machine Learning Framework for Everyone

  • Django photo Django

    The Web framework for perfectionists with deadlines.

  • D3 photo D3

    Bring data to life with SVG, Canvas and HTML. 📊📈🎉

Recommend Topics

  • javascript

    JavaScript (JS) is a lightweight interpreted programming language with first-class functions.

  • web

    Some thing interesting about web. New door for the world.

  • server

    A server is a program made to process requests and deliver data to clients.

  • Machine learning

    Machine learning is a way of modeling and interpreting data that allows a piece of software to respond intelligently.

  • Game

    Some thing interesting about game, make everyone happy.

Recommend Org

  • Facebook photo Facebook

    We are working to build community through open source technology. NB: members must have two-factor auth.

  • Microsoft photo Microsoft

    Open source projects and samples from Microsoft.

  • Google photo Google

    Google ❤️ Open Source for everyone.

  • D3 photo D3

    Data-Driven Documents codes.