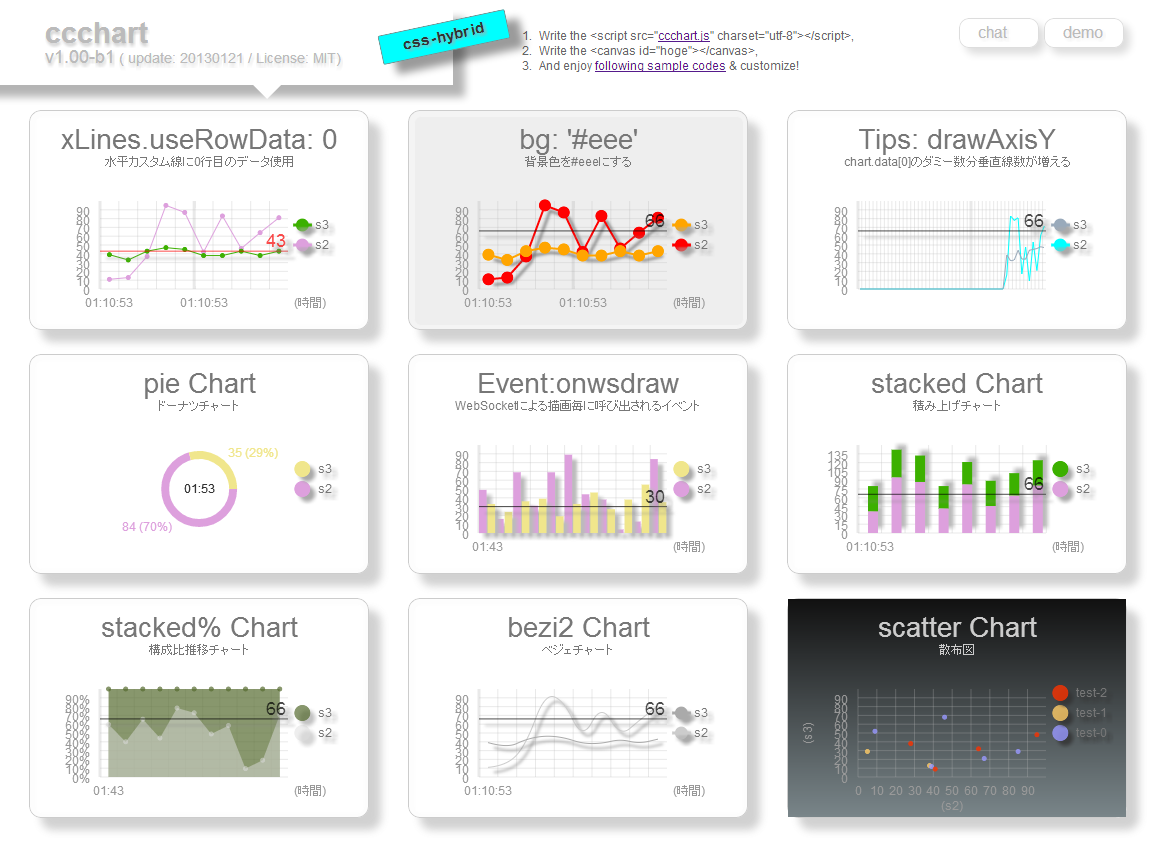
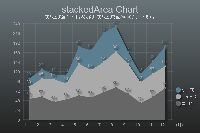
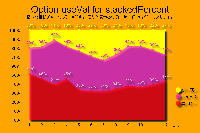
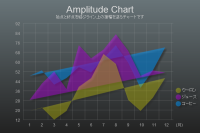
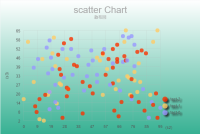
This is a Simple and Realtime JavaScript chart library that does not depend on libraries such as jQuery or google APIs. You can use the following chart types. line, bar, pie, bezi, bezi2, stacked, area, stackedarea, stacked%, ampli, scatter, candle.
@see https://ccchart.com/ @see https://ccchart.com/test/ws2.htm @doc (old) https://ccchart.com/doc/ccchart-1.06.3.pdf @blog https://ngw.jp/~tato/wp/?tag=ccchart @chat https://cht.pw/chat.htm
MIT
$ cd ./YourDir
$ npm i -g bower
$ bower i ccchart
ccchart directory has been generated.
YourDir/
  bower_components/
    ccchart/
        README.md
        ccchart-min.js
        ccchart.js
        update.json
plugins/I will make ccchart v2 later and make it public domain.
Current Release: 2016/11/05 v1.12.084
2016/11/1 Automatic extraction ccchart Reference
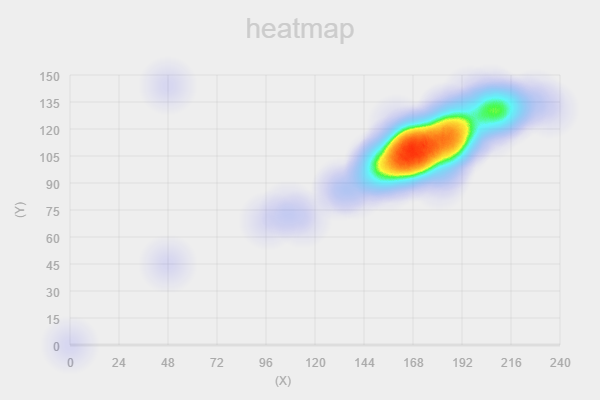
2016/02/18 add heatmap Type
Demo https://ccchart.com/#102
Demo Realtime https://ccchart.com/test/heatmap/test1-hmp-v1.12.01-ws.htm
#9
@see https://ngw.jp/~tato/wp/?p=3737
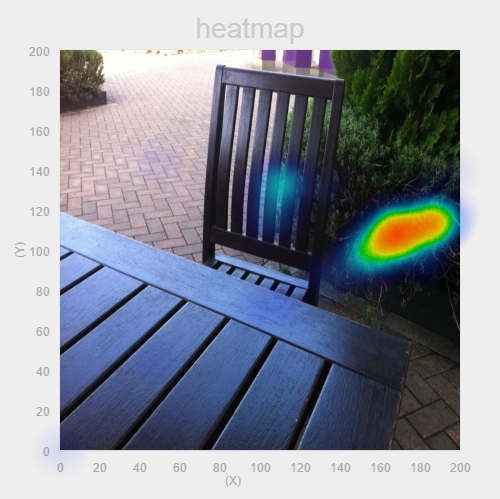
Demo heatmap Fit the image
https://ccchart.com/test/heatmap/test1.htm
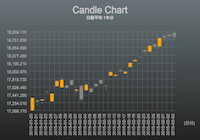
2015/09/08 add Candle Type
Demo ccchart.com: https://ccchart.com/#100 https://ccchart.com/test/candle/test-ws.htm
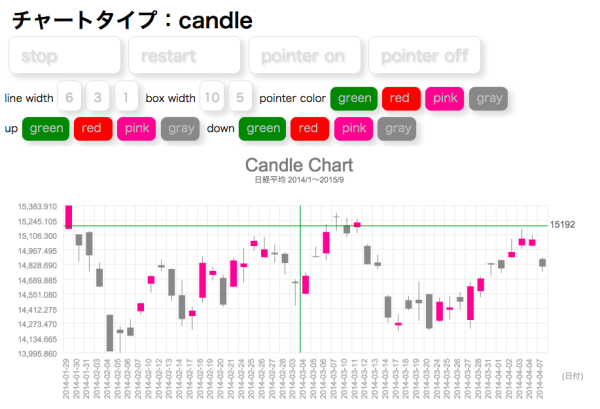
Demo jsfiddle.net: https://jsfiddle.net/UkdvS/455/
<script src="https://ccchart.com/js/ccchart.js" charset="utf-8"></script>
<canvas id="hoge"></canvas>
<script>
var chartdata1 = {
"config": {
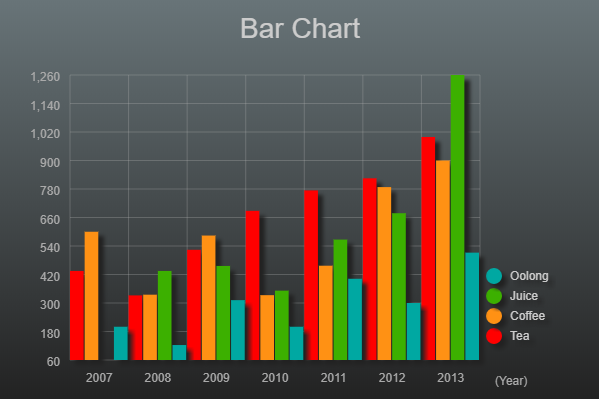
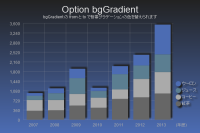
"title": "Bar Chart",
"type": "bar"
},
"data": [
["Year",2007,2008,2009,2010,2011,2012,2013],
["Tea",435,332,524,688,774,825,999],
["Coffee",600,335,584,333,457,788,900],
["Juice",60,435,456,352,567,678,1260],
["Oolong",200,123,312,200,402,300,512]
]
};
ccchart.init('hoge', chartdata1)
</script>
Demo jsfiddle.net: https://jsfiddle.net/UkdvS/451/
<script src="https://ccchart.com/js/ccchart.js" charset="utf-8"></script>
<canvas id="hoge"></canvas>
<script>
var chartdata1 = {
"config": {
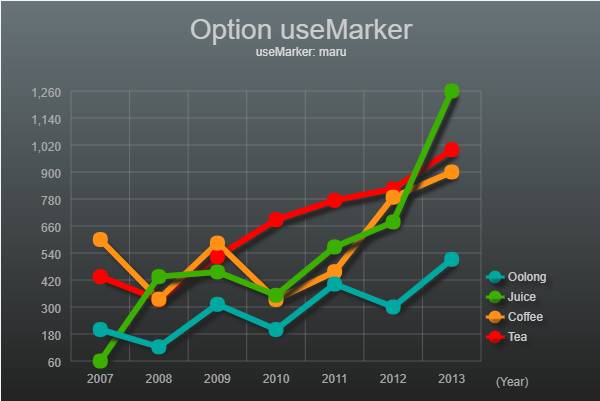
"title": "Option useMarker",
"subTitle": "useMarker: maru",
"type": "line",
"useMarker": "maru",
"lineWidth": 6,
"markerWidth": 15
},
"data": [
["Year",2007,2008,2009,2010,2011,2012,2013],
["Tea",435,332,524,688,774,825,999],
["Coffee",600,335,584,333,457,788,900],
["Juice",60,435,456,352,567,678,1260],
["Oolong",200,123,312,200,402,300,512]
]
};
ccchart.init('hoge', chartdata1)
</script>
pie: https://ccchart.com/#79 , https://ccchart.com/#89 ,
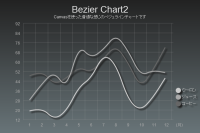
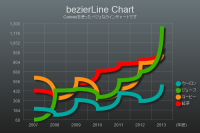
bezi2: https://ccchart.com/#6 , https://ccchart.com/#85 ,
bezi: https://ccchart.com/#3 ,
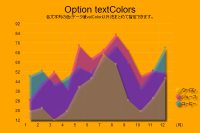
area: https://ccchart.com/#50 , https://ccchart.com/#51 , https://ccchart.com/#50 , https://ccchart.com/#86 ,
stacked: https://ccchart.com/#93 , https://ccchart.com/#4 , https://ccchart.com/#83 ,
stackedarea: https://ccchart.com/#53 , https://ccchart.com/#87 ,
stacked%: https://ccchart.com/#55 , https://ccchart.com/#54 , https://ccchart.com/#88 ,
ampli: https://ccchart.com/#5 , https://ccchart.com/#84 ,
scatter: , https://jsfiddle.net/UkdvS/732/ https://ccchart.com/#91 , https://ccchart.com/#91 ,
candle: https://ccchart.com/#99 , https://ccchart.com/#100 ,
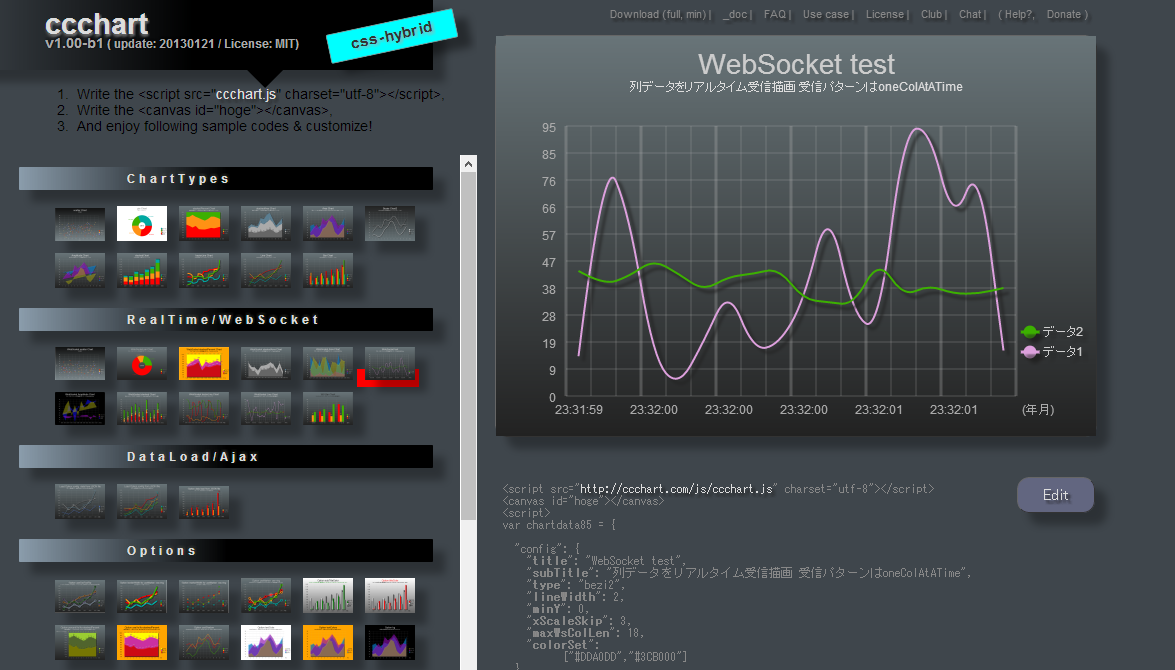
Demo ccchart.com: https://ccchart.com/#85
Client Side
<script src="https://ccchart.com/js/ccchart.js" charset="utf-8"></script>
<canvas id="hoge"></canvas>
<script>
var chartdata1 = {
  "config": {
    "title": "WebSocket test",
    "subTitle": "realtime chart",
    "type": "bezi2",
    "lineWidth": 2,
    "minY": 0,
    "xScaleSkip": 3,
    "maxWsColLen": 18,
    "colorSet":
          ["#DDA0DD","#3CB000"]
  },
  "data": [
    ["time"],
    ["data1"],
    ["data2"]
  ]
};
  ccchart
      .init('hoge', chartdata1)
      .ws('ws://ccchart.com:8016')
      .on('message', ccchart.wscase.oneColAtATime)
</script>
var WsServer = require('ws').Server;
var tid;
var ws = new WsServer({
    host: 'ccchart.com',
    port: 8016
});
broadCast();//start
function broadCast() {
    tid = setInterval(function() {
        var dataAry = mkData();
        ws.clients.forEach(function(client) {
            if (client.readyState === 1)
                client.send(JSON.stringify(dataAry));
        });
    }, 200);
}
function mkData() {
    var data = [
        ["Year"],
        ["s2"],
        ["s3"]
    ];
    var now = new Date();
    var H = now.getHours();
    var M = now.getMinutes();
    var S = now.getSeconds();
    H = (H < 10) ? '0' + H : H;
    M = (M < 10) ? '0' + M : M;
    S = (S < 10) ? '0' + S : S;
    data[0] = H + ':' + M + ':' + S;
    data[1] = Math.floor(Math.random(10) * 96);
    data[2] = 32 + Math.floor(Math.random(10) * 18);
    return data;
}
//on connection for Heartbeat これはハートビート用なのでいらなければ無くてもOK
// ccchart はデフォルトでは60秒に一度"Heartbeat"という文字列を
// サーバーへ送り、その返信である"Heartbeat"文字列を受信しています
ws.on('connection', function(socket) {
    console.log(
        'conned: ' + ws.clients.length, (new Date),
        socket.upgradeReq.socket.remoteAddress
    );
    socket.on('message', function(msg) {
        var msg = JSON.stringify(msg);
        if (msg === 'Heartbeat') {
            if (socket.readyState === 1) {
                socket.send(msg);
                console.log(msg);
            }
        }
    });
});
ccchart.com: https://ccchart.com/#88, https://ccchart.com/#89, https://ccchart.com/#81
- [ WebSocket func ] blog | ccchart.wscase.plain
- [ Pointer ] blog | ccchart.crossPointer(op)
- [ Drop & Drow ] blog | ccchart.dropDraw()
- [ showcase ] さまざまなチャート
- [ base Method ] グローバル config のデフォルト値設定
- [ add Method ] 2つのチャートを複合させる.add, .after, .before [new]
- [ data ] チャートデータの列と行を交換する
- [ data ] データがしきい値に達したら何か実行する [new]
- [ value ] 値表示とパーセント表示
- [ value ] percentValを使わずにパーセント表示
- [ img ] 複数画像の埋め込みと透明化
- [ Tooltip ] ツールチップの CSS カスタマイズ
- [ Tooltip ] ツールチップのためのテンプレート記法
- [ Tooltip ] Bar チャート用のツールチップ
- [ Tooltip ] ツールチップ on the リアルタイム
- [ WebSocket ] WebSocketの受信サンプル
- [ WebSocket ] ccchartへサーバー側WebSocketから流し込む
- [ WebSocket ] WebSocketで受信するデータパターン関数
- [ WebSocket ] 受信パターン関数名を取得する
- [ WebSocket ] 着信データを間引く
- [ WebSocket ] id名/最新wsOjのkey/value
- [ WebSocket ] ws接続のインスタンスをidで取得
- [ WebSocket Debug ] WebSocket使用時のデバック用プロパティ
- [ WebSocket Debug ] WebSocket切断時の再接続テスト [new]
- [ DragDrop ] ファイルドロップでチャート表示
- [ Scale ] 軸目盛値の端数処理(丸め)の桁数を指定する
- [ Scale ] 軸目盛値の端数処理(丸め)の桁数を指定する
- [ Scale ] 水平目盛り線の本数を指定する axisXLen
- [ Scale ] 水平軸目盛の傾き xScaleRotate
- [ Scale ] 水平目盛り線の幅 axisXWidth [new]
- [ Scale ] 垂直目盛り線の幅 axisYWidth [new]
- [ Scale ] 垂直スキップ線の幅 axisYSkipWidth [new]
- [ Scale ] 垂直軸目盛値にパーセント yScalePercent [new]
- [ Scale ] 凡例を使わない useHanrei
- [ Scale ] Y軸0基準線の上下にチャート表示 line, bar, bezi2, bezi
- [ Scale ] Y軸目盛の天地を反転する yScaleOrder
- [ xLine ] カスタムXラインの上下を塗る fillOver, fillUnder [new]
- [ xLines ] 最高値や最小値を xLines で表示する [new]
- [ Hanrei ] hanreiAlignを設定する
- [ Hanrei ] 凡例1行の高さを設定する hanreiLineHeight
- [ Title ] titleTextAlign, titleX [new]
- [ SubTitle ] subTitleTextAlign, subTitleX [new]
- [ Data ] データの1列目目を各行の項目名とする
- [ Data ] データの1行目を項目名とする
- [ Pie ] 値の位置オフセットを調整する
- [ Candle ] Candle Type [new]
- [ CSV ] CSVを読み込んでテーブルとチャートを表示する
- [ CSV ] 読み込むCSVに3桁カンマが含まれててもOK
- drawLine line
- drawBar bar
- drawPie pie
- drawbeziLine bezi
- drawbeziLine2 bezi2
- drawStackedBar stacked
- drawArea area
- drawStackedArea stackedarea
- drawStackedPercent stacked%
- drawAmplitude ampli
- drawScatter scatter
- drawHeatmap heatmap
- drawCandle candle
- ws :
test3


