Giter Site home page Giter Site logo

saw's Introduction

Saw

saw is a multi-purpose tool for AWS CloudWatch Logs

Saw Gif

Go Report Card

Features

  • Colorized output that can be formatted in various ways

    • --expand Explode JSON objects using indenting
    • --rawString Print JSON strings instead of escaping ("\n", ...)
    • --invert Invert white colors to black for light color schemes
    • --raw, or --pretty, for watch and get commands respectively, toggles display of the timestamp and stream name prefix.
  • Filter logs using CloudWatch patterns

    • --filter foo Filter logs for the text "foo"
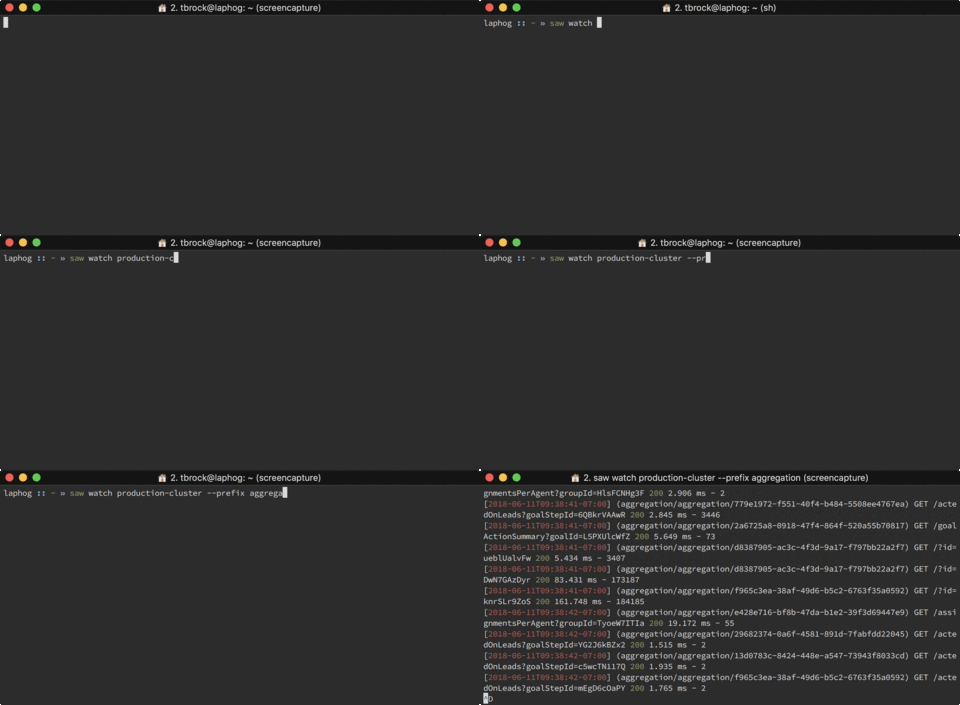
  • Watch aggregated interleaved streams across a log group

    • saw watch production Stream logs from production log group
    • saw watch production --prefix api Stream logs from production log group with prefix "api"

Usage

  • Basic

    # Get list of log groups
    saw groups
    
    # Get list of streams for production log group
    saw streams production
  • Watch

    # Watch production log group
    saw watch production
    
    # Watch production log group streams for api
    saw watch production --prefix api
    
    # Watch production log group streams for api and filter for "error"
    saw watch production --prefix api --filter error
  • Get

    # Get production log group for the last 2 hours
    saw get production --start -2h
    
    # Get production log group for the last 2 hours and filter for "error"
    saw get production --start -2h --filter error
    
    # Get production log group for api between 26th June 2018 and 28th June 2018
    saw get production --prefix api --start 2018-06-26 --stop 2018-06-28

Profile and Region Support

By default Saw uses the region and credentials in your default profile. You can override these to your liking using the command line flags:

# Use personal profile
saw groups --profile personal

# Use us-west-1 region
saw groups --region us-west-1

Installation

Run from Docker

docker run --rm -it -v ~/.aws:$HOME/.aws tbrock/saw

Mac OS X

brew tap TylerBrock/saw
brew install saw

Linux

Arch Linux (source)

# Using yay
yay saw

# Using makepkg
git clone https://aur.archlinux.org/saw.git
cd saw
makepkg -sri

Red Hat Based Distributions (Fedora/RHEL/CentOS/Amazon Linux)

rpm -i <link_to_rpm_you_need_from_releases>

Debian Based Distributions (Debian/Ubuntu)

wget <link_to_deb_you_need_from_releases>
sudo dpkg -i <the_deb_name>

Manual Install/Update

  • Install go
  • Configure your GOPATH and add $GOPATH/bin to your path
  • Run go install github.com/TylerBrock/saw@latest

Windows Specifics

  • Add %GOPATH%/bin to your path (optional)
  • Run from gopath/bin (If not in your path)
    cd %GOPATH%/bin
    saw ...
    

Alternatively you can hard code these in your shell's init scripts (bashrc, zshrc, etc...):

# Export profile and region that override the default
export AWS_PROFILE='work_profile'
export AWS_REGION='us-west-1'

Run Tests

From root of repository: go test -v ./...

TODO

  • Bash + ZSH completion of log groups + (streams?)
  • Create log streams and groups
  • Delete log streams and groups
  • Basic tests

saw's People

Contributors

andrewpage avatar brady1408 avatar coteh avatar cynipe avatar misli avatar perriea avatar shnhrrsn avatar timchurchard avatar tylerbrock avatar will-ockmore avatar

Stargazers

 avatar  avatar  avatar  avatar  avatar  avatar  avatar  avatar  avatar  avatar  avatar  avatar  avatar  avatar  avatar  avatar  avatar  avatar  avatar  avatar  avatar  avatar  avatar  avatar  avatar  avatar  avatar  avatar  avatar  avatar  avatar  avatar  avatar  avatar  avatar  avatar  avatar  avatar  avatar  avatar  avatar  avatar  avatar  avatar  avatar  avatar  avatar  avatar  avatar  avatar  avatar  avatar  avatar  avatar  avatar  avatar  avatar  avatar  avatar  avatar  avatar  avatar  avatar  avatar  avatar  avatar  avatar  avatar  avatar  avatar  avatar  avatar  avatar  avatar  avatar  avatar  avatar  avatar  avatar  avatar  avatar  avatar  avatar  avatar  avatar  avatar  avatar  avatar  avatar  avatar  avatar  avatar  avatar  avatar  avatar  avatar  avatar  avatar  avatar  avatar

Watchers

 avatar  avatar  avatar  avatar  avatar  avatar  avatar  avatar  avatar  avatar  avatar  avatar  avatar  avatar  avatar  avatar  avatar  avatar  avatar  avatar  avatar  avatar  avatar

saw's Issues

Docker

Is possible create a Dockerfile for this project?
like

docker run --rm tylerbrock/saw  --env-file ./aws_config  watch test

Thanks!

Prefix is getting ignored

Not sure, if this is a issue with saw or anything changed from aws perspective.
If I fire the below command it is ignoring the prefix.
saw watch production --prefix api

The result shown is equivalent to

saw watch production.

This used to work differently couple of weeks back.

Let me know what can be the issue.

Thank you.

THIS IS AWESOME!

The Cloudwatch interface is such a piece of shit. This returned my sanity.

Thank you.

--expand not working?

saw watch "/aws/lambda/FirstCallStack-firstCall43FFA0B4-jGoBbvJvD8XG" --raw --expand --filter INFO
2021-09-29T03:36:01.338Z 6c5ff95a-67bb-486b-b285-c18abab7b33b INFO {"SchemaVersion":"1.0","Sequence":1,"InvocationEventType":"NEW_INBOUND_CALL","CallDetails":{"TransactionId":"4dc03831-7631-4fc0-8665-98deba9b1f2f","AwsAccountId":"497939524935","AwsRegion":"us-west-2","SipRuleId":"b6a2740e-acfb-40c5-86fa-566d02451163","SipMediaApplicationId":"fce62cce-6151-4b43-a99f-c5077f37865e","Participants":[{"CallId":"690255bb-a256-4b40-9248-bac973164b8b","ParticipantTag":"LEG-A","To":"+12247040992","From":"+14153687546","Direction":"Inbound","StartTimeInMilliseconds":"1632886561176"}]}}

I expected the JSON to get split out onto a new line and then indented pretty, but that does not happen. Quite possible I am doing something wrong though.

Filter is not taking hyphens

I have some text that contains hyphen that I need to filter on. However if I use a hyphen I am unable to get the result. If use part of the same text without the hyphen I can see the result.

For example:
--filter 2ea3-44f5-8f61-81e3ec01910d
does not work, but
--filter 81e3ec01910d
works

I tried adding quotes and double quotes around the text with no avail.

Use -10m as the default start time.

I just spent a few minutes wondering why I wasn't seeing any log output. 😂

I was using saw get /aws/lambda/<group_name> but forgot to add --start -10m to the end of the command.

The default is time.Now() so I wasn't seeing any logs.

currentTime := time.Now()
absoluteStartTime := currentTime
if c.Start != "" {
st, err := getTime(c.Start, currentTime)
if err == nil {
absoluteStartTime = st
}
}
input.SetStartTime(aws.TimeUnixMilli(absoluteStartTime))

AWS SAM [1] and Serverless Framework [2] both use -10m as their default for log retrieval, whereas saw uses the current time.

Seems like a straightforward change to set the empty string "" to -10m to match.

saw/cmd/get.go

Lines 42 to 51 in 77bbab2

func init() {
getCommand.Flags().StringVar(&getConfig.Prefix, "prefix", "", "log group prefix filter")
getCommand.Flags().StringVar(
&getConfig.Start,
"start",
"",
`start getting the logs from this point
Takes an absolute timestamp in RFC3339 format, or a relative time (eg. -2h).
Valid time units are "ns", "us" (or "µs"), "ms", "s", "m", "h".`,
)

What do you think? I've applied it in my fork, and am using it. Happy to PR.

Does not preserve json property order

Json objects in logs have their properties reordered alphabetically instead of as logged.

Log

{ "b":1, "c":1, "a":1 }

Will print

{ "a":1, "b":1, "c":1 }

Bug: Exception raised when LogStream has no events.

When running saw with an empty LogStream I get the following exception:

panic: runtime error: invalid memory address or nil pointer dereference
[signal SIGSEGV: segmentation violation code=0x1 addr=0x0 pc=0x13d890d]

goroutine 1 [running]:
github.com/TylerBrock/saw/config.(*Configuration).TopStreamNames.func1(0x1, 0x0, 0x0)
	/Users/treacher/dev/personal/saw/config/configuration.go:116 +0x18d
sort.doPivot_func(0xc00051fb98, 0xc0004ae5e0, 0x0, 0x31, 0x18, 0xc0004ae5c0)
	/usr/local/Cellar/go/1.14/libexec/src/sort/zfuncversion.go:83 +0x48b
sort.quickSort_func(0xc00051fb98, 0xc0004ae5e0, 0x0, 0x31, 0xc)
	/usr/local/Cellar/go/1.14/libexec/src/sort/zfuncversion.go:143 +0x9a
sort.Slice(0x14a4d60, 0xc0004ae5c0, 0xc00051fb98)
	/usr/local/Cellar/go/1.14/libexec/src/sort/slice.go:17 +0xf1
github.com/TylerBrock/saw/config.(*Configuration).TopStreamNames(0x198dce0, 0xc000252830, 0xc00013d580, 0x100ac5c)
	/Users/treacher/dev/personal/saw/config/configuration.go:112 +0x8d
github.com/TylerBrock/saw/config.(*Configuration).FilterLogEventsInput(0x198dce0, 0xc00013d580)
	/Users/treacher/dev/personal/saw/config/configuration.go:82 +0x3da
github.com/TylerBrock/saw/blade.(*Blade).GetEvents(0xc000120d20)
	/Users/treacher/dev/personal/saw/blade/blade.go:95 +0x62
github.com/TylerBrock/saw/cmd.glob..func2(0x1987c00, 0xc00012e3c0, 0x1, 0x5)
	/Users/treacher/dev/personal/saw/cmd/get.go:38 +0xaa
github.com/spf13/cobra.(*Command).execute(0x1987c00, 0xc00012e370, 0x5, 0x5, 0x1987c00, 0xc00012e370)
	/Users/treacher/go/pkg/mod/github.com/spf13/[email protected]/command.go:766 +0x29d
github.com/spf13/cobra.(*Command).ExecuteC(0x19880c0, 0x0, 0x43000, 0xc000074058)
	/Users/treacher/go/pkg/mod/github.com/spf13/[email protected]/command.go:852 +0x2ea
github.com/spf13/cobra.(*Command).Execute(...)
	/Users/treacher/go/pkg/mod/github.com/spf13/[email protected]/command.go:800
main.main()
	/Users/treacher/dev/personal/saw/saw.go:10 +0x2d

I've pinpointed this error to be coming from this line on code: https://github.com/TylerBrock/saw/blob/master/config/configuration.go#L112

When the stream has no events it doesn't have a LastEventTimestamp field. See the below print out of the object comparison that causes the exception:

First: {
  Arn: "REDACTED",
  CreationTime: 1592286543348,
  LogStreamName: "REDACTED",
  StoredBytes: 0
}

Second: {
  Arn: "REDACTED",
  CreationTime: 1590782568670,
  FirstEventTimestamp: 1590782569669,
  LastEventTimestamp: 1590782570342,
  LastIngestionTime: 1590782573697,
  LogStreamName: "REDACTED",
  StoredBytes: 0,
  UploadSequenceToken: "REDACTED"
}

Code/project quality

Hi @TylerBrock

I went around the project and I realized that it was missing some stuff :

  • Commentaries in the code,
  • Fix Golint,
  • Fix Misspell,
  • Missing Makefile (GNUmakefile),

A personal opinion: I find dep very poor. Another thing the code dependencies is not versioned, which in case of deletion of a tag or a repo can break the project ...
As a replacement for dep, I will use glide while waiting vgo.

I'm waiting for your feedback and your opinion :)

View logs via EC2 IAM Policy instead of aws credentials

Is there a way to have saw work via IAM policy instead of local aws credentials?
The configuration I am testing works with 'awslogs' but when I saw saw I get the following:

[tsposato@PROD .aws]$ saw watch /fargate/Harbour/PROD/api-application
Error NoCredentialProviders: no valid providers in chain. Deprecated.
        For verbose messaging see aws.Config.CredentialsChainVerboseErrors

Add --tail option to watch

Docker logs has a --tail <lines> option that allows you to "look back" by n number of lines. I usually wish I could look back a bit from the time I started watching the logs. Is this something that you'd be interested in adding to saw and if so, is it possible? I haven't had a chance to look at the code yet to see if I could implement it but wanted to gauge your interest first.

watch multiple log groups at once

Debugging Lambda@Edge functions can be fun since the function logs are in the CloudWatch region or the edge location. Meaning... if you need to properly debug... you need to ensure you are see ALL the logs for all regions and not just the region you are in.

Tailing the cloud watch logs

Hi

I have started using the saw tool. It's really a great tool but I found that there is no flag available to tail the logs which is making it cumbersome and time consuming to load the logs.

Logs are out-of-order in larger timeframes

We noticed an issue when running saw over larger timeframes, e.g. saw get <my-group> --start -24h. The logs are not in chronological order, e.g. consecutive lines have the following timestamps:

2021-04-24T18:57:58.662Z	
2021-04-24T18:57:58.664Z	
2021-04-24T06:04:47.422Z	
2021-04-24T06:04:47.583Z	
2021-04-24T06:04:47.682Z	

Running saw on a smaller timeframe, e.g. saw get <my-group> --start '2021-04-24 05:00:00' --stop '2021-04-24 06:10:00' shows logs in the correct order.

Perform query or highlight particular issues

Is it possible to apply a filter on the tail, or how do people for example highlight 500 errors whilst tailing http logs? e.g. [..., request = *HTTP*, status_code = 5**, bytes, referrer, agent]

How does prefix and filter work exactly?

Prefix what exactly? Filter what?

From the docs I don't understand what they do. They don't seem to do anything for me (always empty set) or return a similarly arbitrary list of messages. I am pretty sure this is due to me using it wrongly, but I struggle to understand how it's meant to be used.

What is the prefix applied to? The name of any stream in the log group?

What is the filter exactly applied to? Full text search over the stream's content?

Does not work with aws-okta or aws-vault

These two tools allow you to save your credentials in the keychain instead of the plain text file in .aws/credentials, and they work just fine with other apps that use the aws go sdk.

But whenever I try to use saw with them I get:

➜ aws-okta exec myprofile -- saw groups
panic: SharedConfigAssumeRoleError: failed to load assume role for arn:aws:iam::REDACTED:role/secondary-role, source profile has no shared credentials

goroutine 1 [running]:
github.com/TylerBrock/saw/vendor/github.com/aws/aws-sdk-go/aws/session.Must(0x0, 0x156ea60, 0xc4200693b0, 0x0)
	/Users/tbrock/Code/Go/src/github.com/TylerBrock/saw/vendor/github.com/aws/aws-sdk-go/aws/session/session.go:274 +0x54
github.com/TylerBrock/saw/blade.NewBlade(0x17a8fc0, 0x17a8840, 0x0, 0x4)
	/Users/tbrock/Code/Go/src/github.com/TylerBrock/saw/blade/blade.go:49 +0x16a
github.com/TylerBrock/saw/cmd.glob..func3(0x17a3620, 0x17c6788, 0x0, 0x0)
	/Users/tbrock/Code/Go/src/github.com/TylerBrock/saw/cmd/groups.go:19 +0x46
github.com/TylerBrock/saw/vendor/github.com/spf13/cobra.(*Command).execute(0x17a3620, 0x17c6788, 0x0, 0x0, 0x17a3620, 0x17c6788)
	/Users/tbrock/Code/Go/src/github.com/TylerBrock/saw/vendor/github.com/spf13/cobra/command.go:766 +0x2c1
github.com/TylerBrock/saw/vendor/github.com/spf13/cobra.(*Command).ExecuteC(0x17a3880, 0x0, 0x14edded, 0x23)
	/Users/tbrock/Code/Go/src/github.com/TylerBrock/saw/vendor/github.com/spf13/cobra/command.go:852 +0x30a
github.com/TylerBrock/saw/vendor/github.com/spf13/cobra.(*Command).Execute(0x17a3880, 0xc420147f78, 0xc42009c058)
	/Users/tbrock/Code/Go/src/github.com/TylerBrock/saw/vendor/github.com/spf13/cobra/command.go:800 +0x2b
main.main()
	/Users/tbrock/Code/Go/src/github.com/TylerBrock/saw/saw.go:10 +0x2d
exit status 2

Lemme know if I can provide any other info.

Absolute time parsing does not work

I noticed this issue when the following command wasn't returning any log events locally:

$ saw get /Production/Gateway/Rails --start "2018-12-10"                                                                               130 ↵

I dug into the config/configuration.go getTime() func, which looks like its using time.Parse with the time.RFC3339 format for absolute time values for both start and end timestamps. I plugged similar code into the Go playground, and it looks like this parse format does not support shorthand dates, like were shown in the README example, such as "2018-06-26".

package main

import (
	"fmt"
	"time"
)

func main() {
	timeStr := "2018-06-26"
	time, err := time.Parse(time.RFC3339, timeStr)
	
	if(err == nil) {
		fmt.Printf("We have the time %s", time.Local())
	} else {
		fmt.Printf("Error: %s", err);
	}
}
Error: parsing time "2018-06-26" as "2006-01-02T15:04:05Z07:00": cannot parse "" as "T"

Rate Limiting

It would be really nice if rate limiting was implemented to back off if you use the tool to watch multiple log groups at once. AWS suggests exponential backup.

This will become very important if #9 starts to be worked on.

Add support for awscli v2 sso ~/.aws/config

Hi Tyler - thanks for Saw, super awesome to give us tail like functionality for cloudwatch.

I've got the docker-based install working with ~/.aws/credentials, however my org uses AWS SSO so I'm trying to get it to work with the new aws cli v2 sso login. This uses ~/.aws/config.

When I try to use a profile I've logged in named "prod", I get this:

~ $ saw watch /ecs/ColdFusionApp --profile prod --region us-east-1
Error NoCredentialProviders: no valid providers in chain. Deprecated.
	For verbose messaging see aws.Config.CredentialsChainVerboseErrors

Where saw is an alias: alias saw='docker run --rm -it -v ~/.aws:/home/.aws tbrock/saw:v0.2.2'

I tried the fix you suggested in another reported issue about changing the mapping of the credentials file, but that doesn't solve my problem as I'm not depending on that file here.

The current credentials file approach works, but I have to login repeatedly and update my credentials file with the latest values which is a pain.

Docker setup not recognising profile

Hi,

Love your tool - i tried it via docker and could not get it to work, so figured i'll create an issue. I tried the install version and it does exactly what i would want it to do!

Via docker however:

artur@pandaadb ~/dev/ $ docker run --rm -it -v ~/.aws:/home/.aws tbrock/saw --profile MY_PROFILE --region MY_REGION watch MY_LOG_GROUP 
Error NoCredentialProviders: no valid providers in chain. Deprecated.
	For verbose messaging see aws.Config.CredentialsChainVerboseErrors

I had a feeling this might have something to do with the mapping location in home/.aws for the credentials. My ~/.aws is definitely setup right (as it works fine with the installed version and aws cli).

Setting the AWS_CONFIG_FILE and the AWS_CREDENTIALS_PROFILES_FILE yields a different error:

panic: SharedConfigAssumeRoleError: failed to load assume role for <MYROLE> source profile has no shared credentials

Thanks and please let me know if I am missing any info on this.

Artur

Starting a Subsequent Stream Hangs "$ saw watch [log_group]"

I have 2 CloudWatch groups I frequently tail.

Screen Shot 2020-03-11 at 9 04 01 AM

When I watch my first log group it loads up fairly quickly and starts tailing.

If I open a new terminal tab and start the same command on another log group, it hangs sometimes indefinitely, other times it takes about 10 minutes to start streaming.

Not sure if this is an issue with "saw" specifically or something to do with aws and cloudwatch...

Anyone else experience this?

"Get" sample in readme is incomplete

I'm not sure if this issue is specific to my environment but
saw get production --prefix api --start 2018-06-26 --stop 2018-06-28
doesn't work for me. I have to specify the datetime as per RFC 3339.

This is working
saw get production --prefix api --start 2018-06-26T00:00:00Z --stop 2018-06-28T00:00:00Z

You may want to revise that portion of the document. The rest is working for me.

Environment

  • Ubuntu 12.04 (yeah, I know)
  • go version go1
  • saw v0.1.8

Anyway great tool. Saves me headache trying to figure out CloudWatch API/SDK.
Thanks.

Region support

Awesome tool! It looks like there's no region support, is that correct?

Question - Notification when certain filter is found

Is there a way to send an email notification when a certain filter is found in the logs tail?

My use case is that I want to run saw on a machine and listen for error/exceptions. Once an exception occurs I want to send an email. Is this currently possible with this?

Very slow when group has lots of streams

➜ saw streams /ecs/drone | wc -l
     985

When I try to run saw watch /ecs/drone nothing appears to happen (I haven't let it run for more than a couple minutes though).

Could there be a --verbose option to give some hints as to what saw is doing while it appears to be sitting there?

Cost regarding AWS CloudWatch API calls

Hello, thank you for this amazing project.

I have some questions regarding the cost of watching/filtering log streams, how many API calls the tool will do to filter one stream? And if I want to tail/watch the log stream forever, the tool does one API call to start it, or has some kind of pooling/event to update/check if new data is available?

latest tag on dockerhub is not the latest version

I ran into the error Error NoCredentialProviders: no valid providers in chain. Deprecated. when running from docker. This is because the latest tag on dockerhub points to version v0.2.0. Using v0.2.2 explicitly works correctly.

docker run --rm -it -v ~/.aws:/home/.aws tbrock/saw:v0.2.2

Can the latest tag be updated to point to the latest version so that the example from the Readme works as expected?

JSON not formatted and colors not displayed

Hello,

I am trying to do a console.log of

{
  "str": "foo",
  "num": 100,
  "bool": false,
  "null": null,
  "array": ["foo", "bar", "baz"],
  "obj": { "a": 1, "b": 2 }
}

to have the colorized and indented output as seen on https://github.com/TylerBrock/colorjson but it's not working.

This is my output

Screen Shot 2019-11-26 at 5 44 09 PM

I am using iTerm and oh-my-zsh.

Is there anything I should to to have the output logs colorized and indented properly ?

"watch" did not return data for some log streams in a group

Hi,

This is a really cool tool — thanks.

This may be a question on usage, or it may be an AWS API limitation or a bug in saw, I'm not sure. I hope you can give me some guidance.

Use-case

I'm running a serverless.com project, and I run saw against a log group set up against a lambda function like this:

saw watch /aws/lambda/my-function-name

Expected

When I invoke my lambda function, I expect to see the log output appear in saw for all invocations.

Actual

saw works beautifully when I invoke my lambda function so it only runs once at a time.

But when I invoke the same function multiple times in parallel (my test was to invoke the function 12 times), saw doesn't seem to detect all the log streams created in the log groups and it only returns the contents of one of the streams — the last one.

If I immediately run saw get /aws/lambda/my-function-name --start -5m then I can see all the logs mixed together as I'd expected to see in watch mode.

Extra info

Lambda creates one stream per invocation. I can invoke my lambda function using InvocationType: Event which runs each invocation asynchronously in parallel. My test runs 12 in parallel.

When I do this, I see all the 12 invocation logs in AWS Console, but saw only returns the contents for 1 of the invocations. It appears to be the last one I invoked.

"Error ThrottlingException: Rate exceeded"

Getting "Error ThrottlingException: Rate exceeded status code: 400, request id: a7d9be90-627d-11e9-9a51-578e1f84b418" from saw.
Maybe, can add some refresh interval for parameter?

Have old releases been removed?

I feel like I'm missing something really obvious here but didn't there used to be releases for a 1.2.1 version available from GitHub? I add this to a Dockerfile on the 6 Dec 2018:

# install saw
RUN wget https://github.com/TylerBrock/saw/releases/download/v1.2.1/saw_1.2.1_linux_amd64.tar.gz \
    && tar -xzvf saw_1.2.1_linux_amd64.tar.gz saw \
    && mv saw /usr/local/bin \
    && rm saw_1.2.1_linux_amd64.tar.gz

This is failing now and when I look at the releases page, I only see a 0.2.2 version. I did try and look through past issues and pull requests but nothing stands out.

Logs stop working

Hello,

I have been using saw to view my AWS logs, but occasionally the AWS logs stop coming in.

Is this a bug or some configuration issue.

I simply issue the saw command in Mac Terminal and I can see the logs, but after awhile they just stop.

Any help is appreciated!

Grepping to select a log group

Hi, first of all - awesome tool!

At my company, we sometimes have a lot of log groups, and long names for groups. This leads to a lot of copy paste when starting to watch or read a log. It would be awesome if you could write a part of a groups name to automatically select that group.

If you have /aws/lambda/company-project-backend-getSomething, searching getSomething would pick this group, provided it's the only match. If there are multiple matches then it could let you pick from a list of matching logs.

Alternatively a --grep flag/argument or similar could be used with the command to let you enable this functionality.

Panic when using prefix

Love the tool. I keep running into this error. The prefix definitely exists.

-› saw get tag --prefix production
panic: runtime error: invalid memory address or nil pointer dereference
[signal SIGSEGV: segmentation violation code=0x1 addr=0x0 pc=0x1390c4c]

goroutine 1 [running]:
github.com/TylerBrock/saw/config.(*Configuration).TopStreamNames.func1(0x1, 0x0, 0x0)
	/home/tbrock/Code/Go/src/github.com/TylerBrock/saw/config/configuration.go:97 +0x2c
sort.doPivot_func(0xc000217b60, 0xc0002651e0, 0x0, 0x1a54, 0x0, 0x8)
	/usr/lib/go/src/sort/zfuncversion.go:83 +0xde
sort.quickSort_func(0xc000217b60, 0xc0002651e0, 0x0, 0x1a54, 0x1a)
	/usr/lib/go/src/sort/zfuncversion.go:143 +0x9a
sort.Slice(0x1460b20, 0xc0002651c0, 0xc000217b60)
	/usr/lib/go/src/sort/slice.go:21 +0x12f
github.com/TylerBrock/saw/config.(*Configuration).TopStreamNames(0x19063e0, 0xc000a45930, 0x136d160, 0xc00000c0f0)
	/home/tbrock/Code/Go/src/github.com/TylerBrock/saw/config/configuration.go:96 +0x82
github.com/TylerBrock/saw/config.(*Configuration).FilterLogEventsInput(0x19063e0, 0xc000860700)
	/home/tbrock/Code/Go/src/github.com/TylerBrock/saw/config/configuration.go:67 +0x35e
github.com/TylerBrock/saw/blade.(*Blade).GetEvents(0xc00000ae80)
	/home/tbrock/Code/Go/src/github.com/TylerBrock/saw/blade/blade.go:95 +0x54
github.com/TylerBrock/saw/cmd.glob..func2(0x19004e0, 0xc0000fc180, 0x1, 0x8)
	/home/tbrock/Code/Go/src/github.com/TylerBrock/saw/cmd/get.go:38 +0xaa
github.com/TylerBrock/saw/vendor/github.com/spf13/cobra.(*Command).execute(0x19004e0, 0xc0000fc080, 0x8, 0x8, 0x19004e0, 0xc0000fc080)
	/home/tbrock/Code/Go/src/github.com/TylerBrock/saw/vendor/github.com/spf13/cobra/command.go:766 +0x2cc
github.com/TylerBrock/saw/vendor/github.com/spf13/cobra.(*Command).ExecuteC(0x19009a0, 0xc000080058, 0x0, 0x23)
	/home/tbrock/Code/Go/src/github.com/TylerBrock/saw/vendor/github.com/spf13/cobra/command.go:852 +0x2fd
github.com/TylerBrock/saw/vendor/github.com/spf13/cobra.(*Command).Execute(0x19009a0, 0xc000113f88, 0xc000080058)
	/home/tbrock/Code/Go/src/github.com/TylerBrock/saw/vendor/github.com/spf13/cobra/command.go:800 +0x2b
main.main()
	/home/tbrock/Code/Go/src/github.com/TylerBrock/saw/saw.go:10 +0x2d

How to get a specific stream?

Great tool. I'm trying it out to make it faster to read a specific stream, compared with the slow CloudWatch UX in AWS Console, and having to keep clicking the "Load more" link to see the whole stream.

I can do saw groups and saw streams <group name> to find my stream.

But how do I get a specific stream, once I have the stream name?

I tried various permutations of saw get, e.g. saw get <group>/<stream> but couldn't find an approach that worked.

saw get <group> --start -4h works, but it means multiple streams are mixed together. I want to only see a specific stream at a time.

How can I watch multiple log groups at once?

I have these log groups:

/aws/lambda/ether-dev-createAuthChallenge
/aws/lambda/ether-dev-defineAuthChallenge
/aws/lambda/ether-dev-preSignUp
/aws/lambda/ether-dev-verifyAuthChallengeResponse

How can I watch them all?

I have tried: saw watch [a-z0-9A-Z\/]*dev*

But throws error: 'logGroupName' failed to satisfy constraint: Member must satisfy regular expression pattern: [.-_/#A-Za-z0-9]+

MFA Token Cache

Running any saw command with a profile that assumes a role results in an MFA prompt every single time. It would be nice if saw cached the credential.

Recommend Projects

  • React photo React

    A declarative, efficient, and flexible JavaScript library for building user interfaces.

  • Vue.js photo Vue.js

    🖖 Vue.js is a progressive, incrementally-adoptable JavaScript framework for building UI on the web.

  • Typescript photo Typescript

    TypeScript is a superset of JavaScript that compiles to clean JavaScript output.

  • TensorFlow photo TensorFlow

    An Open Source Machine Learning Framework for Everyone

  • Django photo Django

    The Web framework for perfectionists with deadlines.

  • D3 photo D3

    Bring data to life with SVG, Canvas and HTML. 📊📈🎉

Recommend Topics

  • javascript

    JavaScript (JS) is a lightweight interpreted programming language with first-class functions.

  • web

    Some thing interesting about web. New door for the world.

  • server

    A server is a program made to process requests and deliver data to clients.

  • Machine learning

    Machine learning is a way of modeling and interpreting data that allows a piece of software to respond intelligently.

  • Game

    Some thing interesting about game, make everyone happy.

Recommend Org

  • Facebook photo Facebook

    We are working to build community through open source technology. NB: members must have two-factor auth.

  • Microsoft photo Microsoft

    Open source projects and samples from Microsoft.

  • Google photo Google

    Google ❤️ Open Source for everyone.

  • D3 photo D3

    Data-Driven Documents codes.