ukncsc / lme Goto Github PK
View Code? Open in Web Editor NEWLogging Made Easy
License: Apache License 2.0
Logging Made Easy
License: Apache License 2.0


When the Dashboard 0.1.2 was exported did you forget to include the visualisations by any chance as it is missing them (it only contains 18 objects whereas 0.1.1b contained 47).
Also when I click on the Discover tab I get an error. This appears to be caused by two new Scripted fields in the Winlogbeat index. Both of these refer to separate fields that do not exist; event_data.FileVersion.keyword and event_id. Full error message example is below.
If I delete both of these scripted fields from the Index then I can see the log data in the Discover tab, but the dashboard refers to visualisations that do not exist:-)
########
Error with Painless scripted field 'if (doc['event_data.FileVersion.keyword'].value == "10.0.17134.466 (WinBuild.160101.0800)") {return "Win10 V1803"} else if (doc['event_data.FileVersion.keyword'].value == "10.0.16299.15 (WinBuild.160101.0800)") {return "Win10 V1709"} else if (doc['event_data.FileVersion.keyword'].value == "10.0.15063.0 (WinBuild.160101.0800)") {return "Win10 V1703"} else {return "Unknown"} '
You can address this error by editing the ‘if (doc['event_data.FileVersion.keyword'].value == "10.0.17134.466 (WinBuild.160101.0800)") {return "Win10 V1803"} else if (doc['event_data.FileVersion.keyword'].value == "10.0.16299.15 (WinBuild.160101.0800)") {return "Win10 V1709"} else if (doc['event_data.FileVersion.keyword'].value == "10.0.15063.0 (WinBuild.160101.0800)") {return "Win10 V1703"} else {return "Unknown"} ’ field in Management > Index Patterns, under the “Scripted fields” tab.
Request to Elasticsearch failed: {"error":{"root_cause":[{"type":"script_exception","reason":"runtime error","script_stack":["org.elasticsearch.search.lookup.LeafDocLookup.get(LeafDocLookup.java:81)","org.elasticsearch.search.lookup.LeafDocLookup.get(LeafDocLookup.java:39)","if (doc['event_data.FileVersion.keyword'].value == "10.0.17134.466 (WinBuild.160101.0800)") {"," ^---- HERE"],"script":"if (doc['event_data.FileVersion.keyword'].value == "10.0.17134.466 (WinBuild.160101.0800)") {return "Win10 V1803"} \nelse if (doc['event_data.FileVersion.keyword'].value == "10.0.16299.15 (WinBuild.160101.0800)") {return "Win10 V1709"} \nelse if (doc['event_data.FileVersion.keyword'].value == "10.0.15063.0 (WinBuild.160101.0800)") {return "Win10 V1703"} \nelse {return "Unknown"}\n\n\n","lang":"painless"}],"type":"search_phase_execution_exception","reason":"all shards failed","phase":"fetch","grouped":true,"failed_shards":[{"shard":0,"index":"winlogbeat-02.05.2019","node":"Tj4-1V8oQlaVg5S8sBFN-g","reason":{"type":"script_exception","reason":"runtime error","script_stack":["org.elasticsearch.search.lookup.LeafDocLookup.get(LeafDocLookup.java:81)","org.elasticsearch.search.lookup.LeafDocLookup.get(LeafDocLookup.java:39)","if (doc['event_data.FileVersion.keyword'].value == "10.0.17134.466 (WinBuild.160101.0800)") {"," ^---- HERE"],"script":"if (doc['event_data.FileVersion.keyword'].value == "10.0.17134.466 (WinBuild.160101.0800)") {return "Win10 V1803"} \nelse if (doc['event_data.FileVersion.keyword'].value == "10.0.16299.15 (WinBuild.160101.0800)") {return "Win10 V1709"} \nelse if (doc['event_data.FileVersion.keyword'].value == "10.0.15063.0 (WinBuild.160101.0800)") {return "Win10 V1703"} \nelse {return "Unknown"}\n\n\n","lang":"painless","caused_by":{"type":"illegal_argument_exception","reason":"No field found for [event_data.FileVersion.keyword] in mapping with types []"}}}]},"status":500}
I first noticed that despite Sysmon running and generating plenty of events in Microsoft->Windows->Sysmon/Operational log, none were showing up in Kibana. In fact, hardly any logs were showing up at all.
Digging further, I found a Warning in Eventlog-ForwardingPlugin: The subscription lme is created, but one or more channels in the query could not be read at this time.
Details:
<t:QueryStatus xmlns:t="http://schemas.microsoft.com/wbem/wsman/1/windows/EventLog"><t:Channel Name="Application" ErrorCode="0"/><t:Channel Name="Microsoft-Windows-AppLocker/EXE and DLL" ErrorCode="0"/><t:Channel Name="Microsoft-Windows-AppLocker/MSI and Script" ErrorCode="0"/><t:Channel Name="Microsoft-Windows-AppLocker/Packaged app-Deployment" ErrorCode="0"/><t:Channel Name="Microsoft-Windows-AppLocker/Packaged app-Execution" ErrorCode="0"/><t:Channel Name="Microsoft-Windows-SmartCard-Audit/Authentication" ErrorCode="0"/><t:Channel Name="Microsoft-Windows-SMBClient/Operational" ErrorCode="5"/><t:Channel Name="Microsoft-Windows-Sysmon/Operational" ErrorCode="5"/><t:Channel Name="Microsoft-Windows-TaskScheduler/Operational" ErrorCode="0"/><t:Channel Name="Microsoft-Windows-TerminalServices-RDPClient/Operational" ErrorCode="0"/><t:Channel Name="Microsoft-Windows-Windows Defender/Operational" ErrorCode="15007"/><t:Channel Name="Security" ErrorCode="5"/><t:Channel Name="System" ErrorCode="0"/></t:QueryStatus>
Followed by another Event in Eventlog-ForwardingPlugin Information: The subscription lme is unsubscribed.
I am no expert on Windows access permissions and rights, but here are some of the rights for two of the channels which return different error codes:
c:\Windows\sysmon>wevtutil gl "Microsoft-Windows-Sysmon/Operational"
name: Microsoft-Windows-Sysmon/Operational
enabled: true
type: Operational
owningPublisher: Microsoft-Windows-Sysmon
isolation: Custom
channelAccess: O:BAG:SYD:(A;;0xf0007;;;SY)(A;;0x7;;;BA)(A;;0x1;;;BO)(A;;0x1;;;SO
)(A;;0x1;;;S-1-5-32-573)
logging:
logFileName: %SystemRoot%\System32\Winevt\Logs\Microsoft-Windows-Sysmon%4Opera
tional.evtx
retention: false
autoBackup: false
maxSize: 67108864
publishing:
fileMax: 1
c:\Windows\sysmon>wevtutil gl "System"
name: System
enabled: true
type: Admin
owningPublisher:
isolation: System
channelAccess: O:BAG:SYD:(A;;0xf0007;;;SY)(A;;0x7;;;BA)(A;;0x3;;;BO)(A;;0x5;;;SO
)(A;;0x1;;;IU)(A;;0x3;;;SU)(A;;0x1;;;S-1-5-3)(A;;0x2;;;S-1-5-33)(A;;0x1;;;S-1-5-
32-573)
logging:
logFileName: %SystemRoot%\System32\Winevt\Logs\System.evtx
retention: false
autoBackup: false
maxSize: 20971520
publishing:
fileMax: 1
S-1-5-32-573 is the Event Log Readers group, which contains one member, NT AUTHORITY\NETWORK SERVICE
Hi,
I was wondering if you could help me out with installing Sysmon on win10 machine using Scheduled Tasks GPOs.
I am currently testing this with my testing environment which consists of WinServer2012 (DC); win10; win8.1 and win7 workstations.
I followed your guide by creating a GPO for scheduled Task where NT AUTHORITY\System will execute a sysmon install script (update.bat) on a share. This batch file is located in the sysvol as suggested in the guide. The full path is: \\FDQN\sysvol\FDQN\scripts\Sysmon\update.bat
The issue I am having is that sysmon is installed on all the machines except win10.
To test this, I downloaded Sysinternals suite and opened a command prompt as local system (NT AUTHORITY\System) using PSExec. I tried to manually trigger the Scheduled Task as a local system user using the following command: schtasks.exe /RUN /TN "Install Sysmon" (where "Install Sysmon" is the task name). Manually triggering the scheduled task successfully executes the update.bat file and sysmon is installed.
I cannot understand what the issue is and why the update.bat file won't execute automatically through scheduled task. If you have any knowledge on how to fix this then please let me know!
This is the current setting of my scheduled task:

Line 275 of deploy.sh says:
sed -i 's#//Unattended-Upgrade::Automatic-Reboot-Time "02:00";Unattended-Upgrade::Automatic-Reboot-Time "02:00";#g' /etc/apt/apt.conf.d/50unattended-upgrades
I think this should be:
sed -i 's#//Unattended-Upgrade::Automatic-Reboot-Time "02:00";#Unattended-Upgrade::Automatic-Reboot-Time "02:00";#g' /etc/apt/apt.conf.d/50unattended-upgrades
Hey Guys, would be worthwhile looking at Olaf Hartongs sysmon configs (if you weren't already aware)
https://github.com/olafhartong/sysmon-modular/blob/master/README.md
Is your feature request related to a problem? Please describe.
Not related to a problem
Describe the solution you'd like
Would like to see integration for mobile devices (tabets and smartphones) running Android or iOS.
Describe alternatives you've considered
No other alternatives tried
Additional context
With BYOD policies and guest / internal Wifi, more people are using smartphones and tablets on office networks. Therefore adding support for Android and iOS integration could be useful.
What are your experiences with disk space requirements with LME?
You are not mentioning disk space in the requirements section.
I set up a test environment (1TB HDD for the Linux server) and enrolled one single Windows 10 workstation to the LME system.
Within 5 hours of logging the size of the Forwarded events log on the Windows event collector grew to 20MB.
We have around 200 Windows workstations and servers I would like to enroll at some point.
Also Cyber Essentials requires a log retention of at least 3 months.
I understand that all environments and systems are different and it is hard to give exact number. Nevertheless, a sizing guide with some rough estimations would be useful.
Describe the issue
Deploy.sh is not removing all of the artifacts from the install. Specifically, the elasticsearch password is being retained.
To Reproduce
Expected behavior
I can re-install LME. Instead, the script hangs at "[x] Waiting for elasticsearch to be ready".
If I run the test command from the deploy.sh script:
curl --cacert certs/root-ca.crt --user elastic:temp -s -o /dev/null -w ''%{http_code}'' https://127.0.0.1:9200
It returns 401, (unauthorized). If I change the password from 'temp' to the password that was generated from my previous install, the test succeeds with code 200.
Using a fresh install of Ubuntu server 18.03.04 LTS, and the latest code from git. The first LME install partly failed due to storage issues with deploying the docker images and didn't generate the files_for_windows.zip file, which is why I am trying to reinstall.
Hi there,
I'm running the deploy.sh update and it gets to these commands:
docker cp elastic_settings.sh $(docker ps -q --filter="NAME=lme_elasticsearch"):/elastic_settings.sh
docker exec -it $(docker ps -q --filter="NAME=lme_elasticsearch") bash -c "chmod +x /elastic_settings.sh"
docker exec -it $(docker ps -q --filter="NAME=lme_elasticsearch") bash -c /elastic_settings.sh
When the script hits the third command, I get this for an error:
{"acknowledged":true}/elastic_settings.sh: line 3: $'\r': command not found
I opened the one on my local machine and deleted the spaces between lines 2 and 3, then re-ran the commands to copy the file over and run it, and everything looks good!
I re-ran deploy.sh update and this time everything completed fine! But...my files_for_windows.zip was not created. I'm gonna revert the VM and try again, but not sure what the right course of action should be for a half-installed setup. Should I have run deploy script with install again?
Let me know what you think!
Thanks,
Brian
Hi i have tried to update our version of LME to v0.2 i have run the sudo ./deploy.sh uninstall command as mentioned in upgrading.md and them attempted to run the install script from the new location. everything seemd to be running ok until it gets to
'Waiting for elasticsearch to be ready'
and it just sits there forever or at least 24 hours in my case, is there a way i can see if elasticsearch is started?
many thanks
I am having issues getting this to import. I have used the convenience scripts to install LME. (Latest release as of 11/08/20)
Apart from replacing 'ChangeThisDomain' with my DNS information 'https://MyServer.Domain' (As instructed), I then import it and after a long time of hanging it eventually displays error stating this 'file can not be processed'. I have cloned from Git a number of times thinking potentially the file had corrupt in someway? Maybe a syntax error in the code? Not sure if anyone else has had this issue?
Screenshot of error: https://imgur.com/a/FRCY1Kf
Environment information:
Ubuntu 18.04.4 LTS
2vCPU
12GB RAM
50GB HDD
Proxy in environment = No
Kibana 7.8.0
Elasticsearch 7.8.0
Logstash 7.8.0
Thanks
A minor issue, but step 3.3.8 "Build curator" of the manual install neglects to mention that the curator files need to be copied from the git repo before the docker command is run.
Hi;
First off, thanks for a great project. Directions were easy to follow. One type-o I did note, in chapter one it says to use use TCP port 5986 on the diagram of how the client talks to the server, and the rest of the document it says to allow 5985.
On to the question/issue. I can not get the client to send data. The SysMon64 services is running. (tried re-starting with no change) I modified the client GPO to point to my server. Had the FQDN in there, and also tried the IP address.
On my client, I see events populating in eventviewer/Applications and Services Log/Microsoft/Windows/Sysmon/Operational .
On the server the LME subscription shows as active with 0 clients connected.
I ran wireshark on my PC and do not see it even trying to send anything to the server, so I am guessing the issue is on the client side. In Chapter 1 where it mentions IP filtering, I had that set, but removed it for testing. No change. Also added firewall ports to be allowed, and then turned off firewall for testing. Still no change. I have done a gpupdate /force when I made a change to the GPO.
Thanks
Dave
Hi this question follows on from #45 i am having issues importing the new v0.2.0 dashboard into kibana i am getting the error message 'Sorry, there was an error Saved objects file format is invalid and cannot be imported.'

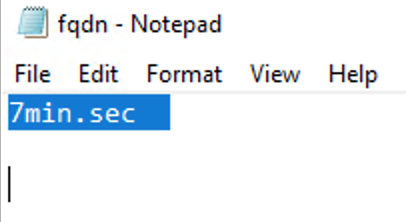
Describe the issue
In the update.bat file there's a wmic statement to query the domain's FQDN, and it doesn't seem to parse properly, and therefore is saved as a variable that breaks when used later in the script.
To Reproduce
Steps to reproduce the behavior:
(wmic computersystem get domain | findstr /v Domain | findstr /r /v "^$") > fqdn.txt
7min.sec
(There are extra spaces after "7min.sec" and several carriage returns in the fqdn.txt)
Expected behavior
A clean 7min.sec saved in the fqdn.txt
Screenshots
See the fqdn.txt, which has extra spaces:
Hi again
I have an issue where i can see any new logs appearing in Kibana since the 24/03/2020
although when i look at the LME Collector it is still successfully publishing logs
any help is appreciated.
Mark
Something you might want to add or note about enabling "Advanced Audit Configuration" via gpo and what events at a min you should turn on. Or don't need based on what sysmon pulls.
The only thing I worry about is if you had an issue with sysmon and you had no "Advanced Audit Configuration" might be hard to find issues.
Noticed this in my testing since I did not apply my normal gpo for configuring event logging. (Did want to add anything that would conflict with LME) Was looking for normal user login events, and they were missing.
With current defaults, winlogbeat logs a great deal of superfluous information, such as the PID and TID of the winlogbeat process.
This creates log entries that are full of useless information, which consumes storage space, slows down searching/indexing, and generally makes analyzing the data less pleasant.
Recommend using winlogbeat processors to cut down on some unnecessary fields. I've added the following data to the top of my winlogbeat.yml with good results:
processors:
  - drop_fields:
      fields: ["agent.ephemeral_id","agent.id","agent.type","agent.version","ecs.version","event.kind","winlog.api","winlog.opcode","winlog.process.pid","winlog.process.thread.id","winlog.provider_guid","winlog.record_id","winlog.user.domain","winlog.user.identifier","winlog.user.name","winlog.user.type","winlog.version"]
      ignore_missing: true
Granted, my approach is a little ham-fisted, and some of the data I've excluded others might want to include. NB that winlog.user.name, etc refers to the user the winlogbeat process is running as, NOT to the user that generated the event, and so is always NT AUTHORITY/SYSTEM.
Since the OpenDistro for Elasticsearch fork comes with some much needed security plug-ins and the changes are minimal to the Kibana dashboards, would you consider using it instead of the original elasticsearch release ?
The "essential" plugins being Alerting and of course out of the box security via Authentication, RBAC and encryption at rest and on the fly.
There is also the SQL plugin which allows users not familiar with the elastic ecosystem to manipulate their stored data without a steep learning curve encouraging perhaps a better adoption.
https://opendistro.github.io/for-elasticsearch/features/security.html
Diagram in Chapter 1 shows TCP port 5986, should show port 5985 to be consistent with the rest of the documentation and the system behaviour.
https://github.com/ukncsc/lme/blob/master/docs/eventforwarding_overview.jpg
This one is a bit tricky to describe, so please bear with me, and may be a bug with Sysmon rather than LME.
To Reproduce
Steps to reproduce the behavior:
\\<domain>\sysvol\<domain>\Sysmon\sysmon.xml (or similar). In my case, I added a new entry to exclude some DNS names from eventid 22 to reduce some of the noise being generated. Specifically "end with" my domain root and "begin with" 'exch1', to omit my exchange cluster.Expected behavior
After the update.bat script runs, I would expect that Sysmon's behaviour change to reflect the new configuration.
It does not. Sysmon continues to log and forward eventids 22 where the QueryName includes my domain root and various 'exch1' DNS names.
If I run Sysmon64.exe -c , I can see the new configuration reflected in the output, but the old behaviour persists. If I force an uninstall and reinstall of Sysmon, the behvaiour is updated and correct.
All boxes I've tested on so far are Windows Server 2012 R2.
I've run into this issue on a couple of my hosts. For reasons that remain unclear, they are running sysmon's update.bat from a drive other C:, like H: or K:. (Though this is unusual, I am surely not the only person who will have this issue). The problem is that when update.bat runs "chdir %SYSMONDIR%", it assumes that we're already on the C: drive, and proceeds to execute commands as though they were local. But because we're still on H: or whatever, the current directory is not actually changed.
I see three ways of fixing this:
1 seems a little hacky, but is simple and it works. 2 would be an easy fix, but something about it does not fill me with confidence. 3 seems like the most robust fix, but could introduce other bugs without testing the script.
I ran into this issue when configuring a Server 2019 as the collector:
I had to run the commands contained therein, and then restart the winrm and event collecting services. Sounds like default Server 2019 install will have this problem.
Probably want to add this to the guide, or similar.
Hi,
Firstly, thank you for compiling all of these resources to create LME.
I've followed all of the steps (I think correctly). I'm currently stuck around Step 3 (Easy).
Unfortunately, winlogbeat cannot sent logs to the ELK ubuntu server. I keep getting the following errors:
[2019-05-14T12:59:33.771+0100	INFO	pipeline/output.go:95	Connecting to backoff(async(tcp://elk:5044))
2019-05-14T12:59:36.947+0100	ERROR	pipeline/output.go:100	Failed to connect to backoff(async(tcp://elk:5044)): read tcp 10.0.210.85:51912->10.0.210.100:5044: wsarecv: An existing connection was forcibly closed by the remote host.]
I've binned the ubuntu server a few times and started again, to no avail.. I can, however, access Kibana fine.
One thing I did notice in running the "deploy.sh" script is that it asks the following:
Enter the IP that winlogbeat will use to communicate with this box:
Enter the DNS name that winlogbeat uses to communicate with this box:
For the above, do I insert the IP and DNS of the Windows Event Collector VM, or the details of the ELK server? Apologies if this is blatantly obvious.
To troubleshoot, I've turned off the firewall on both the Ubuntu server and the Windows Log Collector VM, to no avail.
Contents of the winlogbeat.yml, FYI:
winlogbeat.event_logs:
  - name: ForwardedEvents
output.logstash:
  hosts: ["elk:5044"]
  ssl.certificate_authorities: ["C:\\Program Files\\lme\\root-ca.crt"]
  ssl.certificate: "C:\\Program Files\\lme\\wlbclient.crt"
  ssl.key: "C:\\Program Files\\lme\\wlbclient.key"
"elk" is also registered in DNS.
Can you help?
Thanks in advance.
On server 2019, using the default XML provided, 'wecutil cs lme_wec_config.xml' returns
Warning: Configuration mode for the subscription is not Custom. Delivery properties are not
customizable for such mode. As a result, Delivery node from the provided configuration file
will be ignored.
Changing <ConfigurationMode> on line 16 from 'Normal' to 'Custom' resolves the issue, and allows the XML to specify custom intervals.
Hi, Thanks for putting this together!
I was going through this guide and I was wondering if an adversary could possibly leverage the scheduled task and use it as privilege escalation.
Do you think running a scheduled task as NT AUTHORITY\System on the workstations which accesses the network shares introduces an additional attack surface?
Please let me know your thoughts on this. I don’t know if this is possible, but would it be best practice to run the task as local system user?
Describe the issue
I am having issues getting this installed on a test server. When I run deploy.sh it runs through, I answer the requested questions and then it gets to "Waiting for elasticsearch to be ready"
I have left this for an hour with no joy. I have flattened the VM and started again but again getting stuck on the same section.
Environment information:
Ubuntu 18.04.4 LTS
2vCPU
12GB RAM
50GB HDD
Proxy in environment = No
To Reproduce
Steps to reproduce the behavior:
@-log01:$ sudo apt update$ sudo apt install git -y
[sudo] password for ******:
Hit:1 http://gb.archive.ubuntu.com/ubuntu bionic InRelease
Hit:2 http://gb.archive.ubuntu.com/ubuntu bionic-updates InRelease
Hit:3 http://gb.archive.ubuntu.com/ubuntu bionic-backports InRelease
Hit:4 http://gb.archive.ubuntu.com/ubuntu bionic-security InRelease
Reading package lists... Done
Building dependency tree
Reading state information... Done
111 packages can be upgraded. Run 'apt list --upgradable' to see them.
**@-log01:
E: dpkg was interrupted, you must manually run 'sudo dpkg --configure -a' to cor rect the problem.
@-log01:$ sudo apt install git -y$ apt-get update
E: dpkg was interrupted, you must manually run 'sudo dpkg --configure -a' to cor rect the problem.
**@-log01:
Reading package lists... Done
E: Could not open lock file /var/lib/apt/lists/lock - open (13: Permission denie d)
E: Unable to lock directory /var/lib/apt/lists/
W: Problem unlinking the file /var/cache/apt/pkgcache.bin - RemoveCaches (13: Pe rmission denied)
W: Problem unlinking the file /var/cache/apt/srcpkgcache.bin - RemoveCaches (13: Permission denied)
@-log01:~$ sudo su
root@-log01://# apt-get update
Hit:1 http://gb.archive.ubuntu.com/ubuntu bionic InRelease
Hit:2 http://gb.archive.ubuntu.com/ubuntu bionic-updates InRelease
Hit:3 http://gb.archive.ubuntu.com/ubuntu bionic-backports InRelease
Hit:4 http://gb.archive.ubuntu.com/ubuntu bionic-security InRelease
Reading package lists... Done
root@-log01://# sudo apt install git -y
E: dpkg was interrupted, you must manually run 'sudo dpkg --configure -a' to cor rect the problem.
root@-log01://# sudo dpkg --configure -a
Setting up man-db (2.8.3-2ubuntu0.1) ...
Updating database of manual pages ...
root@-log01://# sudo apt install git -y
Reading package lists... Done
Building dependency tree
Reading state information... Done
git is already the newest version (1:2.17.1-1ubuntu0.7).
git set to manually installed.
0 upgraded, 0 newly installed, 0 to remove and 111 not upgraded.
root@-log01://# sudo git clone https://github.com/ukncsc/lme .git /opt/lme/
Cloning into '/opt/lme'...
remote: Enumerating objects: 121, done.
remote: Counting objects: 100% (121/121), done.
remote: Compressing objects: 100% (92/92), done.
remote: Total 479 (delta 51), reused 80 (delta 27), pack-reused 358
Receiving objects: 100% (479/479), 5.05 MiB | 1007.00 KiB/s, done.
Resolving deltas: 100% (225/225), done.
root@-log01://# cd /opt/lme/Chapter\ 3\ Files/
root@-log01:/opt/lme/Chapter 3 Files# sudo ./deploy.sh install
[x] Installing prerequisites
Reading package lists...
Building dependency tree...
Reading state information...
net-tools is already the newest version (1.60+git20161116.90da8a0-1ubuntu1).
net-tools set to manually installed.
0 upgraded, 0 newly installed, 0 to remove and 111 not upgraded.
Enter the IP of this linux server: xxx.xxx.xx.xx.11
Enter the DNS name of this linux server, This needs to be resolvable from the Wi ndows Event Collector: ********
[x] Configuring winlogbeat config and certificates to use 192.168.. as the I P and ..local as the DNS
This OS was detected as: ubuntu
[x] Configuring Auto Updates
Reading package lists...
Building dependency tree...
Reading state information...
Suggested packages:
bsd-mailx default-mta | mail-transport-agent needrestart
The following packages will be upgraded:
unattended-upgrades
1 upgraded, 0 newly installed, 0 to remove and 110 not upgraded.
Need to get 41.7 kB of archives.
After this operation, 0 B of additional disk space will be used.
Get:1 http://gb.archive.ubuntu.com/ubuntu bionic-updates/main amd64 unattended-u pgrades all 1.1ubuntu1.18.04.14 [41.7 kB]
Fetched 41.7 kB in 0s (897 kB/s)
Preconfiguring packages ...
(Reading database ... 66996 files and directories currently installed.)
Preparing to unpack .../unattended-upgrades_1.1ubuntu1.18.04.14_all.deb ...
Unpacking unattended-upgrades (1.1ubuntu1.18.04.14) over (1.1ubuntu1.18.04.13) . ..
Setting up unattended-upgrades (1.1ubuntu1.18.04.14) ...
Replacing config file /etc/apt/apt.conf.d/50unattended-upgrades with new version
Processing triggers for ureadahead (0.100.0-21) ...
Processing triggers for systemd (237-3ubuntu10.33) ...
Processing triggers for man-db (2.8.3-2ubuntu0.1) ...
grep: grep: No such file or directory
grep: APT::Periodic::Update-Package-Lists "1";: No such file or directory
grep: grep: No such file or directory
grep: APT::Periodic::Unattended-Upgrade "1";: No such file or directory
grep: grep: No such file or directory
grep: APT::Periodic::Download-Upgradeable-Packages "1";: No such file or directo ry
This script will use self signed certificates for communication and encryption, Do you want to continue with self signed certificates? ([y]es/[n]o): y
[x] making root CA
Generating RSA private key, 4096 bit long modulus (2 primes)
................................................................................ ................................................................................ .............................................++++
................................................................................ .............................................................++++
e is 65537 (0x010001)
Can't load /root/.rnd into RNG
140471919972800:error:2406F079:random number generator:RAND_load_file:Cannot ope n file:../crypto/rand/randfile.c:88:Filename=/root/.rnd
[x] Signing root CA
Signature ok
subject=C = GB, ST = UK, L = London, O = Docker, CN = Swarm
Getting Private key
[x] Making logstash Cert
Generating RSA private key, 4096 bit long modulus (2 primes)
....................................................................++++
..................................................++++
e is 65537 (0x010001)
Can't load /root/.rnd into RNG
140098003489216:error:2406F079:random number generator:RAND_load_file:Cannot ope n file:../crypto/rand/randfile.c:88:Filename=/root/.rnd
[x] Signing logstash cert
Signature ok
subject=C = GB, ST = UK, L = London, O = Docker, CN = .*
Getting CA Private Key
[x] Making wlbclient Cert
Generating RSA private key, 4096 bit long modulus (2 primes)
................................................................................ .........................++++
.........................................................++++
e is 65537 (0x010001)
Can't load /root/.rnd into RNG
140436276126144:error:2406F079:random number generator:RAND_load_file:Cannot ope n file:../crypto/rand/randfile.c:88:Filename=/root/.rnd
[x] Signing wlbclient cert
Signature ok
subject=C = GB, ST = UK, L = London, O = Docker, CN = wlbclient
Getting CA Private Key
[x] Making logstash Cert
Generating RSA private key, 4096 bit long modulus (2 primes)
................................................................................ ........................................................................++++
................................................................++++
e is 65537 (0x010001)
Can't load /root/.rnd into RNG
140618921992640:error:2406F079:random number generator:RAND_load_file:Cannot ope n file:../crypto/rand/randfile.c:88:Filename=/root/.rnd
[x] Sign elasticsearch cert
Signature ok
subject=C = GB, ST = UK, L = London, O = Docker, CN = elasticsearch
Getting CA Private Key
[x] Making logstash Cert
Generating RSA private key, 4096 bit long modulus (2 primes)
.....++++
.......................................................++++
e is 65537 (0x010001)
Can't load /root/.rnd into RNG
140197543911872:error:2406F079:random number generator:RAND_load_file:Cannot ope n file:../crypto/rand/randfile.c:88:Filename=/root/.rnd
[x] Sign kibana cert
Signature ok
subject=C = GB, ST = UK, L = London, O = Docker, CN = kibana
Getting CA Private Key
[x] Installing curl to get the docker convenience script
Reading package lists...
Building dependency tree...
Reading state information...
The following additional packages will be installed:
libcurl4
The following packages will be upgraded:
curl libcurl4
2 upgraded, 0 newly installed, 0 to remove and 108 not upgraded.
Need to get 0 B/373 kB of archives.
After this operation, 0 B of additional disk space will be used.
(Reading database ... 66996 files and directories currently installed.)
Preparing to unpack .../curl_7.58.0-2ubuntu3.9_amd64.deb ...
Unpacking curl (7.58.0-2ubuntu3.9) over (7.58.0-2ubuntu3.8) ...
Preparing to unpack .../libcurl4_7.58.0-2ubuntu3.9_amd64.deb ...
Unpacking libcurl4:amd64 (7.58.0-2ubuntu3.9) over (7.58.0-2ubuntu3.8) ...
Setting up libcurl4:amd64 (7.58.0-2ubuntu3.9) ...
Setting up curl (7.58.0-2ubuntu3.9) ...
Processing triggers for man-db (2.8.3-2ubuntu0.1) ...
Processing triggers for libc-bin (2.27-3ubuntu1) ...
[x] Installing docker
curl: (77) error setting certificate verify locations:
CAfile: /etc/ssl/certs/ca-certificates.crt
CApath: /etc/ssl/certs
sh: 0: Can't open get-docker.sh
[x] Configuring docker swarm
./deploy.sh: line 325: docker: command not found
[x] Adding certificates and keys to Docker
./deploy.sh: line 249: docker: command not found
./deploy.sh: line 252: docker: command not found
./deploy.sh: line 253: docker: command not found
./deploy.sh: line 256: docker: command not found
./deploy.sh: line 257: docker: command not found
./deploy.sh: line 260: docker: command not found
./deploy.sh: line 261: docker: command not found
[x] Updating logstash configuration with logstash writer
[x] Creating custom logstash conf
./deploy.sh: line 268: docker: command not found
[x] Custom logstash config exists, Not creating
./deploy.sh: line 272: docker: command not found
./deploy.sh: line 275: docker: command not found
vm.max_map_count = 262144
./deploy.sh: line 329: docker: command not found
[x] Waiting for elasticsearch to be ready
Expected behavior
https://github.com/ukncsc/lme/blob/master/docs/chapter3-easy.md
Screenshots
Refer to To Reproduce
Windows Event Collector (please complete the following information):
N/A
Linux Server (please complete the following information):
Additional context
Add any other context about the problem here.
Hi i have been running throught the installation instructions to try and get LME up and running i have got to the ned of chapter 2 installing sysmon via GPO.
On my test machine i can see sysmon has been installed as a service and is currently running, however when i check the event log to see if it is forwarding logs i cannot see the Applications and Services Logs/Microsoft/Windows/Sysmon entry.
If i have a look at the eventlog-forwardingplugin log i see this error message 'The subscription lme is created, but one or more channels in the query could not be read at this time.'
is this the reason why event logs do not appear to be getting forwarded?
Many thanks
Mark
In the latest version of Winlogbeat (v7) they have renamed a large number of fields as detailed here; https://www.elastic.co/guide/en/beats/libbeat/current/breaking-changes-7.0.html.
If you import the Kibana dashboard then none of the visualisations retrieve any results because of this. As these new field names do not exist in the Index Pattern you can't correct the visualisations without first refreshing the field list of the Index Pattern. This in turn breaks a lot of other visualisations as the fields do not yet exist.
It would be a good idea to specific which versions of products the documentation, config files and templates have been tested on. I also found that the deploy script in Chapter 3 does not work on Ubuntu 19.04, but works mine on 18.04
Describe the issue
If automatic updates are selected during installation, they are not removed during un-installation.
To Reproduce
Steps to reproduce the behavior:
Expected behavior
The crontab entries for /opt/lme/lme_update.sh and /opt/lme/dashboard_update.sh are removed.
Is your feature request related to a problem? Please describe.
A clear and concise description of what the problem is. Ex. I'm always frustrated when [...]
No, although we have a use case for logging what our vmware hosts and switches are doing.
Describe the solution you'd like
A clear and concise description of what you want to happen.
Support for being able to log syslog messages directly.
Describe alternatives you've considered
A clear and concise description of any alternative solutions or features you've considered.
no alternatives looked at,
Additional context
Add any other context or screenshots about the feature request here.
go to dashboard > interesting process creation - advanced an error displays.

Hi i appear to have another slight issue i have managed to run through Chapter 3A now, i have installed the ubuntu server and ran the easy script everything seemed to work ok with no errors as far as i could see, i can log into Kibana and i have imported the dashboards, however i don't seem to be receiving any log files in Kibana, where can i check to see if my logging collector server is pointing to the correct db server?
I have run into a couple of issues.
I think I have the Collector set up because it shows up in subscriptions. I can not get other PCs to subscribe. I verified the GPO is processing with no errors. What did I miss?
The second thing is the Schedule Task GPO link is not right it takes you back the "Chapter 1" GPOs. I tried to create it on my own and not sure it is working either. But one step at a time.
Describe the issue
We performed the install on 14/Feb/2020, and deployed to one host for testing.
There's no new data in Kibana since 13/03/2020. I don't have any errors about "shards", so there might be something else going.
The Logstash container starts, runs for a few seconds, reports Logstash successfully started and then a few hundred ms later reports that it stops.
Running netcat in a loop on the same server locally does get a tcp connection to the beats port for about 5-10 seconds.
while true; do nc -z localhost 5044 && echo $(date) && echo pass; done;
Each time, it errors the following:
[EICAR@my-elk-server logstash]$ docker service logs lme_logstash --tail 20 --timestamps
2020-04-08T19:47:20.392839754Z lme_logstash.1.2yxa5ksufylp@my-elk-server    | 2020/04/08 19:47:20 Setting 'xpack.monitoring.enabled' from environment.
2020-04-08T19:47:20.418060522Z lme_logstash.1.2yxa5ksufylp@my-elk-server    | OpenJDK 64-Bit Server VM warning: Option UseConcMarkSweepGC was deprecated in version 9.0 and will likely be removed in a future release.
2020-04-08T19:47:22.161135090Z lme_logstash.1.2yxa5ksufylp@my-elk-server    | WARNING: An illegal reflective access operation has occurred
2020-04-08T19:47:22.161162744Z lme_logstash.1.2yxa5ksufylp@my-elk-server    | WARNING: Illegal reflective access by com.headius.backport9.modules.Modules (file:/usr/share/logstash/logstash-core/lib/jars/jruby-complete-9.2.8.0.jar) to field java.io.FileDescriptor.fd
2020-04-08T19:47:22.161166070Z lme_logstash.1.2yxa5ksufylp@my-elk-server    | WARNING: Please consider reporting this to the maintainers of com.headius.backport9.modules.Modules
2020-04-08T19:47:22.161168331Z lme_logstash.1.2yxa5ksufylp@my-elk-server    | WARNING: Use --illegal-access=warn to enable warnings of further illegal reflective access operations
2020-04-08T19:47:22.170102662Z lme_logstash.1.2yxa5ksufylp@my-elk-server    | WARNING: All illegal access operations will be denied in a future release
2020-04-08T19:47:33.093181531Z lme_logstash.1.2yxa5ksufylp@my-elk-server    | Thread.exclusive is deprecated, use Thread::Mutex
2020-04-08T19:47:35.484161627Z lme_logstash.1.2yxa5ksufylp@my-elk-server    | Sending Logstash logs to /usr/share/logstash/logs which is now configured via log4j2.properties
2020-04-08T19:47:35.750156469Z lme_logstash.1.2yxa5ksufylp@my-elk-server    | [2020-04-08T19:47:35,746][INFO ][logstash.setting.writabledirectory] Creating directory {:setting=>"path.queue", :path=>"/usr/share/logstash/data/queue"}
2020-04-08T19:47:35.769146614Z lme_logstash.1.2yxa5ksufylp@my-elk-server    | [2020-04-08T19:47:35,767][INFO ][logstash.setting.writabledirectory] Creating directory {:setting=>"path.dead_letter_queue", :path=>"/usr/share/logstash/data/dead_letter_queue"}
2020-04-08T19:47:36.220159005Z lme_logstash.1.2yxa5ksufylp@my-elk-server    | [2020-04-08T19:47:36,219][INFO ][logstash.runner] Starting Logstash {"logstash.version"=>"7.4.0"}
2020-04-08T19:47:36.261156843Z lme_logstash.1.2yxa5ksufylp@my-elk-server    | [2020-04-08T19:47:36,258][INFO ][logstash.agent           ] No persistent UUID file found. Generating new UUID {:uuid=>"8f772019-c2b3-4907-a                     ae0-d9bb20bd873a", :path=>"/usr/share/logstash/data/uuid"}
2020-04-08T19:47:38.161185419Z lme_logstash.1.2yxa5ksufylp@my-elk-server    | [2020-04-08T19:47:38,156][ERROR][logstash.agent]

Failed to execute action {:action=>LogStash::PipelineAction::Create/pipeline_id:                     main, :exception=>"LogStash::ConfigurationError", :message=>"Expected one of #, {, } at line 80, column 19 (byte 2263) after output
{\n        if \"cloned_logs\" not in [tags]
{\n  elasticsearch {\n    hosts => \"https://elasticsearch:9200\"\n
index => \"winlogbeat-%{+dd.MM.YYYY}\"\n
user => logstash_writer\n
password => \"\"",

:backtrace=>["/usr/share/logstash/logstash-core/lib/logstash/compiler.rb:41:in `compile_imperative'",
"/usr/share/logstash/logstash-core/lib/logstash/compiler.rb:49:in `compile_graph'",
"/usr/share/logstash/logstash-core/lib/logstash/compiler.rb:11:in `block in compile_sources'",
"org/jruby/RubyArray.java:2584:in `map'",
"/usr/share/logstash/logstash-core/lib/logstash/compiler.rb:10:in `compile_sources'",
"org/logstash/execution/AbstractPipelineExt.java:153:in `initialize'",
"org/logstash/execution/JavaBasePipelineExt.java:47:in `initialize'",
"/usr/share/logstash/logstash-core/lib/logstash/java_pipeline.rb:26:in `initialize'",
"/usr/share/logstash/logstash-core/lib/logstash/pipeline_action/create.rb:36:in `execute'",
"/usr/share/logstash/logstash-core/lib/logstash/agent.rb:326:in `block in converge_state'"]}

2020-04-08T19:47:38.346155190Z lme_logstash.1.2yxa5ksufylp@my-elk-server    | [2020-04-08T19:47:38,340][INFO ][logstash.agent           ] Successfully started Logstash API endpoint {:port=>9600}
2020-04-08T19:47:43.386197721Z lme_logstash.1.2yxa5ksufylp@my-elk-server    | [2020-04-08T19:47:43,385][INFO ][logstash.runner          ] Logstash shut down.
Timings like:
~]$  docker service logs lme_logstash --tail 5 --timestamps 2>&1 | grep -P '(started|shut)'
2020-04-10T13:30:02.836146295Z lme_logstash.1.0yc7t31fme7x@my-elk-server    | [2020-04-10T13:30:02,832][INFO ][logstash.agent           ] Successfully started Logstash API endpoint {:port=>9600}
2020-04-10T13:30:07.892725497Z lme_logstash.1.0yc7t31fme7x@my-elk-server    | [2020-04-10T13:30:07,891][INFO ][logstash.runner          ] Logstash shut down.
2020-04-10T13:31:34.685176801Z lme_logstash.1.3e4ebvsz0ale@my-elk-server    | [2020-04-10T13:31:34,683][INFO ][logstash.agent           ] Successfully started Logstash API endpoint {:port=>9600}
2020-04-10T13:31:39.742369997Z lme_logstash.1.3e4ebvsz0ale@my-elk-server    | [2020-04-10T13:31:39,741][INFO ][logstash.runner          ] Logstash shut down.
2020-04-10T13:31:06.866156599Z lme_logstash.1.ti90qy6z6nnp@my-elk-server    | [2020-04-10T13:31:06,863][INFO ][logstash.agent           ] Successfully started Logstash API endpoint {:port=>9600}
2020-04-10T13:31:11.915018325Z lme_logstash.1.ti90qy6z6nnp@my-elk-server    | [2020-04-10T13:31:11,913][INFO ][logstash.runner          ] Logstash shut down.
2020-04-10T13:30:35.301920517Z lme_logstash.1.iqf6q4wb7dhb@my-elk-server    | [2020-04-10T13:30:35,299][INFO ][logstash.agent           ] Successfully started Logstash API endpoint {:port=>9600}
2020-04-10T13:30:40.185109401Z lme_logstash.1.iqf6q4wb7dhb@my-elk-server    | [2020-04-10T13:30:40,181][INFO ][logstash.runner          ] Logstash shut down.
To Reproduce
Steps to reproduce the behavior:
docker service logs lme_logstash --tail 20 --timestampsExpected behavior
Data to continue to be ingested into Kibana. (Not sure if the errors from Logstash container are a red herring, and the container is shutting down for good/different reasons.
Windows Event Collector (please complete the following information):
Linux Server (please complete the following information):
Additional context
WEC is happily receiving events from the source server.
I have run through the install guide for installing LME.
Currently on step 3 - Installing Database (Easy)
When running the commands:
sudo apt update
sudo apt install git -y
sudo git clone https://github.com/ukncsc/lme.git /opt/lme/
cd /opt/lme/Chapter\ 3\ Files/
sudo ./deploy.sh install
The installation keeps hanging on "Waiting for elasticsearch to be ready"
Here is my screenshot:
ncsclme@lee:$ clear$ cd /opt/lme/Chapter\ 3\ Files/
ncsclme@lee:
ncsclme@lee:/opt/lme/Chapter 3 Files$ sudo ./deploy.sh install
[sudo] password for ncsclme:
[x] Installing prerequisites
Reading package lists...
Building dependency tree...
Reading state information...
net-tools is already the newest version (1.60+git20161116.90da8a0-1ubuntu1).
0 upgraded, 0 newly installed, 0 to remove and 0 not upgraded.
Enter the IP that winlogbeat will use to communicate with this box: 192.168.0.16
Enter the DNS name that winlogbeat uses to communicate with this box: lee
[x] Configuring winlogbeat config and certificates to use 192.168.0.16 as the IP and lee as the DNS
This OS was detected as: ubuntu
[x] Configuring Auto Updates
Reading package lists...
Building dependency tree...
Reading state information...
unattended-upgrades is already the newest version (1.1ubuntu1.18.04.12).
0 upgraded, 0 newly installed, 0 to remove and 0 not upgraded.
grep: grep: No such file or directory
grep: APT::Periodic::Update-Package-Lists "1";: No such file or directory
grep: grep: No such file or directory
grep: APT::Periodic::Unattended-Upgrade "1";: No such file or directory
grep: grep: No such file or directory
grep: APT::Periodic::Download-Upgradeable-Packages "1";: No such file or directory
This script will use self signed certificates for communication and encryption, Do you want to continue with self signed certificates? ([y]es/[n]o): y
mkdir: cannot create directory ‘certs’: File exists
[x] making root CA
Generating RSA private key, 4096 bit long modulus (2 primes)
.................................................................................++++
.......................................................++++
e is 65537 (0x010001)
Can't load /home/ncsclme/.rnd into RNG
140068364820928:error:2406F079:random number generator:RAND_load_file:Cannot open file:../crypto/rand/randfile.c:88:Filename=/home/ncsclme/.rnd
[x] Signing root CA
Signature ok
subject=C = GB, ST = UK, L = London, O = Docker, CN = Swarm
Getting Private key
[x] Making logstash Cert
Generating RSA private key, 4096 bit long modulus (2 primes)
.......................................................................++++
......................................................................................................................................................................++++
e is 65537 (0x010001)
Can't load /home/ncsclme/.rnd into RNG
139759047717312:error:2406F079:random number generator:RAND_load_file:Cannot open file:../crypto/rand/randfile.c:88:Filename=/home/ncsclme/.rnd
[x] Signing logstash cert
Signature ok
subject=C = GB, ST = UK, L = London, O = Docker, CN = lee
Getting CA Private Key
[x] Making wlbclient Cert
Generating RSA private key, 4096 bit long modulus (2 primes)
.................................................................................................................................................................................................................................................++++
..........................................................................................................++++
e is 65537 (0x010001)
Can't load /home/ncsclme/.rnd into RNG
139971302314432:error:2406F079:random number generator:RAND_load_file:Cannot open file:../crypto/rand/randfile.c:88:Filename=/home/ncsclme/.rnd
[x] Signing wlbclient cert
Signature ok
subject=C = GB, ST = UK, L = London, O = Docker, CN = wlbclient
Getting CA Private Key
[x] Making logstash Cert
Generating RSA private key, 4096 bit long modulus (2 primes)
....................................++++
........................................................................................................++++
e is 65537 (0x010001)
Can't load /home/ncsclme/.rnd into RNG
140592915624384:error:2406F079:random number generator:RAND_load_file:Cannot open file:../crypto/rand/randfile.c:88:Filename=/home/ncsclme/.rnd
[x] Sign elasticsearch cert
Signature ok
subject=C = GB, ST = UK, L = London, O = Docker, CN = elasticsearch
Getting CA Private Key
[x] Making logstash Cert
Generating RSA private key, 4096 bit long modulus (2 primes)
................................................................................................................................................................................................................................++++
...................................................................................................................................................................................................++++
e is 65537 (0x010001)
Can't load /home/ncsclme/.rnd into RNG
139683095110080:error:2406F079:random number generator:RAND_load_file:Cannot open file:../crypto/rand/randfile.c:88:Filename=/home/ncsclme/.rnd
[x] Sign kibana cert
Signature ok
subject=C = GB, ST = UK, L = London, O = Docker, CN = kibana
Getting CA Private Key
[x] Installing curl to get the docker convenience script
Reading package lists...
Building dependency tree...
Reading state information...
curl is already the newest version (7.58.0-2ubuntu3.8).
0 upgraded, 0 newly installed, 0 to remove and 0 not upgraded.
[x] Installing docker
Warning: the "docker" command appears to already exist on this system.
If you already have Docker installed, this script can cause trouble, which is
why we're displaying this warning and provide the opportunity to cancel the
installation.
If you installed the current Docker package using this script and are using it
again to update Docker, you can safely ignore this message.
You may press Ctrl+C now to abort this script.
Is this a known issue as im not finding a lot of info on this issue.
System is Ubuntu 18.04.3 LTS running on Hyper-V
16GB RAM
4 x CPU
Hi,
This is a great guide! I would like to suggest using ELK stack version 7.1.1 with OpenDistro docker image instead. This is because the xpack security plugin is now free to community users! This is a really easy switch over with great benefits (you just have to rebuild the docker images and configure basic security). Benifits such as Transport layer TLS, HTTP layer TLS and role based authentication!
Also, Sysmon10 is released! I have not played much around with the new schema but EventId 22 can now log DNS on each endpoint! Something for the future improvements
When I try to import dashboards v0.3.0.ndjson I only get an errormessage:
Sorry, there was an error
The file could not be processed.
If I try with dashboards v0.2.0.ndjson everything work as expected.
When I compare the files it looks like 0.3 are missing two lines at the top
I'm using ElasticSearch 7.8.1
Best regards
Fredrik
Is your feature request related to a problem? Please describe.
Not related to a problem
Describe the solution you'd like
Would like to see integration for Mac OSX
Describe alternatives you've considered
No other alternatives tried
Additional context
Since more organisations start using Mac OSX, it could be convenient to add support / integration for Mac OSX event monitoring
Both OSSEC and OSSIM support OSX apparently: https://www.reddit.com/r/sysadmin/comments/5nt24n/cheap_siem_solution_for_apple_mac_os_x/
And MIDAS was designed specifically around Mac OSX:
https://www.alienvault.com/blogs/labs-research/securing-mac-os-x-with-usm-and-midas
I'm in the process of installing LME.
Currently on step 3 easy.
During the Installing docker step it fails and gives error:
The repository 'https://download.docker.com/linux/ubuntu bionic Release' does not have a Release file.
I have added full install text bellow.
Server has 16GB RAM and has multipul cpu's.
Welcome to Ubuntu 18.04.3 LTS (GNU/Linux 4.15.0-70-generic x86_64)
System information as of Thu Nov 14 12:14:44 UTC 2019
System load: 0.34 Processes: 191
Usage of /: 10.5% of 58.80GB Users logged in: 0
Memory usage: 1% IP address for ens160: 172.16.200.104
Swap usage: 0%
0 packages can be updated.
0 updates are security updates.
Last login: Thu Nov 14 12:08:58 2019 from 172.16.200.103
ncsclme@lee:$ sudo apt update$ export http_proxy="http://172.16.200.125:8080"
[sudo] password for ncsclme:
Hit:1 http://archive.ubuntu.com/ubuntu bionic InRelease
Hit:2 http://archive.ubuntu.com/ubuntu bionic-updates InRelease
Hit:3 http://archive.ubuntu.com/ubuntu bionic-backports InRelease
Hit:4 http://archive.ubuntu.com/ubuntu bionic-security InRelease
Reading package lists... Done
Building dependency tree
Reading state information... Done
All packages are up to date.
ncsclme@lee:
ncsclme@lee:$ export https_proxy="https://172.16.200.125:8080"$ export HTTP_PROXY="http://172.16.200.125:8080"
ncsclme@lee:
ncsclme@lee:$ export HTTPS_PROXY="https://172.16.200.125:8080"$ env
ncsclme@lee:
env envsubst
ncsclme@lee:$ env | grep -i$ env | grep -i proxy
.bash_history .curlrc .profile .wget-hsts
.bash_logout .gitconfig .sudo_as_admin_successful
.bashrc .gnupg/ .swp
.cache/ meta-release-lts .viminfo
ncsclme@lee:
HTTP_PROXY=http://172.16.200.125:8080
https_proxy=https://172.16.200.125:8080
http_proxy=http://172.16.200.125:8080
HTTPS_PROXY=https://172.16.200.125:8080
ncsclme@lee:$ # Install Git client to be able to clone the LME repository$ sudo apt update
ncsclme@lee:
sudo apt install git -y
sudo git clone https://github.com/ukncsc/lme.git /opt/lme/
cd /opt/lme/Chapter\ 3\ Files/
Hit:1 http://archive.ubuntu.com/ubuntu bionic InRelease
Hit:2 http://archive.ubuntu.com/ubuntu bionic-updates InRelease
Hit:3 http://archive.ubuntu.com/ubuntu bionic-backports InRelease
Hit:4 http://archive.ubuntu.com/ubuntu bionic-security InRelease
Reading package lists... Done
Building dependency tree
Reading state information... Done
All packages are up to date.
ncsclme@lee:$ sudo apt install git -y$ # download a copy of the LME files
Reading package lists... Done
Building dependency tree
Reading state information... Done
git is already the newest version (1:2.17.1-1ubuntu0.4).
git set to manually installed.
0 upgraded, 0 newly installed, 0 to remove and 0 not upgraded.
ncsclme@lee:
ncsclme@lee:$ sudo git clone https://github.com/ukncsc/lme.git /opt/lme/$ # Change to the lme directory for the Linux server files
Cloning into '/opt/lme'...
remote: Enumerating objects: 85, done.
remote: Counting objects: 100% (85/85), done.
remote: Compressing objects: 100% (56/56), done.
remote: Total 443 (delta 49), reused 60 (delta 29), pack-reused 358
Receiving objects: 100% (443/443), 2.21 MiB | 3.60 MiB/s, done.
Resolving deltas: 100% (230/230), done.
ncsclme@lee:
ncsclme@lee:~$ cd /opt/lme/Chapter\ 3\ Files/
ncsclme@lee:/opt/lme/Chapter 3 Files$ # execute script with root privileges
ncsclme@lee:/opt/lme/Chapter 3 Files$ sudo ./deploy.sh install
[x] Installing prerequisites
Reading package lists...
Building dependency tree...
Reading state information...
net-tools is already the newest version (1.60+git20161116.90da8a0-1ubuntu1).
net-tools set to manually installed.
0 upgraded, 0 newly installed, 0 to remove and 0 not upgraded.
Enter the IP that winlogbeat will use to communicate with this box: 172.16.200.104
Enter the DNS name that winlogbeat uses to communicate with this box: lee
[x] Configuring winlogbeat config and certificates to use 172.16.200.104 as the IP and lee as the DNS
This OS was detected as: ubuntu
[x] Configuring Auto Updates
Reading package lists...
Building dependency tree...
Reading state information...
unattended-upgrades is already the newest version (1.1ubuntu1.18.04.12).
unattended-upgrades set to manually installed.
0 upgraded, 0 newly installed, 0 to remove and 0 not upgraded.
grep: grep: No such file or directory
grep: APT::Periodic::Update-Package-Lists "1";: No such file or directory
grep: grep: No such file or directory
grep: APT::Periodic::Unattended-Upgrade "1";: No such file or directory
grep: grep: No such file or directory
grep: APT::Periodic::Download-Upgradeable-Packages "1";: No such file or directory
This script will use self signed certificates for communication and encryption, Do you want to continue with self signed certificates? ([y]es/[n]o): y
[x] making root CA
Generating RSA private key, 4096 bit long modulus (2 primes)
.....................................................................++++
.......................................................................................................................................................................................................................................++++
e is 65537 (0x010001)
Can't load /home/ncsclme/.rnd into RNG
140241412985280:error:2406F079:random number generator:RAND_load_file:Cannot open file:../crypto/rand/randfile.c:88:Filename=/home/ncsclme/.rnd
[x] Signing root CA
Signature ok
subject=C = GB, ST = UK, L = London, O = Docker, CN = Swarm
Getting Private key
[x] Making logstash Cert
Generating RSA private key, 4096 bit long modulus (2 primes)
................................................++++
.................................................................................................++++
e is 65537 (0x010001)
Can't load /home/ncsclme/.rnd into RNG
140424946643392:error:2406F079:random number generator:RAND_load_file:Cannot open file:../crypto/rand/randfile.c:88:Filename=/home/ncsclme/.rnd
[x] Signing logstash cert
Signature ok
subject=C = GB, ST = UK, L = London, O = Docker, CN = lee
Getting CA Private Key
[x] Making wlbclient Cert
Generating RSA private key, 4096 bit long modulus (2 primes)
....................................................................................................++++
.....................................................................................++++
e is 65537 (0x010001)
Can't load /home/ncsclme/.rnd into RNG
140061927494080:error:2406F079:random number generator:RAND_load_file:Cannot open file:../crypto/rand/randfile.c:88:Filename=/home/ncsclme/.rnd
[x] Signing wlbclient cert
Signature ok
subject=C = GB, ST = UK, L = London, O = Docker, CN = wlbclient
Getting CA Private Key
[x] Making logstash Cert
Generating RSA private key, 4096 bit long modulus (2 primes)
............................................................................................++++
...............................................................................................++++
e is 65537 (0x010001)
Can't load /home/ncsclme/.rnd into RNG
139865033236928:error:2406F079:random number generator:RAND_load_file:Cannot open file:../crypto/rand/randfile.c:88:Filename=/home/ncsclme/.rnd
[x] Sign elasticsearch cert
Signature ok
subject=C = GB, ST = UK, L = London, O = Docker, CN = elasticsearch
Getting CA Private Key
[x] Making logstash Cert
Generating RSA private key, 4096 bit long modulus (2 primes)
......................................................++++
........................................................................................................................................++++
e is 65537 (0x010001)
Can't load /home/ncsclme/.rnd into RNG
140240013550016:error:2406F079:random number generator:RAND_load_file:Cannot open file:../crypto/rand/randfile.c:88:Filename=/home/ncsclme/.rnd
[x] Sign kibana cert
Signature ok
subject=C = GB, ST = UK, L = London, O = Docker, CN = kibana
Getting CA Private Key
[x] Installing curl to get the docker convenience script
Reading package lists...
Building dependency tree...
Reading state information...
curl is already the newest version (7.58.0-2ubuntu3.8).
curl set to manually installed.
0 upgraded, 0 newly installed, 0 to remove and 0 not upgraded.
[x] Installing docker
The server needs to use a proxy server and I have set proxy in the following locations:
bashrc:
function setproxy() {
export {http,https,ftp}_proxy="http://172.16.200.125:8080"
}
function unsetproxy() {
unset {http,https,ftp}_proxy
}
export http_proxy="http://172.16.200.125:8080"
export https_proxy="https://172.16.200.125:8080"
export HTTP_PROXY="http://172.16.200.125:8080"
export HTTPS_PROXY="https://172.16.200.125:8080"
curlrc
proxy = 172.16.200.125:8080
gitconfig
[HTTP]
proxy = 172.16.200.125:8080
[HTTPS]
proxy = 172.16.200.125:8080
apt.conf
acquire::http::proxy "http://172.16.200.125:8080";
acquire::https::proxy "https://172.16.200.125:8080";
ACQUIRE::HTTP::PROXY "http://172.16.200.125:8080";
ACQUIRE::HTTPS::PROXY "https://172.16.200.125:8080";
wgetrc
use_proxy=yes
http_proxy=172.16.200.125:8080
https_proxy=172.16.200.125:8080
export http_proxy="http://172.16.200.125:8080"
export https_proxy="https://172.16.200.125:8080"
export HTTP_PROXY="http://172.16.200.125:8080"
export HTTPS_PROXY="https://172.16.200.125:8080"
When I try:
wget https://download.docker.com/linux/ubuntu bionic Release
It appears to connect -
Connecting to 172.16.200.125:8080... connected.
Proxy request sent, awaiting response... 302 Moved Temporarily
Location: /linux/ubuntu/ [following]
--2019-11-14 16:00:28-- https://download.docker.com/linux/ubuntu/
Reusing existing connection to download.docker.com:443.
Proxy request sent, awaiting response... 200 OK
Length: 355 [text/html]
Saving to: âubuntu.1â
ubuntu.1 100%[=============================================>] 355 --.-KB/s in 0s
Anyone else having / had similar issues?
Docker: Docker version 19.03.2, build 6a30dfc
Linux: PRETTY_NAME="Ubuntu 18.04.3 LTS"
Logstash config: 0.2
Nginx config: 0.1
Having issues when trying to install LME:
supp-moke@vmgubappe94:~/lme/Chapter 3 Files$ sudo ./deploy.sh install
Reading package lists... Done
Building dependency tree
Reading state information... Done
net-tools is already the newest version (1.60+git20161116.90da8a0-1ubuntu1).
0 upgraded, 0 newly installed, 0 to remove and 1 not upgraded.
Enter the IP that winlogbeat will use to communicate with this box: 10.10.245.4210.10.245.42
Enter the DNS name that winlogbeat uses to communicate with this box: cmgubappe94
Configuring winlogbeat config and certificates to use 10.10.245.4210.10.245.42 as the IP and cmgubappe94 as the DNS
This OS was detected as: ubuntu
Reading package lists... Done
Building dependency tree
Reading state information... Done
unattended-upgrades is already the newest version (1.1ubuntu1.18.04.11).
0 upgraded, 0 newly installed, 0 to remove and 1 not upgraded.
grep: grep: No such file or directory
grep: APT::Periodic::Update-Package-Lists "1";: No such file or directory
grep: grep: No such file or directory
grep: APT::Periodic::Unattended-Upgrade "1";: No such file or directory
grep: grep: No such file or directory
grep: APT::Periodic::Download-Upgradeable-Packages "1";: No such file or directory
This script will use self signed certificates for communication and encryption, Do you want to continue with self signed certificates? ([y]es/[n]o): yy
Not a valid option
Generating kibana password
2avyqbgum7jo1rb8j18da0i0i
yufu21vyoo12q0evm96am68jx
1y2qzfccr8d9l664idqgjdqmb
wqiyknua9niqhrmva45v2ppsq
qgmuhvmgdzbwyjviu9e3v7go4
vm.max_map_count = 262144
We think your main disk is 16G on /dev/mapper/ubuntu--vg-ubuntu--lv
We are assigning 12 G for log storage
Sending build context to Docker daemon 4.608kB
Step 1/5 : FROM alpine:3.7
Get https://registry-1.docker.io/v2/: net/http: request canceled while waiting for connection (Client.Timeout exceeded while awaiting headers)
Creating network lme_esnet
service nginx: secret not found: nginx.crt
nothing found in stack: lme
CONTAINER ID IMAGE COMMAND CREATED STATUS PORTS NAMES
Waiting for 1 minute before configuring elasticsearch
must specify at least one container source
Error: No such container: bash
Error: No such container: bash
Reading package lists... Done
Building dependency tree
Reading state information... Done
zip is already the newest version (3.0-11build1).
0 upgraded, 0 newly installed, 0 to remove and 1 not upgraded.
mkdir: cannot create directory ‘/tmp/lme’: File exists
cp: cannot stat '/home/cc.cornwallonline.net/supp-moke/lme/Chapter 3 Files/certs/wlbclient.crt': No such file or directory
cp: cannot stat '/home/cc.cornwallonline.net/supp-moke/lme/Chapter 3 Files/certs/wlbclient.key': No such file or directory
cp: cannot stat '/home/cc.cornwallonline.net/supp-moke/lme/Chapter 3 Files/certs/root-ca.crt': No such file or directory
updating: tmp/lme/ (stored 0%)
updating: tmp/lme/wlbclient.key (deflated 24%)
updating: tmp/lme/winlogbeat.yml (deflated 42%)
updating: tmp/lme/wlbclient.crt (deflated 25%)
updating: tmp/lme/root-ca.crt (deflated 25%)
chown: invalid user: ‘ubuntu:ubuntu’
####################################################################
Hi my installation of LME seems to be removing events older that 6 day, i have tried to look for the retention period in the docker-compose-stack.yml file however i cant find the entries mentioned in the chapter 3 documentation, any ideas.
thanks
Mark
We are currently using LME for about Windows servers in our infrastructure.
Due to disk space restrictions we can currently only keep two weeks of logs on the LME server.
We would like to achieve a log retention time of 90 days.
Therefore we would like to backup and archive our LME logs to another location (e.g. AWS S3).
We are thinking of using the Elasticsearch snapshot feature for it.
https://www.elastic.co/guide/en/elasticsearch/reference/current/modules-snapshots.html
Has anyone looked into that before?
Any hints on where to configure this within LME?
Thank you.
Describe the issue
After a fresh install of master from ~4 months ago and dashboards v0.2.0.ndjson import:
panel_4 on the Security Dashboard - User Investigator has heading Sysmon event ID 1 - Process creation.
In dashboards v0.2.0.ndjson the search ID that's hooked up to this panel:
{"id":"e30872f0-e698-11e9-8be5-cd86dcca33f3","name":"panel_4","type":"search"},
To Reproduce
n/a
Expected behavior
I'd exect this panel to be called "Security Log Events" or something simlar.
Screenshots

Describe the issue
I think this could very well be a "just me" issue, but my LME Status Dashboard is empty, yet under "Discover" the events are pouring in.
To Reproduce
Follow LME instructions until you get to the point of installing winlogbeats service.
Notice that Kibana is up and running but not collecting any events.
Don't follow the directions and install the winlogbeat service without the files being in the right place :-(
Stop/uninstall winlogbeat
Put files in the right paths :-)
Reinstall winlog beat
Check that winlogbeat is started and winlogbeat log is free of errors.
Check Kibana and see under "discover" that events are pouring in.
Click Dashboard->LME Status Dashboard and note 0 events and 0 computers found.
Delete the dashboard and reimport for good luck.
Still an empty LME status dashboard.
Anything else I can try?
Thanks,
Brian
I've recently deployed a LME cluster onto a supported ubuntu OS and have experienced the following situation:
Winlogbeat will push all events including any historic events into the logstash container.
Logstash then pushes all of these events into elasticsearch, however if the push from elasticsearch fails then these events do not appear to be queued within logstash.
On my install, elasticsearch has set a 1000 shard limit. With each index using 4 shards and each day using a single index there is a maximum of 249 days worth of logging available before elasticsearch drops new events and the push from logstash to elasticsearch fails. In my specific case the cluster lasted a little under a week before running out of indexes due to the initial push of historic events.
The specific error in the logstash container logs is:
[WARN ][logstash.outputs.elasticsearch] Could not index event to Elasticsearch. {:status=>400, :action=>["index", {:_id=>nil, :_index=>"winlogbeat-12.03.2020", :_type=>"_doc", :routing=>nil}, #<LogStash::Event:0x2de12e62>], :response=>{"index"=>{"_index"=>"winlogbeat-12.03.2020", "_type"=>"_doc", "_id"=>nil, "status"=>400, "error"=>{"type"=>"validation_exception", "reason"=>"Validation Failed: 1: this action would add [4] total shards, but this cluster currently has [1000]/[1000] maximum shards open;"}}}}
As logstash does not appear to be queuing these events there does not appear to be any easy way to resend the dropped events now that I have deleted old indexes. Perhaps this is something specific to my install or I have missed something in the documentation however I was not aware that there was a limit to the number of days of event logs that the cluster would be able to handle.
Is your feature request related to a problem? Please describe.
Out-of-the-box, ElasticSearch does not support alerting on events for the free versions.
Describe the solution you'd like
Several third-party tools exist which allow for the inclusion of alerting, such as ElastAlert by Yelp: https://github.com/Yelp/elastalert
Describe alternatives you've considered
Switching to OpenDistro for ElasticSearch is an alternative, but there may be compatibility issues, and alerting methods are limited to web hooks.
Describe the issue
If I select autoupdates when install logstash, the update script will eventually lose the logstash writer password, somehow. I suspect the sed command in deploy.sh is weak and needs some improvement, but am unsure of the exact cause.
To Reproduce
Steps to reproduce the behavior:
Expected behavior
Update retains the logstash writer passwords
Linux Server (please complete the following information):
Additional context
Fresh install, no other issues
Trying out the LME setup in a lab. In chapter 4 I have imported the ndjson file but it has not done the index that it says it will do when the file is imported. How do I setup the index?
Hi, Thanks for putting this together! Its a great resource and easily understandable. I wanted to ask a question regarding sigcheck.
I was wondering why you have included the sigcheck tool along with Sysmon? Since sysmon provides you with the file hash anyway, is there a need for Sigcheck? Or is there another reason/use for this tool? Please let me know. Thanks!
A declarative, efficient, and flexible JavaScript library for building user interfaces.
🖖 Vue.js is a progressive, incrementally-adoptable JavaScript framework for building UI on the web.
TypeScript is a superset of JavaScript that compiles to clean JavaScript output.
An Open Source Machine Learning Framework for Everyone
The Web framework for perfectionists with deadlines.
A PHP framework for web artisans
Bring data to life with SVG, Canvas and HTML. 📊📈🎉
JavaScript (JS) is a lightweight interpreted programming language with first-class functions.
Some thing interesting about web. New door for the world.
A server is a program made to process requests and deliver data to clients.
Machine learning is a way of modeling and interpreting data that allows a piece of software to respond intelligently.
Some thing interesting about visualization, use data art
Some thing interesting about game, make everyone happy.
We are working to build community through open source technology. NB: members must have two-factor auth.
Open source projects and samples from Microsoft.
Google ❤️ Open Source for everyone.
Alibaba Open Source for everyone
Data-Driven Documents codes.
China tencent open source team.