This is the repository for the charts and data visualisations at the OCHA sites.
All the charts and data visualisations in this repository are SVG elements created using D3.js, a JavaScript library for manipulating documents based on data.
Instructions for the use of the charts and data visualisations can be found in their specific links.
All charts and data visualisations in this repository use a common CSS file.
- CBPF Blog Page
Chart for the Country-based Pooled Funds (CBPF) Page at the OCHA blog (Humanitarian Financing).
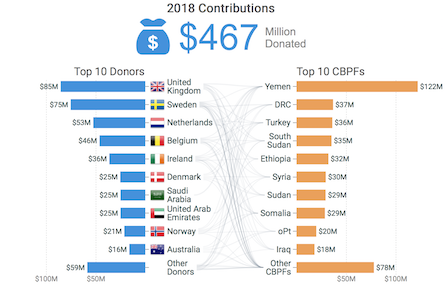
This charts shows the top 10 Donors and the top 10 CBPFs. See the chart's page for more information.
- PFBI: CBPF Contributions, lollipop chart
Chart for the Country-based Pooled Funds (CBPF) contributions in the Business Intelligence Portal at the OCHA GMS.
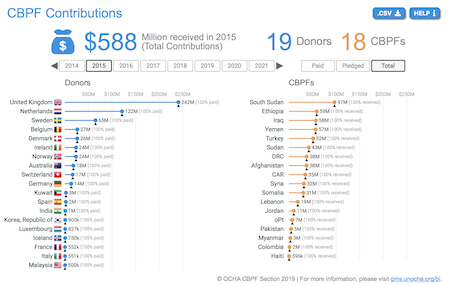
This charts shows the Donors and the CBPFs for selected years. See the chart's page for more information.
- PFBI: Contribution Trends, line graph
Chart for the Country-based Pooled Funds (CBPF) contributions in the Business Intelligence Portal at the OCHA PFBI.
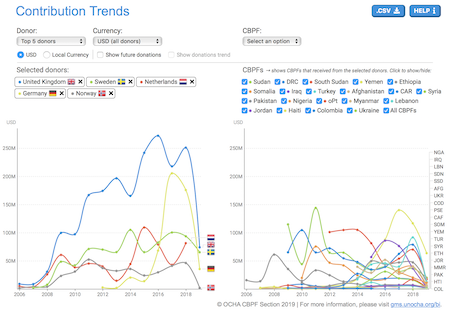
This charts shows the changes for Donors and CBPFs over the years. See the chart's page for more information.
- PFBI: Allocations by Organization Type, lollipop and parallel coordinates chart
Chart for the Country-based Pooled Funds (CBPF) allocations in the Business Intelligence Portal at the OCHA PFBI.
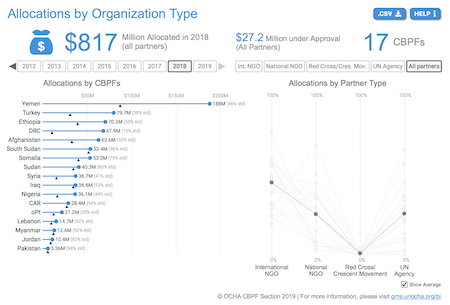
This charts shows the CBPF allocations and partner types for selected years. See the chart's page for more information.
- PFBI: Allocation Trends, line graph
Chart for the Country-based Pooled Funds (CBPF) allocations in the Business Intelligence Portal at the OCHA PFBI.
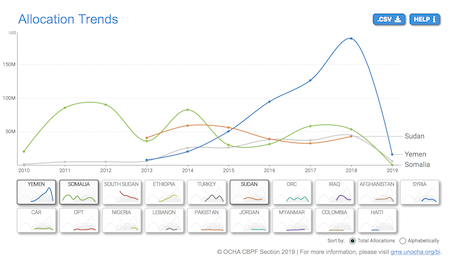
This charts shows the changes for allocations over the years. See the chart's page for more information.
- PFBI: Contributions Flow, force-directed graph
Chart for the Country-based Pooled Funds (CBPF) contributions in the Business Intelligence Portal at the OCHA PFBI.
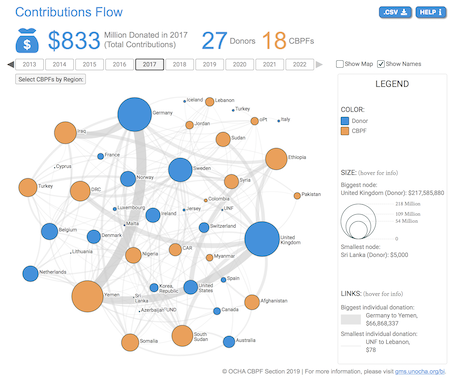
This charts shows a force-directed graph will all the Donors and the CBPFs for selected years. See the chart's page for more information.
- PFBI: Affected Persons Overview, stacked bar and pictogram chart
Chart for the Country-based Pooled Funds (CBPF) overview in the Business Intelligence Portal at the OCHA PFBI.
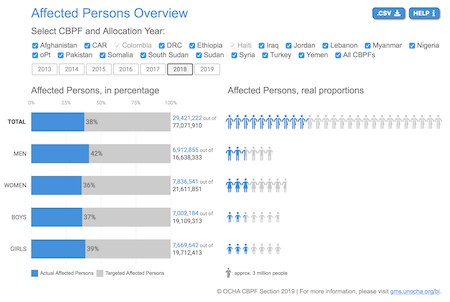
This charts shows the percentage and proportions of targeted and actual affected persons, for the selected years. See the chart's page for more information.
- PFBI: Cluster Overview, lollipop chart
Chart for the Country-based Pooled Funds (CBPF) overview in the Business Intelligence Portal at the OCHA PFBI.
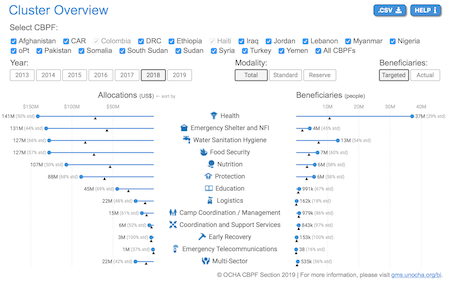
This charts shows allocations and affected persons by cluster, for the selected years. See the chart's page for more information.
- PFBI: Allocations map
Chart for the Country-based Pooled Funds (CBPF) allocations in the Business Intelligence Portal at the OCHA PFBI.
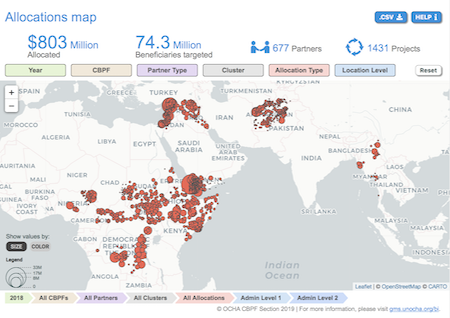
This chart shows the geographic location of allocations. See the chart's page for more information.
- PFBI: Allocations Timeline
Chart for the Country-based Pooled Funds (CBPF) allocations in the Business Intelligence Portal at the OCHA PFBI.
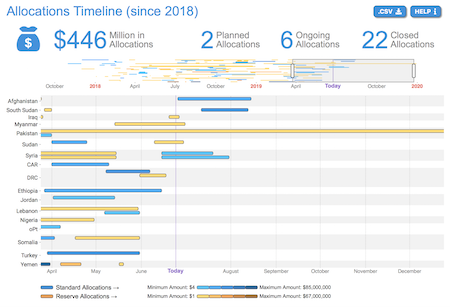
This chart shows a timeline with the allocations for a selected period. See the chart's page for more information.
- PFBI: CBPF Target versus HRP
Chart for the Country-based Pooled Funds (CBPF) Target versus HRP in the Business Intelligence Portal at the OCHA PFBI.
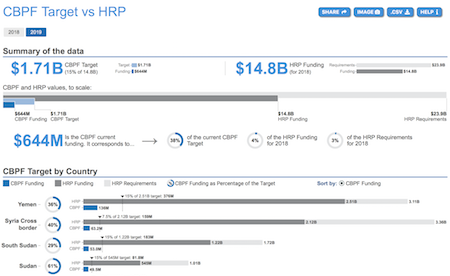
This chart shows HRP requirements, HRP funding, CBPF target and CBPF funding for each Fund. See the chart's page for more information.
- PFBI: Gender with Age Marker (GAM), beeswarm chart
Chart for the Country-based Pooled Funds (CBPF) Gender with Age Marker (GAM) in the Business Intelligence Portal at the OCHA PFBI.
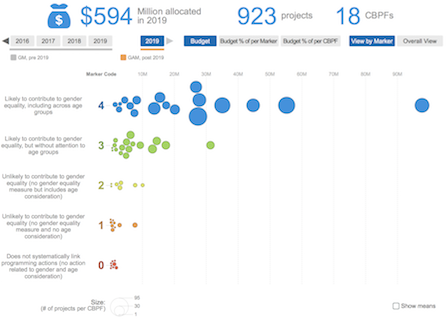
This chart shows the Gender with Age Marker (GAM) for each project in each Fund. See the chart's page for more information.
- PFBI: Allocation Flow, alluvial diagram
Chart for the Country-based Pooled Funds (CBPF) allocations in the Business Intelligence Portal at the OCHA PFBI.
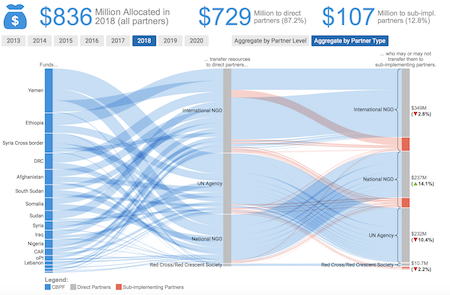
This chart shows the allocation flow from donors to direct and sub-implementing partners. See the chart's page for more information.
- PFBI: Covid19, map and timeline chart
Chart for the Country-based Pooled Funds (CBPF) and Central Emergency Response Fund (CERF) Covid19-related Allocations in the Business Inteligence Portal at the OCHA PFBI.
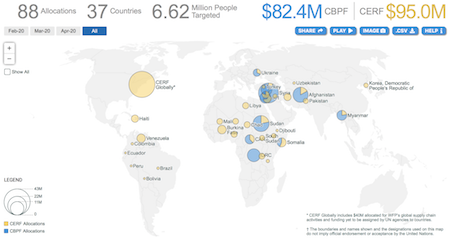
This chart shows the Covid19 allocations for each CBPF and CERF fund. See the chart's page for more information.
- GMS Landing Page
Chart for the Grant Management System landing page.
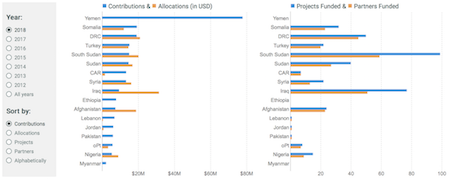
This chart shows Contributions, Allocations, Partners and Projects for the selected years. See the chart's page for more information.
Each chart and data visualisation is identified by a unique six-letter code.
This unique code is present in the JavaScript file name, in the <div> ID name, and in all CSS classes and IDs used by that respective script.
List of chart codes:
| Chart | Code |
|---|---|
| GMS Landing Page chart | gmslpg |
| CBPF Blog Page chart | cbpfbp |
| PFBI: CBPF Contributions, lollipop chart | pbiclc |
| PFBI: Contribution Trends, line graph | pbicli |
| PFBI: Allocations by Organization Type, lollipop and parallel coordinates chart | pbialp |
| PFBI: Allocation Trends, line graph | pbiali |
| PFBI: Contributions Flow, force-directed graph | pbifdc |
| PFBI: Affected Persons Overview, stacked bar and pictogram chart | pbiobe |
| PFBI: Cluster Overview, lollipop chart | pbiolc |
| PFBI: Allocations map | pbimap |
| PFBI: Allocations Timeline | pbiuac |
| PFBI: CBPF versus HRP | pbihrp |
| PFBI: Gender with Age Marker | pbigam |
| PFBI: Covid19 map | covmap |
| PFBI: Allocation Flow | pbinad |


