Giter Site home page Giter Site logo

vi-sense / vi-sense Goto Github PK

View Code? Open in Web Editor NEW
47.0 3.0 11.0 266.96 MB

vi-sense is a tool for visualizing 3d models together with IoT sensor data. This repo contains its backend written in go.

Home Page: https://visense.f4.htw-berlin.de/

License: MIT License

Dockerfile 2.66% Go 97.34%
bim iot golang gin-gonic

vi-sense's Introduction

vi-sense

vi-sense is a project of the University of Applied Sciences (HTW) Berlin and metr.systems to visualize IoT data in BIM Models.

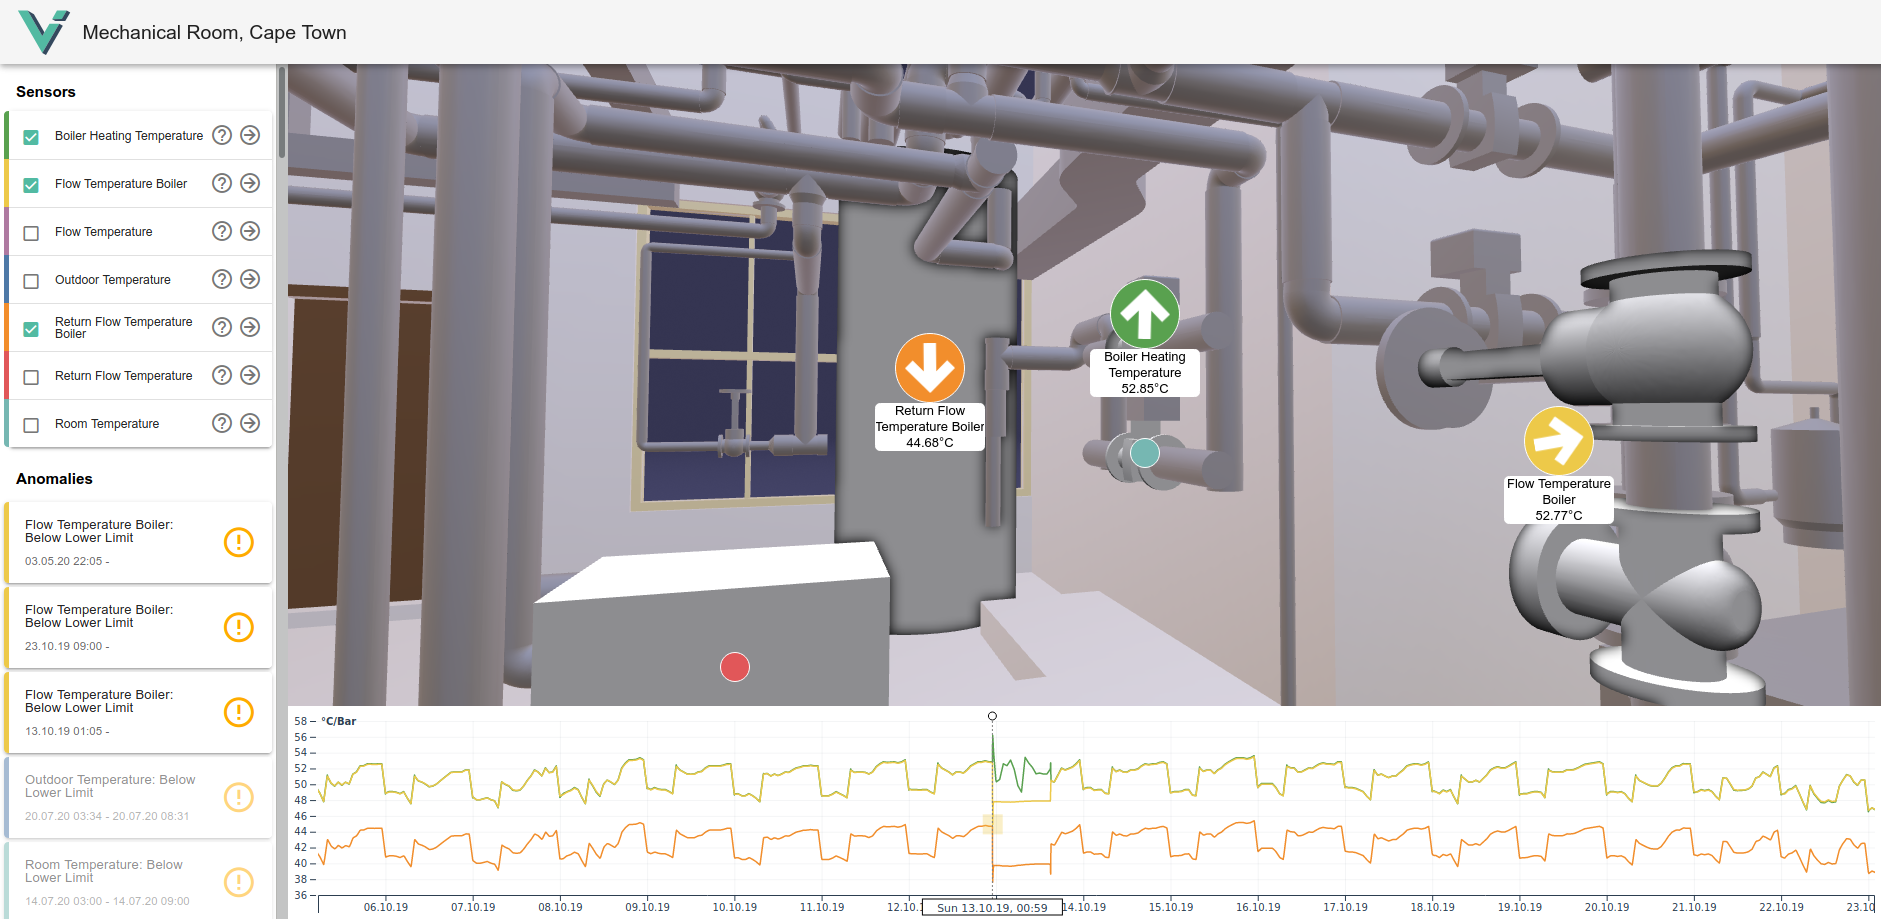
Vi-Sense is a project that visualizes data of heating systems in a 3D model of the building they’re installed in. Technicians or system administrators get an overview of all sensors located in a building, can take a closer look at the measured values of these sensors, and get information about data anomalies that indicate potential errors. The combination of the 3D representation of buildings and the visualization of measured values in a timeline makes it possible to perform detailed analyses of error sources such as the failure of heating or pump systems. In addition, sensor states in the building model are supported by color highlighting, which ensures a quick orientation and an intuitive overview. In short, the goal of Vi-Sense is to give technicians and building managers a clear overview of their properties and the sensor technology they use.

screenshot

Installation

Local development

git large file storage is needed to install this repository

git lfs install

clone the visense-frontend repo

git lfs clone --recurse-submodules [email protected]:vi-sense/vi-sense.git

alternatively

git clone --recurse-submodules [email protected]:vi-sense/vi-sense.git

cd sample-data/

git lfs pull

or update repo

git submodule update --init --recursive

cd sample-data/

git lfs pull

Running

FRONTEND_DIR=[path_to_frontend_repo] docker-compose up --build builds and starts the app in dev mode, using the source code on the machine

FRONTEND_PORT=80 docker-compose -f docker-compose.yml -f docker-compose.integration.yml up -d starts the app in integration mode, using the visense image from docker hub, frontend listens on port 80

Generate API documentation

cd into app/ swag init -g api/api.go

vi-sense's People

Contributors

dephiloper avatar grimmle avatar moethu avatar romankrajewski avatar

Stargazers

 avatar  avatar  avatar  avatar  avatar  avatar  avatar  avatar  avatar  avatar  avatar  avatar  avatar  avatar  avatar  avatar  avatar  avatar  avatar  avatar  avatar  avatar  avatar  avatar  avatar  avatar  avatar  avatar  avatar  avatar  avatar  avatar  avatar  avatar  avatar  avatar  avatar  avatar  avatar  avatar  avatar  avatar  avatar  avatar  avatar  avatar  avatar

Watchers

 avatar  avatar  avatar

vi-sense's Issues

Babylon visual stuff

  • import models and learn how to manage meshes and all their children

  • change color/opacity of certain meshes on click or hover

Research on rendering and deployment of 3d models using three.js in the browser

For a first comparison a project should be created which loads the provided 3d models of metr with three.js. The application needs to be executable in the browser.

Furthermore, the performance of three.js in combination with WebGL should be researched.
Additionally, the availability of techniques such as occlusion culling and plane clipping should be examined.

Install Docker on HTW Server

  • install docker with apt-get or something like that
  • enable starting the docker deamon on startup:
    sudo systemctl enable docker

create model page

additionally, create a model page to the already existing start page

  • transform the start page into the model page or redirect

Create minimal Go Server and Deploy with Docker

  • minimal Go Server
  • test for minimal Go Server
  • set up automatic testing with GitHub Actions
  • Dockerfile that builds runnable Server Docker image
  • Dockerfile or Github Action that builds a minimal Server docker image (that contains only our binaries and is only 5mb)
  • Deploy Docker container to HTW server with GitHub Actions

Research on rendering and deployment of 3d with an alternative framework

https://gist.github.com/dmnsgn/76878ba6903cf15789b712464875cfdc

For a first comparison a project should be created which loads the provided 3d models of metr. The application needs to be executable in the browser.

Furthermore, the performance of the selected framework in combination with WebGL should be researched.
Additionally, the availability of techniques such as occlusion culling and plane clipping should be examined.

Babylon technical Setup / Initialization

  • Read about performance improvements
  • setup TypeScript + Webpack
  • install Babylon inspector
  • Load glTF files properly: normalize/center the model, read about pivot/origin etc.

First concept proposal

Based on #8

Start Page

Requirements

  • Some Information about what this application is, welcome Page
  • List all available Buildings, Houses, Rooms, ... (Its not a model, its a real object)
  • Select a building and go to Model Page

Optional Features

  • Give information about building properties, type of building, its location, weather conditions at location
  • Give basic status information (e.g. "All systems running well" or in red: "Danger! heating pipe exceed maximum temperature")
  • Give basic status information about past events (e.g. "There was one alarm since your last visit")

Model Page

This is a distinguish page. It has to be visualized clearly! The page is built up from some basic components:

  • Model pane (Babylon) for 3D model visualizations
  • Information pane (Vue) for external 2D visualizations
  • Timeline (Vue)
  • Option pane (Vue)

We have two states

  • No sensor selected (#State1)
  • Sensor selected (#Satet2)

Basics of Model Pane and Information Pane

  • Loading screen with progress bar for loading model files
  • Sensor visualization, no sensor selected:
    • in Babylon: 3D model at sensor location or 2D overlay. Show very reduced information (e.g. sensor name, temperature. Only 1-2 information, not more!)
    • in Vue: (hierarchical) list of Sensors (collapsible)
  • Sensor selection:
    • in Babylon: raycasting
    • in Vue: list item selection
  • #State2, sensor is selected:
    • in Babylon: Make clear witch parts of the building/model the sensor belongs to (e.g. visually indicate its corresponding model parts as well, camera flight to sensor?)
    • in Vue: graphs of its data

Timeline and time selection

  • when opening the page, the data shown in the graphs are up to date and in real time
  • it is visually reduced in the beginning but can be enlarged
  • the selection of a time has a direct impact on all(!) shown data!!! (Graphs, sensors, ...)
  • #State2: show the senso data graph in the timeline

Option pane

  • collapsible
  • show state specific options
  • not sure yet if really needed but i want all options to be separated from the information pane

Further ideas and notes

  • Sensor data handling, how to find anomalies? We need to know their normal values (deviations, AI?)
  • There is more then one data/graph for one sensor. So our graph visualisations needs to be scalble (e.g. multiple graphs per chart, multiple charts)
  • Danger Mode: automatically select a sensor, when it has dangerous values


use string formatter in go

just a quick note, I'd recommend using string formatting with fmt
s := fmt.Sprintf("%s %s", ...)

t, _ := time.Parse(Layout, line[0]+" "+line[1])

And test if the line actually has enough fields, what if there is only one char? The parser might fail to so just handle the error with a simple panic, since this is critical for the entire app.

create information pane

  • expandable list of all sensors (selectable)
  • when expanded shows sensor information (name, description, current value, ...)

see #40

  • Vuetify Implementation
  • Sketch the whole Information Pane with all features by now
  • Refactor Code
  • CSS formatting (@dephiloper: need probably help on this step)
  • TODOs onSensorSelectionChanged & getSelectedSensors in InformationPane.vue

Research on rendering and deployment of 3d models using unity in the browser

For a first comparison a project should be created which loads the provided 3d models of metr in unity. The application needs to be executable in the browser.

Furthermore, the performance of Unity in combination with WebGL should be researched.
Additionally, the availability of techniques such as occlusion culling and plane clipping should be examined.

Recommend Projects

  • React photo React

    A declarative, efficient, and flexible JavaScript library for building user interfaces.

  • Vue.js photo Vue.js

    🖖 Vue.js is a progressive, incrementally-adoptable JavaScript framework for building UI on the web.

  • Typescript photo Typescript

    TypeScript is a superset of JavaScript that compiles to clean JavaScript output.

  • TensorFlow photo TensorFlow

    An Open Source Machine Learning Framework for Everyone

  • Django photo Django

    The Web framework for perfectionists with deadlines.

  • D3 photo D3

    Bring data to life with SVG, Canvas and HTML. 📊📈🎉

Recommend Topics

  • javascript

    JavaScript (JS) is a lightweight interpreted programming language with first-class functions.

  • web

    Some thing interesting about web. New door for the world.

  • server

    A server is a program made to process requests and deliver data to clients.

  • Machine learning

    Machine learning is a way of modeling and interpreting data that allows a piece of software to respond intelligently.

  • Game

    Some thing interesting about game, make everyone happy.

Recommend Org

  • Facebook photo Facebook

    We are working to build community through open source technology. NB: members must have two-factor auth.

  • Microsoft photo Microsoft

    Open source projects and samples from Microsoft.

  • Google photo Google

    Google ❤️ Open Source for everyone.

  • D3 photo D3

    Data-Driven Documents codes.