
![]()
R package for Airborne LiDAR Data Manipulation and Visualization for Forestry Applications
The lidR package provides functions to read and write .las and .laz files, plot point clouds, compute metrics using an area-based approach, compute digital canopy models, thin LiDAR data, manage a collection of LAS/LAZ files, automatically extract ground inventories, process a collection of tiles using multicore processing, segment individual trees, classify points from geographic data, and provides other tools to manipulate LiDAR data in a research and development context.
📖 Read the book to get started with the lidR package. See changelogs on NEW.md
To cite the package use citation() from within R:
citation("lidR")
#> Roussel, J.R., Auty, D., Coops, N. C., Tompalski, P., Goodbody, T. R. H., Sánchez Meador, A., Bourdon, J.F., De Boissieu, F., Achim, A. (2020). lidR : An R package for analysis of Airborne Laser Scanning (ALS) data. Remote Sensing of Environment, 251 (August), 112061. <doi:10.1016/j.rse.2020.112061>.
#> Jean-Romain Roussel and David Auty (2021). Airborne LiDAR Data Manipulation and Visualization for Forestry Applications. R package version 3.1.0. https://cran.r-project.org/package=lidR
In R-fashion style the function plot, based on rgl, enables the user to display, rotate and zoom a point cloud. Because rgl has limited capabilities with respect to large datasets, we also made a package lidRviewer with better display capabilities.
las <- readLAS("<file.las>")
plot(las)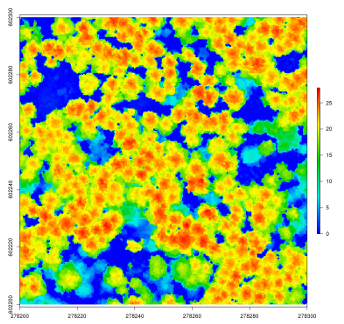
lidR has several algorithms from the literature to compute canopy height models either point-to-raster based or triangulation based. This allows testing and comparison of some methods that rely on a CHM, such as individual tree segmentation or the computation of a canopy roughness index.
las <- readLAS("<file.las>")

# Khosravipour et al. pitfree algorithm
thr <- c(0,2,5,10,15)
edg <- c(0, 1.5)
chm <- rasterize_canopy(las, 1, pitfree(thr, edg))

plot(chm)
lidR enables the user to manage, use and process a collection of las files. The function readLAScatalog builds a LAScatalog object from a folder. The function plot displays this collection on an interactive map using the mapview package (if installed).
ctg <- readLAScatalog("<folder/>")
plot(ctg, map = TRUE)
From a LAScatalog object the user can (for example) extract some regions of interest (ROI) with clip_roi(). Using a catalog for the extraction of the ROI guarantees fast and memory-efficient clipping. LAScatalog objects allow many other manipulations that can be done with multicore processing.
The segment_trees() function has several algorithms from the literature for individual tree segmentation, based either on the digital canopy model or on the point-cloud. Each algorithm has been coded from the source article to be as close as possible to what was written in the peer-reviewed papers. Our goal is to make published algorithms usable, testable and comparable.
las <- readLAS("<file.las>")

las <- segment_trees(las, li2012())
col <- random.colors(200)
plot(las, color = "treeID", colorPalette = col)
Most of the lidR functions can seamlessly process a set of tiles and return a continuous output. Users can create their own methods using the LAScatalog processing engine via the catalog_apply() function. Among other features the engine takes advantage of point indexation with lax files, takes care of processing tiles with a buffer and allows for processing big files that do not fit in memory.
# Load a LAScatalog instead of a LAS file
ctg <- readLAScatalog("<path/to/folder/>")

# Process it like a LAS file
chm <- rasterize_canopy(ctg, 2, p2r())
col <- random.colors(50)
plot(chm, col = col)
lidR can read full waveform data from LAS files and provides interpreter functions to convert the raw data into something easier to manage and display in R. The support of FWF is still in the early stages of development.
fwf <- readLAS("<fullwaveform.las>")

# Interpret the waveform into something easier to manage
las <- interpret_waveform(fwf)

# Display discrete points and waveforms
x <- plot(fwf, colorPalette = "red", bg = "white")
plot(las, color = "Amplitude", add = x)lidR is developed openly at Laval University.
- Development of the
lidRpackage between 2015 and 2018 was made possible thanks to the financial support of the AWARE project (NSERC CRDPJ 462973-14); grantee Prof Nicholas Coops. - Development of the
lidRpackage between 2018 and 2021 was made possible thanks to the financial support of the Ministère des Forêts, de la Faune et des Parcs of Québec.

# Ubuntu
sudo add-apt-repository ppa:ubuntugis/ubuntugis-unstable
sudo apt-get update
sudo apt-get install libgdal-dev libgeos++-dev libudunits2-dev libproj-dev libx11-dev libgl1-mesa-dev libglu1-mesa-dev libfreetype6-dev libxt-dev libfftw3-dev

# Fedora
sudo dnf install gdal-devel geos-devel udunits2-devel proj-devel mesa-libGL-devel mesa-libGLU-devel freetype-devel libjpeg-turbo-devel


