Giter Site home page Giter Site logo

weihao / bungeecord-prometheus-exporter Goto Github PK

View Code? Open in Web Editor NEW
70.0 5.0 21.0 1.34 MB

๐Ÿ“Š A lightweight Bungeecord/Velocity plugin that exports network stats to Prometheus

License: MIT License

Java 100.00%
bungeecord bungeecord-plugin bungeecord-network prometheus prometheus-exporter grafana exporter monitoring metrics velocitypowered

bungeecord-prometheus-exporter's Introduction

en zh-Hans jp Release GitHub all releases

BungeeCord Prometheus Exporter

A plugin that exports network stats for Prometheus.

If you don't run a network proxy, you might also be interested in Prometheus Exporter for a single server metrics!

Why BungeeCord Prometheus Exporter?

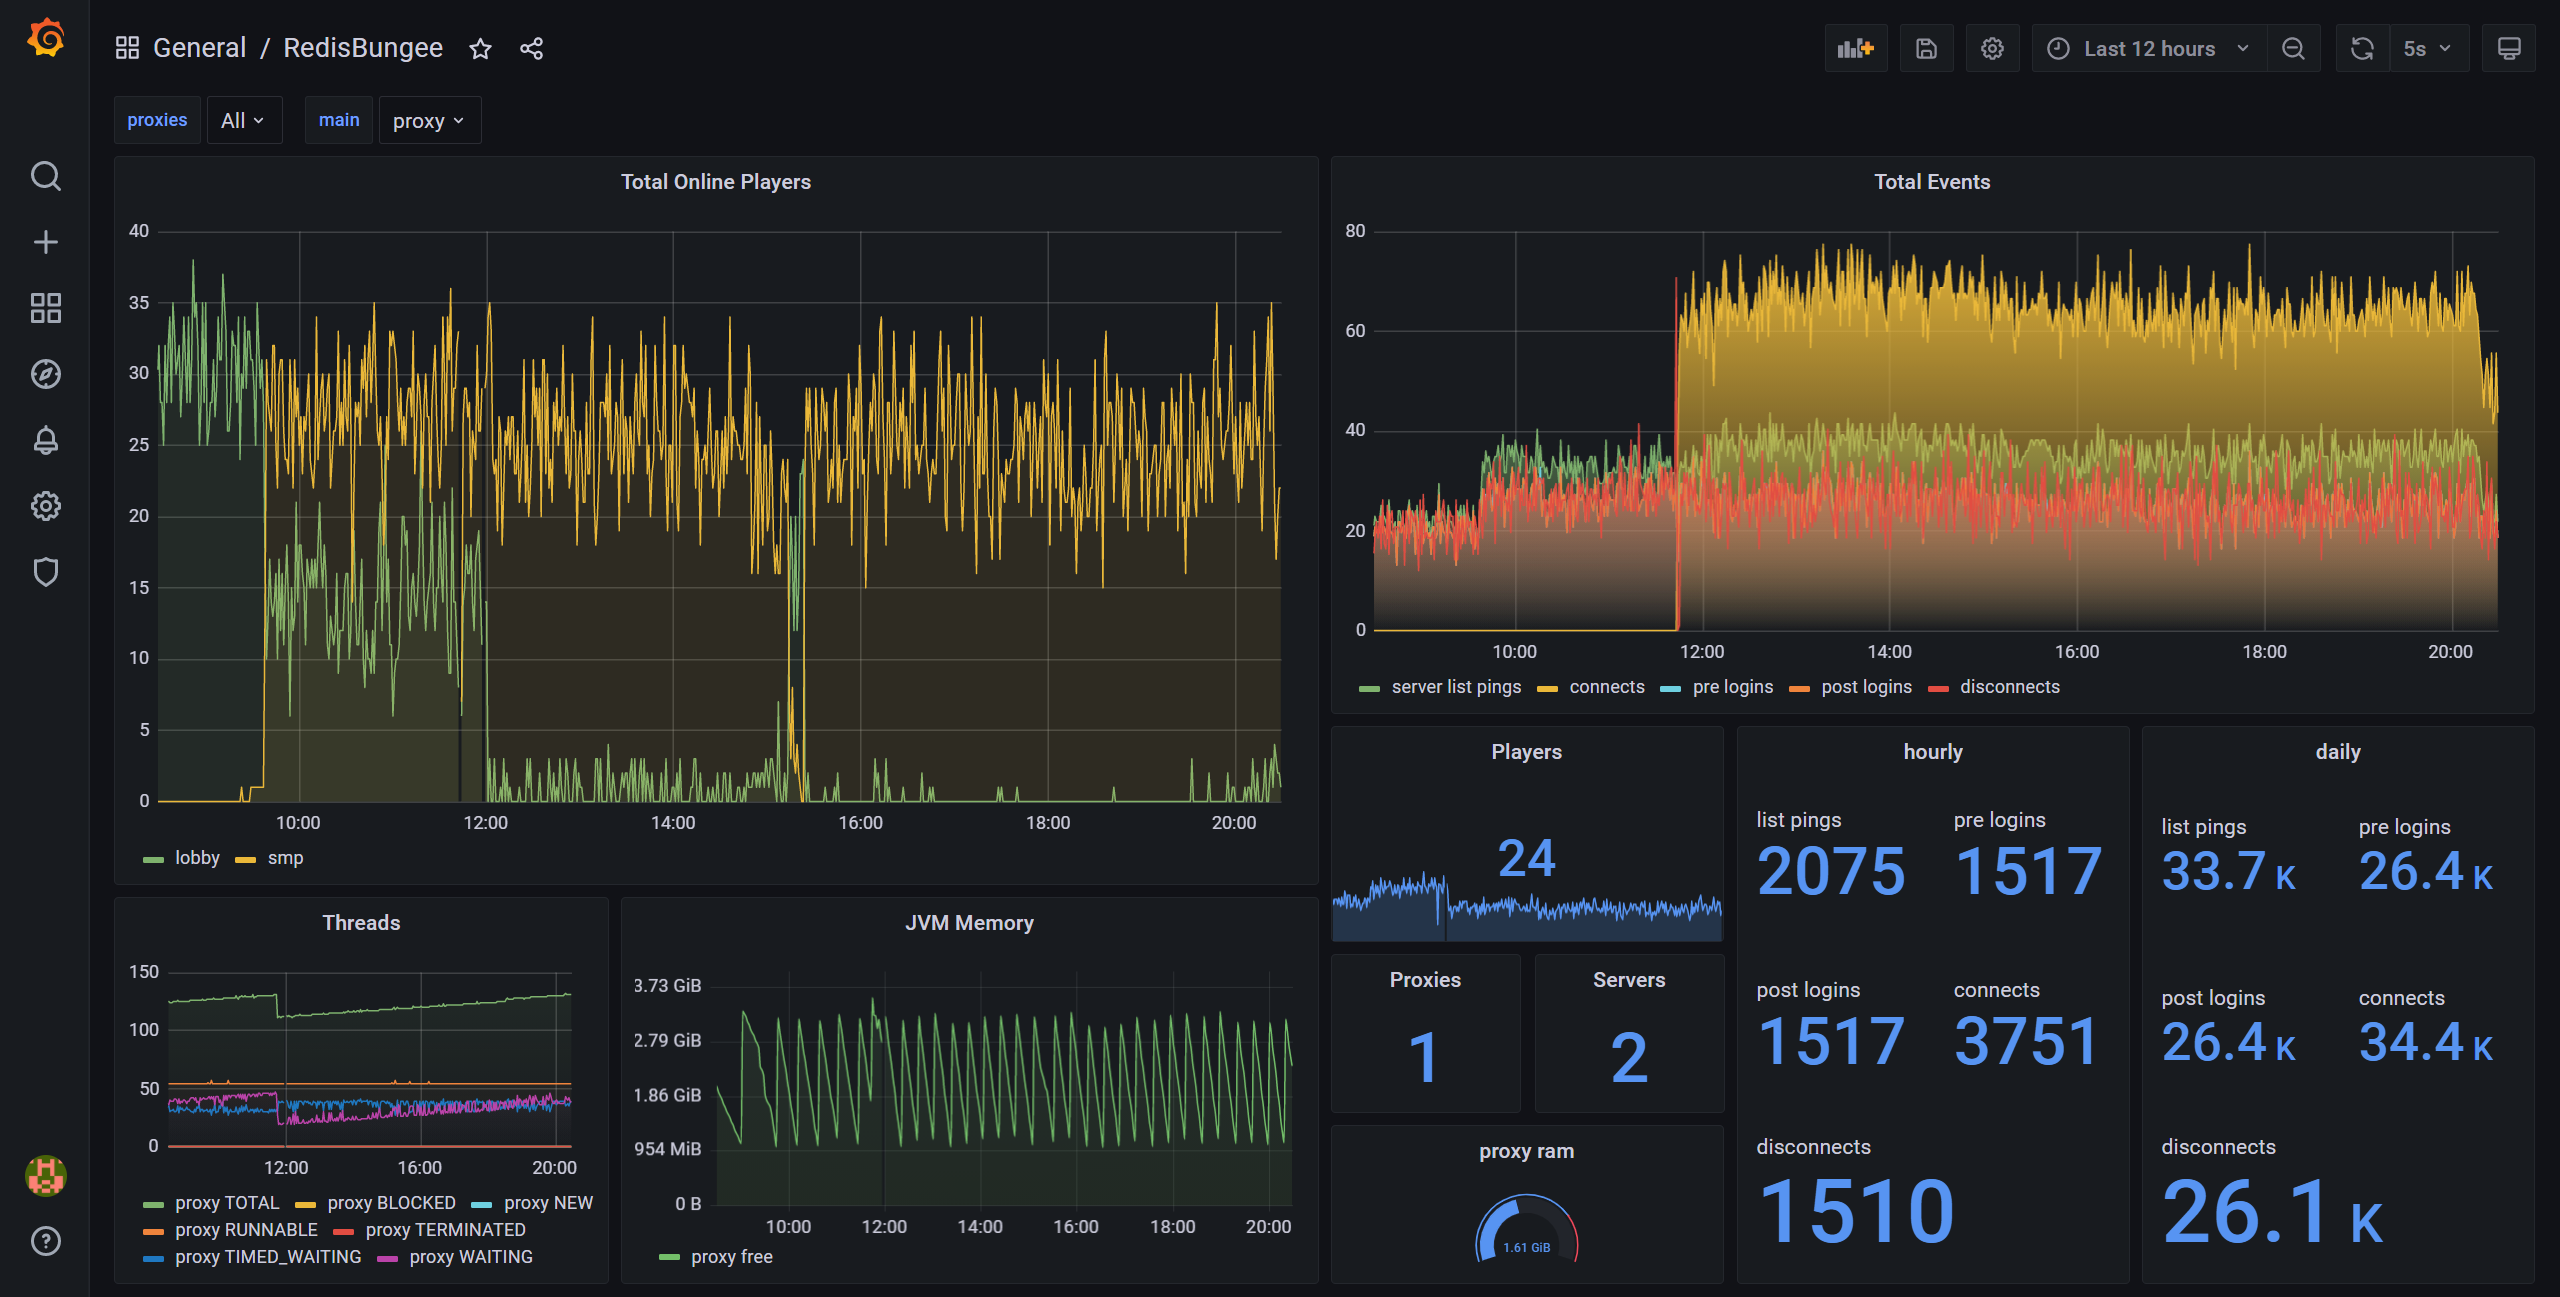
  • monitor your server infrastructure
  • track your players, events, and servers
    • player pings histogram
    • online player list
    • server list ping, connects, disconnects, kicks, and chat event counters
  • automates the collection, management and viewing of your data
  • get alerts for service outages

Runtime Requirement

  • Java 17+

Compatible Proxy

  • Velocity
  • BungeeCord / Waterfall
  • RedisBungee

Quick Start

Drop the bungeecord-prometheus-exporter.jar into your plugins directory and start your proxy server.

After startup, the Prometheus metrics endpoint should be available at localhost:9985/metrics (assuming localhost is the server hostname).

If running inside the docker, change the host to 0.0.0.0 to allow Prometheus and other services to reach the endpoint.

The metrics port can be customized in the plugin's config.json (a default config will be created after the first use).

Prometheus config

Add the following job to the scrape_configs section of your Prometheus configuration prometheus.yml:

Single Proxy

  - job_name: 'bungeecord'
    scrape_interval: 5s

    static_configs:
      - targets: [ 'localhost:9985' ]
        labels:
          proxy_name: 'proxy'

Multiple proxies

You can use labels in your Prometheus scrape configuration to distinguish between multiple proxies:

  - job_name: 'bungeecord'
    scrape_interval: 5s

    static_configs:
      - targets: [ 'localhost:9985' ]
        labels:
          proxy_name: 'proxy1'
      - targets: [ 'localhost:9226' ]
        labels:
          proxy_name: 'proxy2'

Import Grafana Dashboard

  1. Navigate to Grafana -> Dashboards -> Import
  2. Paste in or upload default dashboard
  3. default dashboard

Notes

RedisBungee is supported but disabled by default . RedisBungee metrics are not used in the dashboard because we are already collecting metrics from single instances. However, if you still want to integrate with RedisBungee, free feel to enable it and modify the dashboard.

Links

This project is indexed at:

bungeecord-prometheus-exporter's People

Contributors

25 avatar alexprogrammerde avatar dependabot[bot] avatar dirtboll avatar dreamscached avatar f4bii avatar lhridder avatar mend-bolt-for-github[bot] avatar weihao avatar

Stargazers

 avatar  avatar  avatar  avatar  avatar  avatar  avatar  avatar  avatar  avatar  avatar  avatar  avatar  avatar  avatar  avatar  avatar  avatar  avatar  avatar  avatar  avatar  avatar  avatar  avatar  avatar  avatar  avatar  avatar  avatar  avatar  avatar  avatar  avatar  avatar  avatar  avatar  avatar  avatar  avatar  avatar  avatar  avatar  avatar  avatar  avatar  avatar  avatar  avatar  avatar  avatar  avatar  avatar  avatar  avatar  avatar  avatar  avatar  avatar  avatar  avatar  avatar  avatar  avatar  avatar  avatar  avatar  avatar  avatar  avatar

Watchers

 avatar  avatar  avatar  avatar  avatar

bungeecord-prometheus-exporter's Issues

`bungeecord_online_players` gauge metrics accumulate to unusually high values

We are seeing that bungeecord_online_players on a single server steadily rising up to ~700 even if we have only a few people in the said server.

image

Setup information

We are running two separate BungeeCord networks with 2 BungeeCord instances (connected by a RedisBungee) for each. In the network that we observed the issue, we have a lobby server that players entering the server first land on the lobby and then proceed to game servers (named s1, s2, ...). For plugin config, we are using the default config with host changed to 0.0.0.0.

Additional information

I can confirm that this is not a Prometheus or Dashboard problem, since curling host:9225/metrics returned data containing incorrect counts:

Raw curl result
# HELP bungeecord_server_list_pings_total the number of server list pings in BungeeCord
# TYPE bungeecord_server_list_pings_total counter
bungeecord_server_list_pings_total 12857.0
# HELP bungeecord_redis_player_disconnects_total the number of players disconnects in redisbungee
# TYPE bungeecord_redis_player_disconnects_total counter
bungeecord_redis_player_disconnects_total 0.0
# HELP bungeecord_online_players the number of online players in BungeeCord
# TYPE bungeecord_online_players gauge
bungeecord_online_players{server="s5",} 53.0
bungeecord_online_players{server="s7",} 76.0
bungeecord_online_players{server="kagawa",} 0.0
bungeecord_online_players{server="h1",} 0.0
bungeecord_online_players{server="spade",} 0.0
bungeecord_online_players{server="lobby",} 749.0
bungeecord_online_players{server="eve",} 0.0
bungeecord_online_players{server="cre",} 0.0
bungeecord_online_players{server="petra",} 0.0
bungeecord_online_players{server="reset",} 0.0
bungeecord_online_players{server="s1",} 122.0
bungeecord_online_players{server="s2",} 56.0
bungeecord_online_players{server="s3",} 69.0
# HELP bungeecord_redis_bungee_online_proxies the number of online redisbungee proxy
# TYPE bungeecord_redis_bungee_online_proxies gauge
bungeecord_redis_bungee_online_proxies 0.0
# HELP bungeecord_managed_servers the number of managed servers in BungeeCord
# TYPE bungeecord_managed_servers gauge
bungeecord_managed_servers 13.0
# HELP bungeecord_redis_online_players the number of online redisbungee players
# TYPE bungeecord_redis_online_players gauge
# HELP bungeecord_player_connects_total the number of player logins in BungeeCord
# TYPE bungeecord_player_connects_total counter
bungeecord_player_connects_total 1127.0
# HELP bungeecord_redis_player_connects_total the number of players joined in redisbungee
# TYPE bungeecord_redis_player_connects_total counter
bungeecord_redis_player_connects_total 0.0
# HELP bungeecord_jvm_threads_current Current thread count of a JVM
# TYPE bungeecord_jvm_threads_current gauge
bungeecord_jvm_threads_current 59.0
# HELP bungeecord_jvm_threads_daemon Daemon thread count of a JVM
# TYPE bungeecord_jvm_threads_daemon gauge
bungeecord_jvm_threads_daemon 16.0
# HELP bungeecord_jvm_threads_peak Peak thread count of a JVM
# TYPE bungeecord_jvm_threads_peak gauge
bungeecord_jvm_threads_peak 73.0
# HELP bungeecord_jvm_threads_started_total Started thread count of a JVM
# TYPE bungeecord_jvm_threads_started_total counter
bungeecord_jvm_threads_started_total 6549.0
# HELP bungeecord_jvm_threads_deadlocked Cycles of JVM-threads that are in deadlock waiting to acquire object monitors or ownable synchronizers
# TYPE bungeecord_jvm_threads_deadlocked gauge
bungeecord_jvm_threads_deadlocked 0.0
# HELP bungeecord_jvm_threads_deadlocked_monitor Cycles of JVM-threads that are in deadlock waiting to acquire object monitors
# TYPE bungeecord_jvm_threads_deadlocked_monitor gauge
bungeecord_jvm_threads_deadlocked_monitor 0.0
# HELP bungeecord_jvm_threads_state Current count of threads by state
# TYPE bungeecord_jvm_threads_state gauge
bungeecord_jvm_threads_state{state="WAITING",} 20.0
bungeecord_jvm_threads_state{state="TERMINATED",} 0.0
bungeecord_jvm_threads_state{state="TIMED_WAITING",} 26.0
bungeecord_jvm_threads_state{state="BLOCKED",} 0.0
bungeecord_jvm_threads_state{state="RUNNABLE",} 13.0
bungeecord_jvm_threads_state{state="NEW",} 0.0
# HELP bungeecord_jvm_memory JVM memory usage
# TYPE bungeecord_jvm_memory gauge
bungeecord_jvm_memory{type="max",} 1.037959168E9
bungeecord_jvm_memory{type="used",} 2.51358936E8
bungeecord_jvm_memory{type="free",} 7.86600232E8
bungeecord_jvm_memory{type="allocated",} 1.037959168E9
# HELP bungeecord_player_disconnects_total the number of player disconnects in BungeeCord
# TYPE bungeecord_player_disconnects_total counter
bungeecord_player_disconnects_total 1085.0
# HELP bungeecord_jvm_gc_collection_seconds Time spent in a given JVM garbage collector in seconds.
# TYPE bungeecord_jvm_gc_collection_seconds summary
bungeecord_jvm_gc_collection_seconds_count{gc="Copy",} 157.0
bungeecord_jvm_gc_collection_seconds_sum{gc="Copy",} 1.274
bungeecord_jvm_gc_collection_seconds_count{gc="MarkSweepCompact",} 3.0
bungeecord_jvm_gc_collection_seconds_sum{gc="MarkSweepCompact",} 0.129
# HELP bungeecord_player_connects_created the number of player logins in BungeeCord
# TYPE bungeecord_player_connects_created gauge
bungeecord_player_connects_created 1.654299670094E9
# HELP bungeecord_player_disconnects_created the number of player disconnects in BungeeCord
# TYPE bungeecord_player_disconnects_created gauge
bungeecord_player_disconnects_created 1.654299670096E9
# HELP bungeecord_redis_player_connects_created the number of players joined in redisbungee
# TYPE bungeecord_redis_player_connects_created gauge
bungeecord_redis_player_connects_created 1.654299670102E9
# HELP bungeecord_redis_player_disconnects_created the number of players disconnects in redisbungee
# TYPE bungeecord_redis_player_disconnects_created gauge
bungeecord_redis_player_disconnects_created 1.654299670102E9
# HELP bungeecord_server_list_pings_created the number of server list pings in BungeeCord
# TYPE bungeecord_server_list_pings_created gauge
bungeecord_server_list_pings_created 1.654299670097E9

Do you think it is possible that ServerInfo#getPlayers in this line is returning obsolete player connections too?

this.getGauge().labels(key).set(servers.get(key).getPlayers().size());

CVE-2023-1370 (High) detected in json-smart-2.4.7.jar

CVE-2023-1370 - High Severity Vulnerability

Vulnerable Library - json-smart-2.4.7.jar

JSON (JavaScript Object Notation) is a lightweight data-interchange format. It is easy for humans to read and write. It is easy for machines to parse and generate. It is based on a subset of the JavaScript Programming Language, Standard ECMA-262 3rd Edition - December 1999. JSON is a text format that is completely language independent but uses conventions that are familiar to programmers of the C-family of languages, including C, C++, C#, Java, JavaScript, Perl, Python, and many others. These properties make JSON an ideal data-interchange language.

Library home page: https://urielch.github.io/

Path to dependency file: /pom.xml

Path to vulnerable library: /home/wss-scanner/.m2/repository/net/minidev/json-smart/2.4.7/json-smart-2.4.7.jar

Dependency Hierarchy:

  • json-path-2.7.0.jar (Root Library)
    • โŒ json-smart-2.4.7.jar (Vulnerable Library)

Found in base branch: main

Vulnerability Details

Json-smart is a performance focused, JSON processor lib.

When reaching a โ€˜[โ€˜ or โ€˜{โ€˜ character in the JSON input, the code parses an array or an object respectively.

It was discovered that the code does not have any limit to the nesting of such arrays or objects. Since the parsing of nested arrays and objects is done recursively, nesting too many of them can cause a stack exhaustion (stack overflow) and crash the software.

Publish Date: 2023-03-22

URL: CVE-2023-1370

CVSS 3 Score Details (7.5)

Base Score Metrics:

  • Exploitability Metrics:
    • Attack Vector: Network
    • Attack Complexity: Low
    • Privileges Required: None
    • User Interaction: None
    • Scope: Unchanged
  • Impact Metrics:
    • Confidentiality Impact: None
    • Integrity Impact: None
    • Availability Impact: High

For more information on CVSS3 Scores, click here.

Suggested Fix

Type: Upgrade version

Origin: https://research.jfrog.com/vulnerabilities/stack-exhaustion-in-json-smart-leads-to-denial-of-service-when-parsing-malformed-json-xray-427633/

Release Date: 2023-03-22

Fix Resolution (net.minidev:json-smart): 2.4.9

Direct dependency fix Resolution (com.jayway.jsonpath:json-path): 2.8.0


Step up your Open Source Security Game with Mend here

Failed to collect metric 'OnlinePlayer'

[11:42:07] [Netty Boss IO Thread #0/INFO]: Listening on /0.0.0.0:25566
[11:42:08] [qtp1162203072-117/WARN] [BungeeCordPrometheusExporter]: Failed to collect metric 'OnlinePlayer': java.lang.IllegalArgumentException: Incorrect number of labels.
at io.prometheus.client.SimpleCollector.labels(SimpleCollector.java:65)
at org.akadia.prometheus.bungeecord.metrics.OnlinePlayer.lambda$doCollect$1(OnlinePlayer.java:19)
at java.base/java.util.Map.forEach(Map.java:713)
at org.akadia.prometheus.bungeecord.metrics.OnlinePlayer.doCollect(OnlinePlayer.java:18)
at org.akadia.prometheus.interfaces.Metric.collect(Metric.java:22)
at java.base/java.util.ArrayList.forEach(ArrayList.java:1511)
at org.akadia.prometheus.MetricRegistry.collectMetrics(MetricRegistry.java:26)
at org.akadia.prometheus.MetricsServer$1.handle(MetricsServer.java:43)
at org.eclipse.jetty.server.handler.HandlerWrapper.handle(HandlerWrapper.java:122)
at org.eclipse.jetty.server.handler.gzip.GzipHandler.handle(GzipHandler.java:822)
at org.eclipse.jetty.server.handler.HandlerWrapper.handle(HandlerWrapper.java:122)
at org.eclipse.jetty.server.Server.handle(Server.java:563)
at org.eclipse.jetty.server.HttpChannel.lambda$handle$0(HttpChannel.java:505)
at org.eclipse.jetty.server.HttpChannel.dispatch(HttpChannel.java:762)
at org.eclipse.jetty.server.HttpChannel.handle(HttpChannel.java:497)
at org.eclipse.jetty.server.HttpConnection.onFillable(HttpConnection.java:282)
at org.eclipse.jetty.io.AbstractConnection$ReadCallback.succeeded(AbstractConnection.java:314)
at org.eclipse.jetty.io.FillInterest.fillable(FillInterest.java:100)
at org.eclipse.jetty.io.SelectableChannelEndPoint$1.run(SelectableChannelEndPoint.java:53)
at org.eclipse.jetty.util.thread.QueuedThreadPool.runJob(QueuedThreadPool.java:969)
at org.eclipse.jetty.util.thread.QueuedThreadPool$Runner.doRunJob(QueuedThreadPool.java:1194)
at org.eclipse.jetty.util.thread.QueuedThreadPool$Runner.run(QueuedThreadPool.java:1149)
at java.base/java.lang.Thread.run(Thread.java:840)

[11:42:08] [qtp1162203072-117/WARN] [BungeeCordPrometheusExporter]: OnlinePlayer collect:java.lang.IllegalArgumentException: Incorrect number of labels.

No plugin.yml in src folder

I get the following error using your jar. Fails to initialize:

org.bukkit.plugin.InvalidDescriptionException: Invalid plugin.yml
    at org.bukkit.plugin.java.JavaPluginLoader.getPluginDescription(JavaPluginLoader.java:178) ~[paper-api-1.18.1-R0.1-SNAPSHOT.jar:?]
    at org.bukkit.plugin.SimplePluginManager.loadPlugins(SimplePluginManager.java:158) ~[paper-api-1.18.1-R0.1-SNAPSHOT.jar:?]
    at org.bukkit.craftbukkit.v1_18_R1.CraftServer.loadPlugins(CraftServer.java:421) ~[paper-1.18.1.jar:git-Paper-75]
    at net.minecraft.server.dedicated.DedicatedServer.initServer(DedicatedServer.java:285) ~[paper-1.18.1.jar:git-Paper-75]
    at net.minecraft.server.MinecraftServer.runServer(MinecraftServer.java:1202) ~[paper-1.18.1.jar:git-Paper-75]
    at net.minecraft.server.MinecraftServer.lambda$spin$0(MinecraftServer.java:317) ~[paper-1.18.1.jar:git-Paper-75]
    at java.lang.Thread.run(Thread.java:833) ~[?:?]
Caused by: java.io.FileNotFoundException: Jar does not contain plugin.yml
    ... 7 more```

Separate Hosted

Is there an option that allows me to host the server and the plugin just send data to the main server?

Hourly & Daily Stats Issue

Hi there.

I recently installed this plugin on my Flamecord Server.
Upon setting up the dashboard I noticed that hourly and daily statistic boards aren't showing the correct data.
image

Could this be to-do with the events being different on Flamecord?

CVE-2023-36478 (High) detected in jetty-http-11.0.15.jar

CVE-2023-36478 - High Severity Vulnerability

Vulnerable Library - jetty-http-11.0.15.jar

Library home page: https://eclipse.org/jetty

Path to dependency file: /pom.xml

Path to vulnerable library: /home/wss-scanner/.m2/repository/org/eclipse/jetty/jetty-http/11.0.15/jetty-http-11.0.15.jar

Dependency Hierarchy:

  • jetty-server-11.0.15.jar (Root Library)
    • โŒ jetty-http-11.0.15.jar (Vulnerable Library)

Found in base branch: main

Vulnerability Details

Eclipse Jetty provides a web server and servlet container. In versions 11.0.0 through 11.0.15, 10.0.0 through 10.0.15, and 9.0.0 through 9.4.52, an integer overflow in MetaDataBuilder.checkSize allows for HTTP/2 HPACK header values to
exceed their size limit. MetaDataBuilder.java determines if a header name or value exceeds the size limit, and throws an exception if the limit is exceeded. However, when length is very large and huffman is true, the multiplication by 4 in line 295
will overflow, and length will become negative. (_size+length) will now be negative, and the check on line 296 will not be triggered. Furthermore, MetaDataBuilder.checkSize allows for user-entered HPACK header value sizes to be negative, potentially leading to a very large buffer allocation later on when the user-entered size is multiplied by 2. This means that if a user provides a negative length value (or, more precisely, a length value which, when multiplied by the 4/3 fudge factor, is negative), and this length value is a very large positive number when multiplied by 2, then the user can cause a very large buffer to be allocated on the server. Users of HTTP/2 can be impacted by a remote denial of service attack. The issue has been fixed in versions 11.0.16, 10.0.16, and 9.4.53. There are no known workarounds.

Publish Date: 2023-10-10

URL: CVE-2023-36478

CVSS 3 Score Details (7.5)

Base Score Metrics:

  • Exploitability Metrics:
    • Attack Vector: Network
    • Attack Complexity: Low
    • Privileges Required: None
    • User Interaction: None
    • Scope: Unchanged
  • Impact Metrics:
    • Confidentiality Impact: None
    • Integrity Impact: None
    • Availability Impact: High

For more information on CVSS3 Scores, click here.

Suggested Fix

Type: Upgrade version

Origin: GHSA-wgh7-54f2-x98r

Release Date: 2023-10-10

Fix Resolution (org.eclipse.jetty:jetty-http): 11.0.16

Direct dependency fix Resolution (org.eclipse.jetty:jetty-server): 11.0.16


Step up your Open Source Security Game with Mend here

CVE-2023-51074 (Medium) detected in json-path-2.7.0.jar

CVE-2023-51074 - Medium Severity Vulnerability

Vulnerable Library - json-path-2.7.0.jar

Java port of Stefan Goessner JsonPath.

Library home page: https://github.com/

Path to dependency file: /pom.xml

Path to vulnerable library: /home/wss-scanner/.m2/repository/com/jayway/jsonpath/json-path/2.7.0/json-path-2.7.0.jar

Dependency Hierarchy:

  • โŒ json-path-2.7.0.jar (Vulnerable Library)

Found in base branch: main

Vulnerability Details

json-path v2.8.0 was discovered to contain a stack overflow via the Criteria.parse() method.

Publish Date: 2023-12-27

URL: CVE-2023-51074

CVSS 3 Score Details (5.3)

Base Score Metrics:

  • Exploitability Metrics:
    • Attack Vector: Network
    • Attack Complexity: Low
    • Privileges Required: None
    • User Interaction: None
    • Scope: Unchanged
  • Impact Metrics:
    • Confidentiality Impact: None
    • Integrity Impact: None
    • Availability Impact: Low

For more information on CVSS3 Scores, click here.

Suggested Fix

Type: Upgrade version

Origin: https://www.cve.org/CVERecord?id=CVE-2023-51074

Release Date: 2023-12-27

Fix Resolution: 2.9.0


Step up your Open Source Security Game with Mend here

Help on setting up

Hello there, so I was wondering if I can setup the metrics on my server (which is hosted somewhere and limited to ports and server files), and setup the dashboard on a vos.

CVE-2023-40167 (Medium) detected in jetty-http-11.0.15.jar

CVE-2023-40167 - Medium Severity Vulnerability

Vulnerable Library - jetty-http-11.0.15.jar

Library home page: https://eclipse.org/jetty

Path to dependency file: /pom.xml

Path to vulnerable library: /home/wss-scanner/.m2/repository/org/eclipse/jetty/jetty-http/11.0.15/jetty-http-11.0.15.jar

Dependency Hierarchy:

  • jetty-server-11.0.15.jar (Root Library)
    • โŒ jetty-http-11.0.15.jar (Vulnerable Library)

Found in HEAD commit: 78bbb9ec8352b946e6c79f8f3a2384d85638e17c

Found in base branch: main

Vulnerability Details

Jetty is a Java based web server and servlet engine. Prior to versions 9.4.52, 10.0.16, 11.0.16, and 12.0.1, Jetty accepts the + character proceeding the content-length value in a HTTP/1 header field. This is more permissive than allowed by the RFC and other servers routinely reject such requests with 400 responses. There is no known exploit scenario, but it is conceivable that request smuggling could result if jetty is used in combination with a server that does not close the connection after sending such a 400 response. Versions 9.4.52, 10.0.16, 11.0.16, and 12.0.1 contain a patch for this issue. There is no workaround as there is no known exploit scenario.

Publish Date: 2023-09-15

URL: CVE-2023-40167

CVSS 3 Score Details (5.3)

Base Score Metrics:

  • Exploitability Metrics:
    • Attack Vector: Network
    • Attack Complexity: Low
    • Privileges Required: None
    • User Interaction: None
    • Scope: Unchanged
  • Impact Metrics:
    • Confidentiality Impact: None
    • Integrity Impact: Low
    • Availability Impact: None

For more information on CVSS3 Scores, click here.

Suggested Fix

Type: Upgrade version

Origin: GHSA-hmr7-m48g-48f6

Release Date: 2023-09-15

Fix Resolution (org.eclipse.jetty:jetty-http): 11.0.16

Direct dependency fix Resolution (org.eclipse.jetty:jetty-server): 11.0.16


Step up your Open Source Security Game with Mend here

Missing bungeecord-prometheus-exporter.jar file

After digging around I managed to find a file called "bungeecord-prometheus-exporter-main.zip".
I downloaded this and placed it into the plugin directory.
First Question, I am not clear if this plugin can work aside the referring plugin called "minecraft-prometheus-exporter-master.zip" I already have this dashboard up and running. I did not think that it would be any different because it seemed to deliver some different data.
The full error is below.

[08:58:11] [Server thread/ERROR]: Could not load 'plugins/bungeecord-prometheus-exporter-3.1.0.jar' in folder 'plugins'
org.bukkit.plugin.InvalidDescriptionException: Invalid plugin.yml
at org.bukkit.plugin.java.JavaPluginLoader.getPluginDescription(JavaPluginLoader.java:170) ~[spigot-api-1.19-R0.1-SNAPSHOT.jar:?]
at org.bukkit.plugin.SimplePluginManager.loadPlugins(SimplePluginManager.java:143) ~[spigot-api-1.19-R0.1-SNAPSHOT.jar:?]
at org.bukkit.craftbukkit.v1_19_R1.CraftServer.loadPlugins(CraftServer.java:409) ~[spigot-1.19-R0.1-SNAPSHOT.jar:3539-Spigot-56be6a8-82f7574]
at net.minecraft.server.dedicated.DedicatedServer.e(DedicatedServer.java:224) ~[spigot-1.19-R0.1-SNAPSHOT.jar:3539-Spigot-56be6a8-82f7574]
at net.minecraft.server.MinecraftServer.v(MinecraftServer.java:966) ~[spigot-1.19-R0.1-SNAPSHOT.jar:3539-Spigot-56be6a8-82f7574]
at net.minecraft.server.MinecraftServer.lambda$0(MinecraftServer.java:291) ~[spigot-1.19-R0.1-SNAPSHOT.jar:3539-Spigot-56be6a8-82f7574]
at java.lang.Thread.run(Thread.java:833) [?:?]
Caused by: java.io.FileNotFoundException: Jar does not contain plugin.yml
... 7 more

First question can the two plugins live side by side?
If the answer is yes, where can I get the plugin.yml file for the bungeecord plugin?

Thanks
Lawrence

Error collecting metrics when RedisBungee is not installed

When RedisBungee is not installed i get this when getting /metrics

java.lang.NoClassDefFoundError: com/imaginarycode/minecraft/redisbungee/RedisBungeeAPI
	at org.akadia.prometheus.bungeecord.metrics.RedisBungeeOnlinePlayer.doCollect(RedisBungeeOnlinePlayer.java:16) ~[?:?]
	at org.akadia.prometheus.interfaces.Metric.collect(Metric.java:22) ~[?:?]
	at java.util.ArrayList.forEach(ArrayList.java:1511) ~[?:?]
	at org.akadia.prometheus.MetricRegistry.collectMetrics(MetricRegistry.java:26) ~[?:?]
	at org.akadia.prometheus.MetricsServer$1.handle(MetricsServer.java:43) ~[?:?]
	...

redis things are disabled in the config

WS-2021-0419 (High) detected in gson-2.8.6.jar

WS-2021-0419 - High Severity Vulnerability

Vulnerable Library - gson-2.8.6.jar

Gson JSON library

Library home page: https://github.com/google/gson

Path to dependency file: bungeecord-prometheus-exporter/pom.xml

Path to vulnerable library: e/code/gson/gson/2.8.6/gson-2.8.6.jar

Dependency Hierarchy:

  • โŒ gson-2.8.6.jar (Vulnerable Library)

Found in HEAD commit: 8d7578e5a2906703e969da623dd9cccd834f3608

Found in base branch: main

Vulnerability Details

Denial of Service vulnerability was discovered in gson before 2.8.9 via the writeReplace() method.

Publish Date: 2021-10-11

URL: WS-2021-0419

CVSS 3 Score Details (7.7)

Base Score Metrics:

  • Exploitability Metrics:
    • Attack Vector: Network
    • Attack Complexity: High
    • Privileges Required: None
    • User Interaction: None
    • Scope: Unchanged
  • Impact Metrics:
    • Confidentiality Impact: Low
    • Integrity Impact: High
    • Availability Impact: High

For more information on CVSS3 Scores, click here.

Suggested Fix

Type: Upgrade version

Origin: https://github.com/google/gson/releases/tag/gson-parent-2.8.9

Release Date: 2021-10-11

Fix Resolution: com.google.code.gson:gson:2.8.9


Step up your Open Source Security Game with WhiteSource here

Listening host not respected with Velocity

Hi there,

thank you for your work, the plugin is great, I used to deploy it with Waterfall with great results. I recently switched to Velocity and I'm facing now an issue with the listening host.

Typically the plugin is listening on 127.0.0.1 independently of the host defined in the config.json. My Prometheus server is running on a different host and I need to expose the exporter to an external IP.

Note that I didn't face this issue with Waterfall. Is there anything I can do on my side to fix this (except moving back to Waterfall)? Also do you need anything particular to diagnose the issue?

Thank you, regards,
Maurice

CVE-2021-27568 (High) detected in json-smart-2.3.jar - autoclosed

CVE-2021-27568 - High Severity Vulnerability

Vulnerable Library - json-smart-2.3.jar

JSON (JavaScript Object Notation) is a lightweight data-interchange format. It is easy for humans to read and write. It is easy for machines to parse and generate. It is based on a subset of the JavaScript Programming Language, Standard ECMA-262 3rd Edition - December 1999. JSON is a text format that is completely language independent but uses conventions that are familiar to programmers of the C-family of languages, including C, C++, C#, Java, JavaScript, Perl, Python, and many others. These properties make JSON an ideal data-interchange language.

Library home page: http://www.minidev.net/

Path to dependency file: bungeecord-prometheus-exporter/pom.xml

Path to vulnerable library: /home/wss-scanner/.m2/repository/net/minidev/json-smart/2.3/json-smart-2.3.jar

Dependency Hierarchy:

  • json-path-2.5.0.jar (Root Library)
    • โŒ json-smart-2.3.jar (Vulnerable Library)

Found in HEAD commit: 95123c278f15048d7c8882dc68571af1b326aab0

Found in base branch: main

Vulnerability Details

An issue was discovered in netplex json-smart-v1 through 2015-10-23 and json-smart-v2 through 2.4. An exception is thrown from a function, but it is not caught, as demonstrated by NumberFormatException. When it is not caught, it may cause programs using the library to crash or expose sensitive information.

Publish Date: 2021-02-23

URL: CVE-2021-27568

CVSS 3 Score Details (9.1)

Base Score Metrics:

  • Exploitability Metrics:
    • Attack Vector: Network
    • Attack Complexity: Low
    • Privileges Required: None
    • User Interaction: None
    • Scope: Unchanged
  • Impact Metrics:
    • Confidentiality Impact: High
    • Integrity Impact: None
    • Availability Impact: High

For more information on CVSS3 Scores, click here.

Suggested Fix

Type: Upgrade version

Origin: netplex/json-smart-v1#7

Release Date: 2021-02-23

Fix Resolution: net.minidev:json-smart-mini:1.3.2, net.minidev:json-smart:1.3.2, 2.4.2, net.minidev:json-smart-action:2.4.2


Step up your Open Source Security Game with WhiteSource here

Very unclear what to do- Using vps

Hello! I was watching the tutorial and it is just not suited for if you are using a vps with docker. ip is 0.0.0.0 but i can not access the data because there is no way to smh. Then with this scrape and job thing i just cant get it?

NoClassDefFoundError: RedisBungeeAPI

I am using the latest BungeeCord and bungeecord-prometheus-exporter version and I do have all redis bungee related settings disabled.

  "redis_player_connects": "false",
  "redis_player_disconnects": "false",
  "redis_online_players": "false",
  "redis_bungee_online_proxies": "false"
14:12:36 [INFO] [BungeeCordPrometheusExporter] redis_player_connects is disabled in the config
14:12:36 [INFO] [BungeeCordPrometheusExporter] redis_player_disconnects is disabled in the config
14:12:36 [INFO] [BungeeCordPrometheusExporter] redis_online_player is enabled in the config
14:12:36 [INFO] [BungeeCordPrometheusExporter] redis_bungee_online_proxies is disabled in the config

But I get the following error every 5 seconds:

14:17:00 [WARNING] /metrics
java.lang.NoClassDefFoundError: com/imaginarycode/minecraft/redisbungee/RedisBungeeAPI
	at org.akadia.prometheus.bungeecord.metrics.RedisBungeeOnlinePlayer.doCollect(RedisBungeeOnlinePlayer.java:16)
	at org.akadia.prometheus.interfaces.Metric.collect(Metric.java:22)
	at org.akadia.prometheus.MetricRegistry$$Lambda$809/0x000000005407f658.accept(Unknown Source)
	at java.base/java.util.ArrayList.forEach(ArrayList.java:1511)
	at org.akadia.prometheus.MetricRegistry.collectMetrics(MetricRegistry.java:26)
	at org.akadia.prometheus.MetricsServer$1.handle(MetricsServer.java:43)
	at org.eclipse.jetty.server.handler.HandlerWrapper.handle(HandlerWrapper.java:122)
	at org.eclipse.jetty.server.handler.gzip.GzipHandler.handle(GzipHandler.java:822)
	at org.eclipse.jetty.server.handler.HandlerWrapper.handle(HandlerWrapper.java:122)
	at org.eclipse.jetty.server.Server.handle(Server.java:563)
	at org.eclipse.jetty.server.HttpChannel.lambda$handle$0(HttpChannel.java:505)
	at org.eclipse.jetty.server.HttpChannel$$Lambda$808/0x000000005407ead0.dispatch(Unknown Source)
	at org.eclipse.jetty.server.HttpChannel.dispatch(HttpChannel.java:762)
	at org.eclipse.jetty.server.HttpChannel.handle(HttpChannel.java:497)
	at org.eclipse.jetty.server.HttpConnection.onFillable(HttpConnection.java:282)
	at org.eclipse.jetty.io.AbstractConnection$ReadCallback.succeeded(AbstractConnection.java:314)
	at org.eclipse.jetty.io.FillInterest.fillable(FillInterest.java:100)
	at org.eclipse.jetty.io.SelectableChannelEndPoint$1.run(SelectableChannelEndPoint.java:53)
	at org.eclipse.jetty.util.thread.strategy.AdaptiveExecutionStrategy.runTask(AdaptiveExecutionStrategy.java:416)
	at org.eclipse.jetty.util.thread.strategy.AdaptiveExecutionStrategy.consumeTask(AdaptiveExecutionStrategy.java:385)
	at org.eclipse.jetty.util.thread.strategy.AdaptiveExecutionStrategy.tryProduce(AdaptiveExecutionStrategy.java:272)
	at org.eclipse.jetty.util.thread.strategy.AdaptiveExecutionStrategy.produce(AdaptiveExecutionStrategy.java:194)
	at org.eclipse.jetty.io.ManagedSelector$$Lambda$795/0x00000000b1088368.run(Unknown Source)
	at org.eclipse.jetty.util.thread.QueuedThreadPool.runJob(QueuedThreadPool.java:934)
	at org.eclipse.jetty.util.thread.QueuedThreadPool$Runner.run(QueuedThreadPool.java:1078)
	at java.base/java.lang.Thread.run(Thread.java:853)

Requires RedisBungee to even work?

To get the plugin to load on my BungeeCord I had to edit the config.yml to manually disable the supposed "RedisBungee" checks.

However, importing the dashboard to Grafana appears to just make a dashboard with random placeholder like information, and the proxy (BungeeCord) isn't even detected itself. Its running on the default 9225 as shown in this start-up guide, with the correct allocation and assignment, I can go to serverIP:port/metrics and that resolves - the dashboard in Grafana does not.

I can't open x.x.x.x/metrics

11:44:50 [WARNING] FAILED Server@6f2cb653{FAILED}[11.0.7,sto=0]: java.io.IOException: Failed to bind to x.x.x.x/x.x.x.x:25589
java.io.IOException: Failed to bind to x.x.x.x/x.x.x.x:25589
at org.eclipse.jetty.server.ServerConnector.openAcceptChannel(ServerConnector.java:345)
at org.eclipse.jetty.server.ServerConnector.open(ServerConnector.java:305)
at org.eclipse.jetty.server.Server.lambda$doStart$0(Server.java:401)
at java.base/java.util.stream.ForEachOps$ForEachOp$OfRef.accept(ForEachOps.java:183)
at java.base/java.util.stream.ReferencePipeline$3$1.accept(ReferencePipeline.java:197)
at java.base/java.util.stream.ReferencePipeline$2$1.accept(ReferencePipeline.java:179)
at java.base/java.util.Spliterators$ArraySpliterator.forEachRemaining(Spliterators.java:992)
at java.base/java.util.stream.AbstractPipeline.copyInto(AbstractPipeline.java:509)
at java.base/java.util.stream.AbstractPipeline.wrapAndCopyInto(AbstractPipeline.java:499)
at java.base/java.util.stream.ForEachOps$ForEachOp.evaluateSequential(ForEachOps.java:150)
at java.base/java.util.stream.ForEachOps$ForEachOp$OfRef.evaluateSequential(ForEachOps.java:173)
at java.base/java.util.stream.AbstractPipeline.evaluate(AbstractPipeline.java:234)
at java.base/java.util.stream.ReferencePipeline.forEach(ReferencePipeline.java:596)
at org.eclipse.jetty.server.Server.doStart(Server.java:397)
at org.eclipse.jetty.util.component.AbstractLifeCycle.start(AbstractLifeCycle.java:93)
at org.akadia.prometheus.MetricsServer.start(MetricsServer.java:60)
at org.akadia.prometheus.bungeecord.PrometheusBungeeCordExporter.startMetricsServer(PrometheusBungeeCordExporter.java:90)
at org.akadia.prometheus.bungeecord.PrometheusBungeeCordExporter.onEnable(PrometheusBungeeCordExporter.java:39)
at net.md_5.bungee.api.plugin.PluginManager.enablePlugins(PluginManager.java:265)
at net.md_5.bungee.BungeeCord.start(BungeeCord.java:285)
at net.md_5.bungee.BungeeCordLauncher.main(BungeeCordLauncher.java:67)
at net.md_5.bungee.Bootstrap.main(Bootstrap.java:15)
Caused by: java.net.BindException: Cannot assign requested address
at java.base/sun.nio.ch.Net.bind0(Native Method)
at java.base/sun.nio.ch.Net.bind(Net.java:555)
at java.base/sun.nio.ch.ServerSocketChannelImpl.netBind(ServerSocketChannelImpl.java:337)
at java.base/sun.nio.ch.ServerSocketChannelImpl.bind(ServerSocketChannelImpl.java:294)
at org.eclipse.jetty.server.ServerConnector.openAcceptChannel(ServerConnector.java:340)
... 21 more

I've opened the port

help

Where is prometheus.yml?

No data in dashboard

Every time I refresh the dashboard the data is different and incorrect. I imported the latest version of the dashboard
image

Prometheus is working:
image

And the correct datasource is added:
image

I also have the latest version of the plugin enabled:
image

Importing dashboard goes wrong?

Hey, every time i try to import the dashboard in grafana, i get this following error:

image

Do you guys know what this is and how i can fix it?

Recommend Projects

  • React photo React

    A declarative, efficient, and flexible JavaScript library for building user interfaces.

  • Vue.js photo Vue.js

    ๐Ÿ–– Vue.js is a progressive, incrementally-adoptable JavaScript framework for building UI on the web.

  • Typescript photo Typescript

    TypeScript is a superset of JavaScript that compiles to clean JavaScript output.

  • TensorFlow photo TensorFlow

    An Open Source Machine Learning Framework for Everyone

  • Django photo Django

    The Web framework for perfectionists with deadlines.

  • D3 photo D3

    Bring data to life with SVG, Canvas and HTML. ๐Ÿ“Š๐Ÿ“ˆ๐ŸŽ‰

Recommend Topics

  • javascript

    JavaScript (JS) is a lightweight interpreted programming language with first-class functions.

  • web

    Some thing interesting about web. New door for the world.

  • server

    A server is a program made to process requests and deliver data to clients.

  • Machine learning

    Machine learning is a way of modeling and interpreting data that allows a piece of software to respond intelligently.

  • Game

    Some thing interesting about game, make everyone happy.

Recommend Org

  • Facebook photo Facebook

    We are working to build community through open source technology. NB: members must have two-factor auth.

  • Microsoft photo Microsoft

    Open source projects and samples from Microsoft.

  • Google photo Google

    Google โค๏ธ Open Source for everyone.

  • D3 photo D3

    Data-Driven Documents codes.