- dataShark
- Getting Started
- Structure of dataShark
- Writing your own use cases using dataShark
- Output Plugins
- Input Plugins
- Uninstall dataShark
- Changelog
- Contacts
- License
- Authors
dataShark is a Security & Network Event Analytics Framework built on Apache Spark that enables security researchers, big data analysts and operations teams to carry out the below tasks with minimal effort:
- Data ingest from various sources such as file system, Syslog, Kafka.
- Write custom map / reduce and ML algorithms that operate on ingested data using abstracted Apache Spark functionality.
- The output of the above operations can be sent to destinations such as syslog, elasticsearch and can also be persisted in the file system or HDFS.
dataShark has the following two operation modes:
- Standalone executable: allows one-shot analysis of static data (input can be file system or HDFS and output can be any of the available output plugins - Syslog, Elasticsearch, file system, HDFS).
- Production: full-fledged production deployment with all components (refer next section) that can ingest data from the mentioned sources.
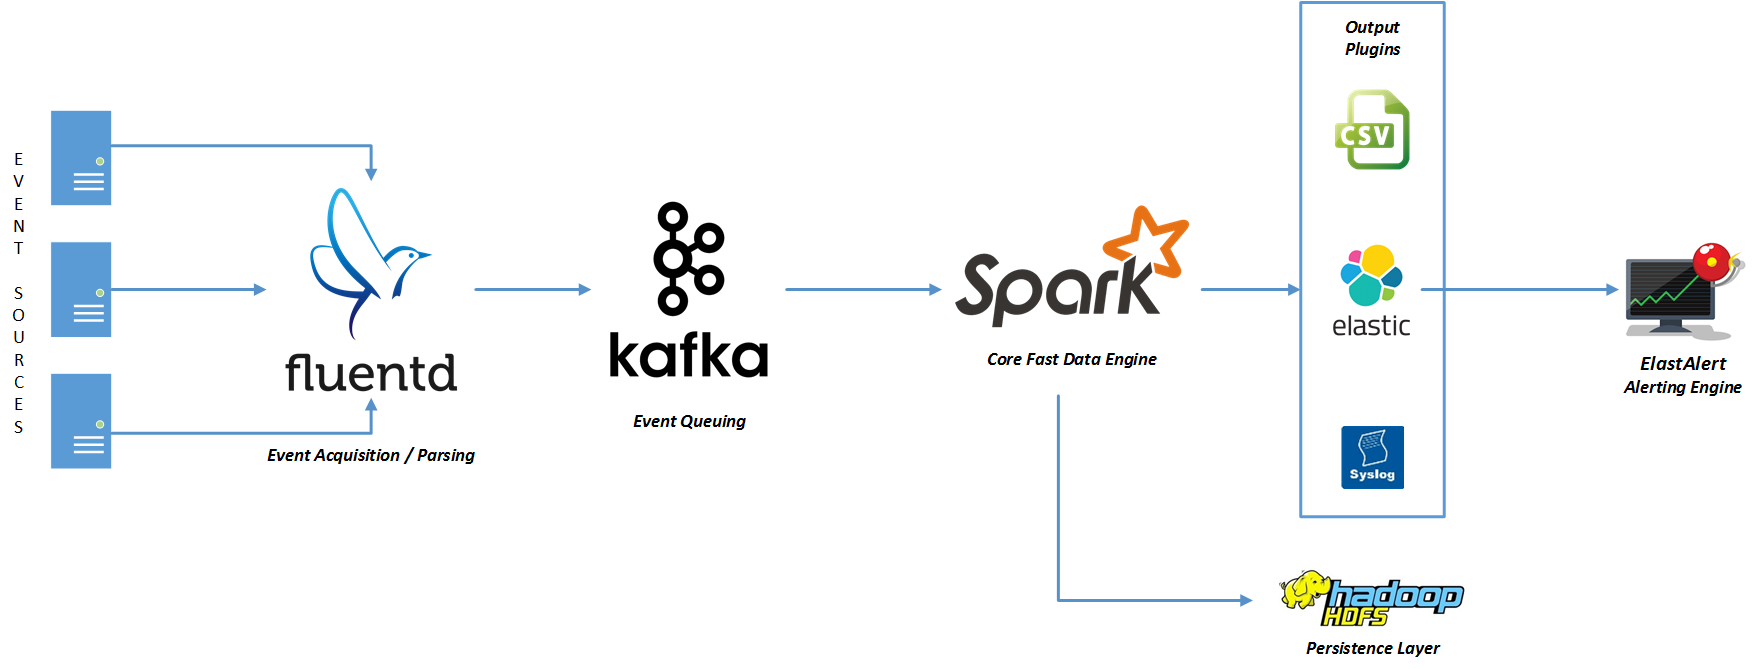
We recommend the following components while running dataShark in production:
- Event Acquisition: this layer leverages Fluentd for processing events via syslog, parsing them as per user-defined grok patterns and forwarding the same to Kafka for queuing.
- Event Queuing: this layer uses Kafka to queue events for Spark to process. Often useful when the input EPS is high and the Spark layer has a delay in processing.
- Core Data Engine: this is the core dataShark framework built on Spark. A user can deploy custom map / reduce or ML use cases and submit the output via any available output plugin.
- Persistence Layer: elasticsearch and HDFS are leveraged to persist output and lookup data as required.
- Alerting Engine: this uses ElastAlert to monitor output data and configure custom rules / thresholds to generate alerts.
- Output Plugins: these are used by the Core Data Engine to persist or send its output to various destinations such as CSV, Syslog or Elasticsearch.
Note: 1, 2, 4 and 5 are purely basis our experience with the production setup. One is free to use any available alternative.
Input Data Sources:
- File system: static files to carry out one-time analysis or to train data models for ML.
- Kafka: stream data that is ingested using Spark stream processing capabilities.
Output plugins:
- CSV (File system or HDFS): persist output data in CSV file format on the file system or HDFS.
- Syslog: send output data to a remote syslog server.
- Elasticsearch: persist output data in elasticsearch.
Sample use cases / implementations:
- Detecting bots or anomalous server behavior using K-means classification and anomaly detection techniques.
- Generating a summary of websites accessed using map / reduce on web proxy logs.
- Generating a summary of web and network traffic using map / reduce on Apache HTTPD and firewall logs.
This section describes how to get started with dataShark. Before you can actually run dataShark, there are some prerequisites that need to be installed.
dataShark can run in 2 modes:
- Standalone Mode
- Production Mode
Following are the requirements for Standlone Mode Setup:
- pySpark
- Python Dependencies
Following are the requirements for Production Mode Setup:
- pySpark
- Python Dependencies
- Kafka
- Hadoop
- Fluent
Setting up dataShark to run in Standalone Mode is as easy as running the installer script. We now have the install.sh script that installs all required dependencies for dataShark Standalone Mode (to run the included wordcount use case). Following components get installed using the install.sh script:
- Spark 1.6.2
- Java 8u112
- Scala 2.11.8
- System Modules: git, gcc, Python Development Files, Python Setuptools
- Python Dependecies: py4j, configobj, argparse, numpy
To run the install script, just execute the following command inside the cloned dataShark directory:
./install.sh
The install script, by default, installs all components to the directory /etc/datashark, but this can be overridden by providing the prefix flag like so: ./install.sh --prefix=/opt will install to /opt/datashark.
We wanted dataShark to be available as a ready-to-go package. Therefore, we also have a Docker Image with all dependencies and dataShark pre-installed on a base CentOS 6.8 to run the wordcount use case. The following commands can be used to pull dataShark Image from Docker Hub and drop into the image's shell:
docker pull makemytrip/datashark
docker run -i -t makemytrip/datashark /bin/bash
That's it! You're now inside the CentOS shell. dataShark is installed in /etc/datashark.
- pySpark is the brains of dataShark. We recommend installing Spark with Oracle's Java >= 1.8.0. Use the following link to setup up pySpark: https://github.com/KristianHolsheimer/pyspark-setup-guide. This document provides the easiest method of setting up Spark with pySpark.
- [Optional] Setting up Spark Cluster: Although it is highly recommended for better performance to setup Spark Cluster, this step is completely optional basis infrastructure availability. Following link provides steps to setup a basic Spark Cluster: http://blog.insightdatalabs.com/spark-cluster-step-by-step/.
- Note: It is required to set the SPARK_HOME environment variable. Make sure you set it as mentioned in the install guide mentioned above.
- Python Dependencies are needed to be installed to run dataShark. To install the required dependencies, run the following command:
pip install configobj argparse - Kafka provides the high throughput message queue functionality which gets loaded to dataShark as a continuous stream for analysis. Kafka can be setup either with multiple brokers across multiple nodes or on a single node with multiple brokers, the basic setup steps are fairly the same for both methods. Following link can be used to setup multiple brokers on a single node: http://www.michael-noll.com/blog/2013/03/13/running-a-multi-broker-apache-kafka-cluster-on-a-single-node/.
- Hadoop is the resilient storage for spark that's used for checkpointing and also as a driver for starting up dataShark with all dependencies. Following link provides steps to setup a multi-node Hadoop Cluster: http://www.michael-noll.com/tutorials/running-hadoop-on-ubuntu-linux-multi-node-cluster/.
- Fluentd is the data aggregator that collects logs from multiple sources and sends them to Kafka for consumption. Setting up fluentd is pretty easy. Fluentd's website provides steps for installation for all platforms. The Installation document can be found here: http://docs.fluentd.org/v0.12/categories/installation.
dataShark has a standalone mode for testing out use cases before plugging them in. The basic requirement to get dataShark running in standalone mode is having Apache Spark installed on the system hosting dataShark.
Once we have all these prerequisites setup, to run dataShark in Standalone Mode you first need to clone this git repository:
git clone https://github.com/makemytrip/dataShark.git
After cloning, executing a use case in standalone mode is as easy as running the following command:
./standalone.sh conf/wordcount/wordcount.conf
Following is the sample output for a sample Standalone Mode run:
               __      __        _____ __               __
          ____/ /___ _/ /_____ _/ ___// /_  ____ ______/ /__
         / __  / __ `/ __/ __ `/\__ \/ __ \/ __ `/ ___/ //_/
        / /_/ / /_/ / /_/ /_/ /___/ / / / / /_/ / /  / ,<
        \__,_/\__,_/\__/\__,_//____/_/ /_/\__,_/_/  /_/|_|

                          STANDALONE MODE

                              v1.2.1


Loaded Confs: ['conf/wordcount/wordcount.conf']
2016-10-14 13:01:39 - (Word Count) - Written 1384 Documents to CSV File /tmp/usecase1.csv
The Standalone Mode now also provides a debugging feature, where the output is not passed to the output plugin, rather printed out on the console using collect() for batch mode use cases and pprint() for streaming use cases. This can help in quickly debugging a use case than having to use the output plugin. The debug mode can be turned on using the -d flag and passing the conf file as given below:
./standalone.sh -d conf/wordcount/wordcount.conf
Following is the sample output for a sample Standalone Mode run in debugging mode:
               __      __        _____ __               __
          ____/ /___ _/ /_____ _/ ___// /_  ____ ______/ /__
         / __  / __ `/ __/ __ `/\__ \/ __ \/ __ `/ ___/ //_/
        / /_/ / /_/ / /_/ /_/ /___/ / / / / /_/ / /  / ,<
        \__,_/\__,_/\__/\__,_//____/_/ /_/\__,_/_/  /_/|_|

                          STANDALONE MODE

                              v1.2.1


[*] Debug Mode is ON
Loaded Confs: ['conf/wordcount/wordcount.conf']
[(u'all', 20), (u'moreover,', 1), (u'"recipients"', 1), (u'(if', 3), (u'party.', 1), (u'procuring', 1), (u'provided,', 1), (u'methods,', 1), (u'versions.', 2), (u'presents', 1), (u'violation', 5), (u'charge', 5), (u'permanently', 3), (u'those', 14)
...
Once we have all these prerequisites setup, to run dataShark in Production Mode you first need to clone this git repository:
git clone https://github.com/makemytrip/dataShark.git
Then we need to change the datashark.conf to specify the Zookeeper Host, Kafka Topic Name and HDFS Host Information. An example of sample configuration is given below:
zookeeper.host = 127.0.0.1
zookeeper.port = 2181

kafka.consumer.name = consumer-datashark
kafka.queue.name = logs_queue
kafka.partitions = 1

hdfs.host = 127.0.0.1
hdfs.port = 9000

[spark_config]
spark.logConf                           = true
spark.kryo.referenceTracking            = false
spark.serializer                        = org.apache.spark.serializer.KryoSerializer
spark.scheduler.mode                    = FAIR
[spark_conf] section is an optional section that can be used to pass spark conf for tuning the spark job. This applies both to standalone and production mode.
Then we need to specify the Spark Master in datashark-env.sh:
SPARK_INSTANCE=spark://127.0.0.1:7077
This is all that is needed to install and configure datashark. To start the spark engine and use cases, we can simply run the command:
./start.sh
On the first run, we only have the Word Count Use Case enabled that will be run. Following is the sample output of the first run:
               __      __        _____ __               __
          ____/ /___ _/ /_____ _/ ___// /_  ____ ______/ /__
         / __  / __ `/ __/ __ `/\__ \/ __ \/ __ `/ ___/ //_/
        / /_/ / /_/ / /_/ /_/ /___/ / / / / /_/ / /  / ,<
        \__,_/\__,_/\__/\__,_//____/_/ /_/\__,_/_/  /_/|_|

                          PRODUCTION MODE

                              v1.2.1


[*] 2016-10-12 14:59:06 Running Spark on Cluster
[*] 2016-10-12 14:59:06 Preparing FileSystem
[*] 2016-10-12 14:59:12 Starting Spark
Loaded Confs: ['/opt/dataShark/conf/wordcount/wordcount.conf']
2016-10-12 14:59:21 - (Word Count) - Written 1384 Documents to CSV File /tmp/usecase1.csv
 * Skip Stream Processing
[*] 2016-10-12 14:59:23 Cleaning Up
This section describes the structure of directories and files.
Following is the basic directory structure of dataShark after deployment.
dataShark/
├── conf
│   ├── __init__.py
│   ├── web-anomaly-detection
│   │   ├── kibana_dashboard.json
│   │   ├── kibana_visualizations.json
│   │   ├── README.md
│   │   ├── test_access_log
│   │   ├── web-anomaly-detection.conf
│   │   └── web-anomaly-detection.py
│   └── wordcount
│       ├── __init__.py
│       ├── wordcount.conf
│       ├── wordcount.py
│       └── wordcount.txt
├── datashark.conf
├── datashark.py
├── datashark_standalone.py
├── datashark-env.sh
├── install.sh
├── lib
│   ├── elasticsearch-hadoop-5.2.0.jar
│   └── spark-streaming-kafka-assembly-1.6.1.jar
├── plugins
│   ├── __init__.py
│   └── output
│       ├── __init__.py
│       ├── out_csv.py
│       ├── out_elasticsearch.py
│       └── out_syslog.py
├── start.sh
└── standalone.sh
Files and directories have been explained below:
The heart of dataShark, this is where the magic happens. When using dataShark, you will never have to change the contents of this file.
The main configuration file which specifies the Kafka Queue to be consumed for Streaming Use Cases and Spark specific configuration.
The shell file that is used to start up spark with all its dependencies and use cases.
This file is used for testing individual use cases before integrating them as plugins to dataShark.
This file gets loaded before execution of any Use Cases. Here you may place any required environment variables to be used by dataShark. One important variable to be set in this file is the SPARK_INSTANCE variable, that sets the spark master Host and Port.
The Installer Script for installing requirements required to run dataShark in Standalone Mode to execute the included wordcount use case.
This script is the helper for datashark_standalone.py. This loads all environment variables for executing a Use Case. You can write an use case as usual and execute it using the command, ./standalone.sh conf/use_case_dir/sample_use_case.conf to just execute that use case. This file ignores the enabled flag in the conf, so it is advised to keep the flag set to false while doing a dry run to avoid accidental execution of the use case.
This directory is where all use cases are placed. Refer to Writing your own use cases using dataShark on how to write your own plugin use cases.
This is the sample streaming use case that can be used to identify anomalies in live web traffic. It uses a sample log file test_access_log to train the K-Means model. By default, the input stream for the use case is File and monitors the directory /opt/logs for any incoming log files. You can either provide your own log file and correspondingly change the Regex Format to match your own log format in the conf file or just use the provided sample access log file to quickly get started.
Wordcount is a sample use case provided with dataShark for trying out batch processing. The wordcount.txt file is a standard GNUv3 License file.
Any external jar dependencies that need to be included with spark for your use cases. Out of the box, we provide you 2 jars included with datashark, Spark Streaming Kafka Library and Elasticsearch Library.
All output plugins are placed in this directory. The naming convention for files in this directory is out_<plugin name>.py, example, out_csv.py. Three output plugins are provided out of the box:
- Elasticsearch
- Syslog
- CSV
This document describes how to create your own use cases using dataShark. All custom code resides in the conf folder of dataShark.
First create a folder with the use case name (all lower case characters and underscore only) in the conf folder. To write a new use case, at the bare minimum, we need 2 files in its own folder:
- The .conf file
- A code .py file
The .conf file needs to define a few necessary flags specific to the use case and the .py file needs to implement the load function.
This is what a standard .conf file looks like:
name = Use Case 1
type = streaming
code = code.py
enabled = true
training = training.log
output = elasticsearch
input = kafka
[in_kafka]
	host = 127.0.0.1
        port = 2181
        topic = logs_queue
        partitions = 1
[log_filter]
        [[include]]
                some_key = ^regex pattern$
        [[exclude]]
                some_other_key = ^regex pattern$
[out_elasticsearch]
        host = 10.0.0.1
        port = 9200
        index_name = logstash-index
        doc_type = docs
        pkey = sourceip
        score = anomaly_score
        title = Name for ES Document
        debug = false
name : Name for the Use Case.
type : This can be either of **batch** or **streaming**. When using *batch* mode, the use case is run just once on the provided data file. In *streaming* mode a Kafka Stream is passed to the code file to analyze.
enabled : Set this to either **true** or **false** to simply enable or disable this use case.
code : The .py file corresponding to this use case.
training : The log file to supply as training data to train your model. This is required only when `type = streaming`. (In batch mode, this key can be skipped)
file : The data file to use for *batch* processing. This is required only when `type = batch`. (In streaming mode, this key can be skipped)
output : The output plugin to use. Types of output plugins are listed below.
[type_of_plugin] : The settings for the output plugin being used.
input : This key is used to override the Global Kafka Stream. This can be either `kafka` or `file`.
[in_file] or [in_kafka] : This is used to specify the input conf to override the Global Kafka Stream.
[log_filter] : This is used to filter out the Kafka stream passed to your use case. It has the following two optional sub-sections:
    - [[include]] : In this sub-section each key value pair is used to filter the incoming log stream to include in the use case. The *key* is the name of the key in the JSON Document in the Kafka Stream. The *value* has to be a regex pattern that matches the content of that key.
    - [[exclude]] : In this sub-section each key value pair is used to filter the incoming log stream to exclude from the use case. The *key* is the name of the key in the JSON Document in the Kafka Stream. The *value* has to be a regex pattern that matches the content of that key.
The .py file is the brains of the system. This is where all the map-reduce. model training happens. The user needs to implement a method named load in this .py file. dataShark provides two flavors of the load function to implement, one for streaming and one for batch processing. Following is the basic definition of the load function of each type:
For batch processing:
def load(batchData)
The data file provided as input in the .conf file is loaded and passed to the function in the variable batchData. batchData is of type PythonRDD.
For stream processing:
def load(streamingData, trainingData, context, conf)
streamingData is the Kafka Stream being sent to the function load. This is of type DStream.
trainingData is the Training File loaded from the training key mention in the .conf file. It is of the type PythonRDD.
context is the spark context loaded in the driver. It may be used for using the accumulator, etc.
conf is the Use Case conf which can be used internally in the code to allow user to pass custom configuration.
The function load expects a processed DStream to be returned from it. Each RDD in the DStream should be in the following format (this format is necessary for usability in output plugins):
('primary_key', anomaly_score, {"some_metadata": "dictionary here"})
primary_key is a string. It is the tagging metric by which the data was aggregated for map-reduce and finally scored. anomaly_score is of type float. It is the value used to define the deviation from normal behavior. metadata is of the type dictionary. This is the extra data that needs to be inserted into the Elasticsearch document or added to the CSV as extra Columns.
dataShark provides the following 3 output plugins out-of-the-box for processed data persistence or transmission:
- Elasticsearch
- Syslog
- CSV
Each of these plugins requires its own basic set of settings, described below.
The Elasticsearch output plugin allows you to easily push JSON documents to your Elasticsearch Node. This allows users to build visualizations using Kibana over processed data.
Following is the basic template for configuring Elasticsearch output plugin:
output = elasticsearch
[out_elasticsearch]
        host = 127.0.0.1
        port = 9200
        index_name = usecase
        doc_type = spark-driver
        pkey = source_ip
        score = anomaly_score
        title = Use Case
        debug = false
All settings in the config are optional. Their default values are displayed in the config above.
`host` : Host IP or Hostname or the ES server.
`port` : Port Number of ES Server.
`index_name` : Name of the index to push documents to for this use case.
`doc_type` : Document Type Name for this use case.
`pkey` : Primary Key Field name to show in ES Document.
`score` : Anomaly Score Key Field Name to show in ES Document.
`title` : The value of the title field in the ES Document.
`debug` : Set this to true to display each JSON record being push to ES on the console.
The Syslog Output plugin outputs JSON documents to the specified Syslog Server IP and Port. Following is the sample configuration with default settings for the plugin (all settings are optional):
output = syslog
[out_syslog]
        host = 127.0.0.1
        port = 514
        pkey = source_ip
        score = anomaly_score
        title = Use Case Title
        debug = false
The settings are similar to that of elasticsearch.
The CSV Output Plugins writes and appends output from Spark Use Case to a specified CSV File. Following is the sample configuration with default settings of the plugin (all settings are optional):
output = csv
[out_csv]
        path = UseCase.csv
        separator = ','
        quote_char = '"'
        title = Use Case
        debug = false
dataShark allows different inputs to be used per use case. These can be used to override the Global Kafka Stream per use case. Currently, only two plugins are provided:
- Kafka
- File
Each of these plugins requires its own basic set of settings, described below.
This plugin can be used to specify a different Kafka Queue or a totally different Kafka Host to pickup the input stream from. The plugin has some mandatory configuration. A sample configuration is given below and can be modified as per need:
input = kafka
[in_kafka]
        host = 127.0.0.1
        port = 2181
        topic = logs_queue
        partitions = 1
All keys are mandatory and need to be defined.
This plugin can be used to pickup the input stream from a local folder (as suggested by Spark). The folder is monitored for any new files and loads the data from them. The plugin has some mandatory configuration. A sample configuration is given below and can be modified as per need:
input = file
[in_file]
        folder_path = /tmp/mydata
All keys are mandatory and need to be defined.
dataShark gets installed locally to /etc/datashark (default). If you had specified the prefix during install, the location might be different. An environment variable DATASHARK_HOME is set indicating the directory where dataShark resides. To uninstall dataShark, just remove the datashark directory by issuing the following command:
rm -fr $DATASHARK_HOME
Note: Please take a backup of the conf folder before executing the above command to backup any custom use cases you may have placed in dataShark.
Some environment variables were also set in the bashrc file. You may remove the lines from /etc/bashrc (for CentOS) or /etc/bash.bashrc (for Ubuntu). A typical installation adds the following lines to the bashrc file:
## ENVIRONMENT VARIABLES SET BY DATASHARK
export DATASHARK_HOME=/etc/datashark
export JAVA_HOME=/etc/datashark/java
export JRE_HOME=/etc/datashark/java/jre
export PATH=$PATH:/etc/datashark/java/bin:/etc/datashark/java/jre/bin
export PATH=$PATH:/etc/datashark/scala/bin
export PATH=$PATH:/etc/datashark/spark/bin
export SPARK_HOME=/etc/datashark/spark
export PYTHONPATH=$SPARK_HOME/python:$PYTHONPATH
## END OF VARIABLES BY DATASHARK
- Adding a Streaming Use Case (Web Anomaly Detection) to detect web anomalies in live web traffic.
- Passing the Use case Conf to its code allowing a user to use their own defined parameters inside the code.
- Display the Input Module being used on code startup.
- Adding Kibana Dashboards for visualizing Streaming use case.
- Fixing a bug where filters in multiple conf were not loaded properly.
- Adding
spark_confin datashark.conf to add spark configuration. - Making input streams cached for better performance.
- Making Spark application name dynamic.
- Making spark run use cases concurrently, previously default was used (1 concurrent job)
- Updating Elasticsearch jar to support the latest Elasticsearch Release 5.2.0
- Adding a debug feature for standalone mode to quickly display results on console.
- Adding Input plugins Kafka and File, which can be used to override the Global Kafka Stream per use case.
- Changed the naming convention used in Output Plugin conf.
- Fixing a bug where an empty output conf would cause dataShark to crash.
- Initial Release of dataShark
Discussion / Forum: https://groups.google.com/forum/#!forum/datashark For anything else: [email protected]
This program is free software: you can redistribute it and/or modify it under the terms of the GNU General Public License as published by the Free Software Foundation, either version 3 of the License, or (at your option) any later version.
This program is distributed in the hope that it will be useful, but WITHOUT ANY WARRANTY; without even the implied warranty of MERCHANTABILITY or FITNESS FOR A PARTICULAR PURPOSE. See the GNU General Public License for more details. http://www.gnu.org/licenses/.