Global change in streamflow extremes under climate change over the 21st century
Publication reference: https://www.hydrol-earth-syst-sci.net/21/5863/2017/hess-21-5863-2017.html
Main code: Disch_Extrm_Trend_ISIMIP_1971_2000_2070_2099_RCP8p5_MultiModel.m
** Historical, RCP2.6, and RCP8.2 netcdf files of daily discharge/streamflow from 25 models from the ISI-MIP project are first analyzed and high and low percentiles of flow are extracted and saved as .mat files in the "Matlab Manipulated Data" directory. The codes process files stored there. ** .mat files of discharge are not uploaded due to Github's file upload limitations.
Abstract:
Global warming is expected to intensify the Earth's hydrological cycle and increase flood and drought risks. Changes over the 21st century under two warming scenarios in different percentiles of the probability distribution of streamflow, and particularly of high and low streamflow extremes (95th and 5th percentiles), are analyzed using an ensemble of bias-corrected global climate model (GCM) fields fed into different global hydrological models (GHMs) provided by the Inter-Sectoral Impact Model Intercomparison Project (ISI-MIP) to understand the changes in streamflow distribution and simultaneous vulnerability to different types of hydrological risk in different regions. In the multi-model mean under the Representative Concentration Pathway 8.5 (RCP8.5) scenario, 37 % of global land areas experience an increase in magnitude of extremely high streamflow (with an average increase of 24.5 %), potentially increasing the chance of flooding in those regions. On the other hand, 43 % of global land areas show a decrease in the magnitude of extremely low streamflow (average decrease of 51.5 %), potentially increasing the chance of drought in those regions. About 10 % of the global land area is projected to face simultaneously increasing high extreme streamflow and decreasing low extreme streamflow, reflecting the potentially worsening hazard of both flood and drought; further, these regions tend to be highly populated parts of the globe, currently holding around 30 % of the world's population (over 2.1 billion people). In a world more than 4° warmer by the end of the 21st century compared to the pre-industrial era (RCP8.5 scenario), changes in magnitude of streamflow extremes are projected to be about twice as large as in a 2° warmer world (RCP2.6 scenario). Results also show that inter-GHM uncertainty in streamflow changes, due to representation of terrestrial hydrology, is greater than the inter-GCM uncertainty due to simulation of climate change. Under both forcing scenarios, there is high model agreement for increases in streamflow of the regions near and above the Arctic Circle, and consequent increases in the freshwater inflow to the Arctic Ocean, while subtropical arid areas experience a reduction in streamflow.
Reference: Asadieh, B. and Krakauer, N. Y.: Global change in streamflow extremes under climate change over the 21st century, Hydrol. Earth Syst. Sci., 21, 5863–5874, https://doi.org/10.5194/hess-21-5863-2017, 2017.
Materials and Methods
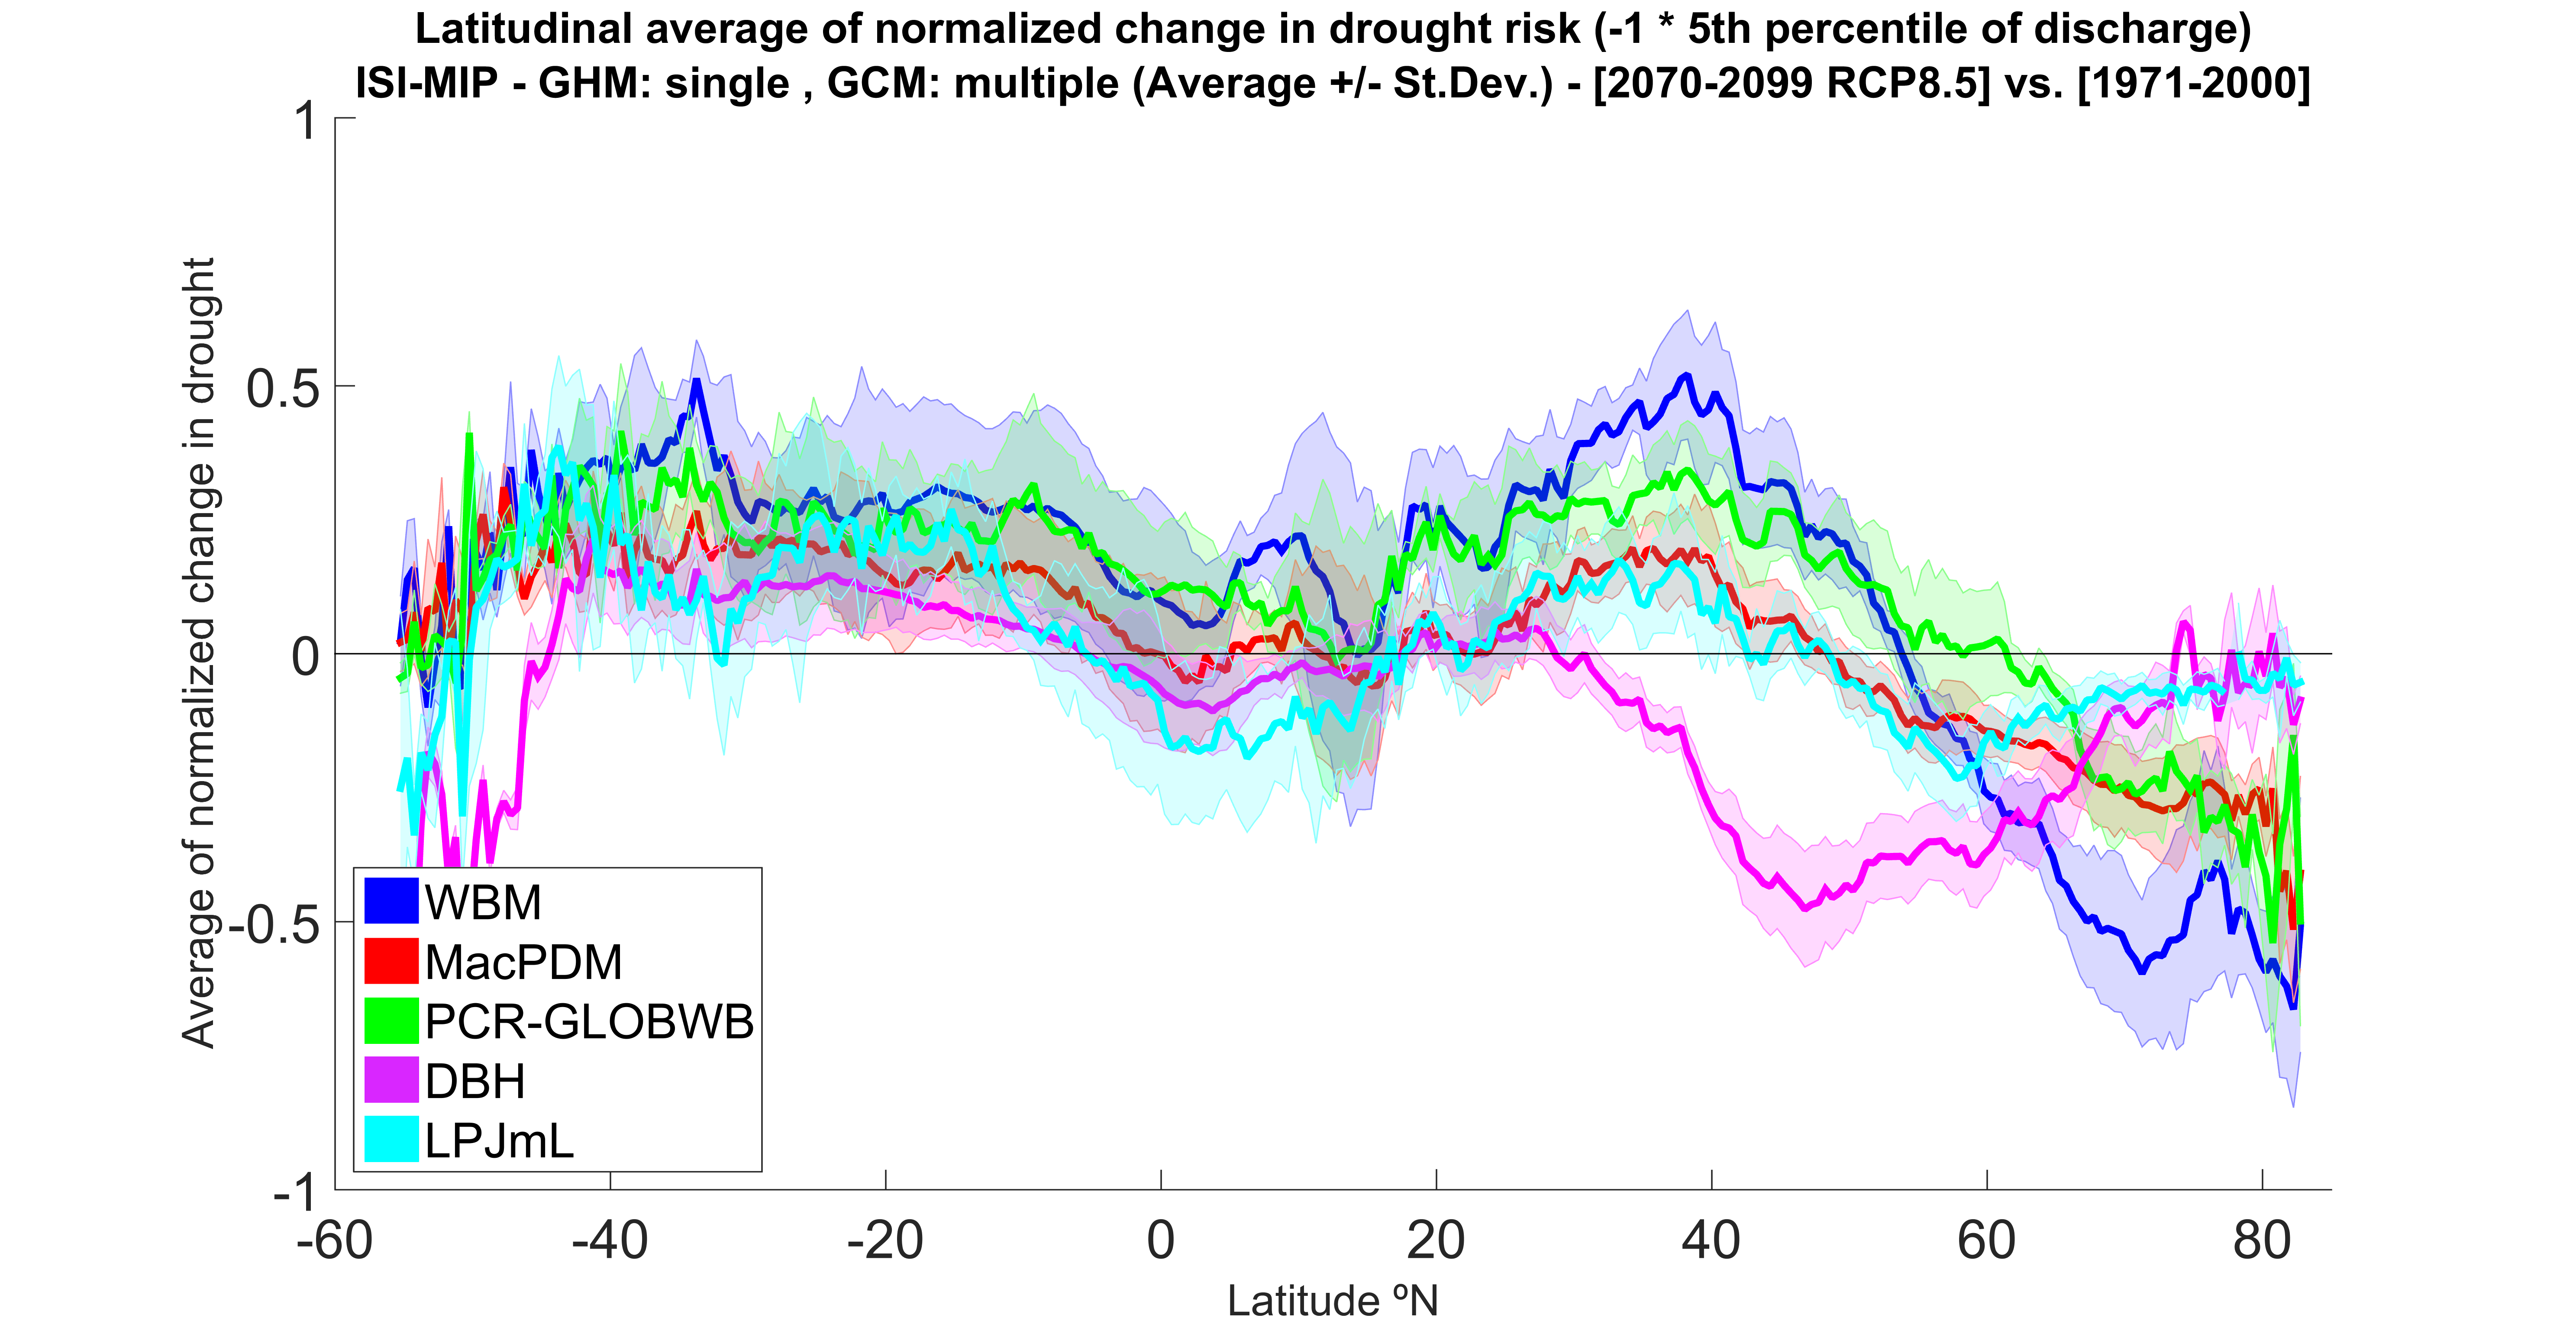
We use daily streamflow data obtained from the first phase of the ISI-MIP. The ISI-MIP streamflow projections are produced by multiple GHMs, based on bias-corrected meteorological outputs of 5 GCMs from the fifth version of the Coupled Model Intercomparison Project (CMIP5), which are downscaled to 0.5 degree resolution for the period 1971-2099. The GCMs contributing to the first phase of ISI-MIP are: GFDL-ESM2M, HadGEM2-ES, IPSL-CM5A-LR, MIROC-ESM-CHEM and NorESM1-M. The 5 GHMs selected for this study are WBM, MacPDM, PCR-GLOBWB, DBH and LPJmL. These models which have been used in previous studies, along with other models. However, we limit the number of GHMs to 5 so the analysis in this global scale is practical. Increasing/decreasing extreme high/low streamflow can form four combinations, which are categorized as the following four quadrants: 1. Increased high extreme and decreased low extreme, 2. Increased high and low extreme, 3. Decreased high and low extreme, and 4. Decreased high extreme and increased low extreme. Results obtained are averaged for each of these quadrants and the comparison of results between different scenarios is made for each quadrant individually. Assignment of each grid cell to the specified quadrant is based on the averaged change across GCMs and GHMs.
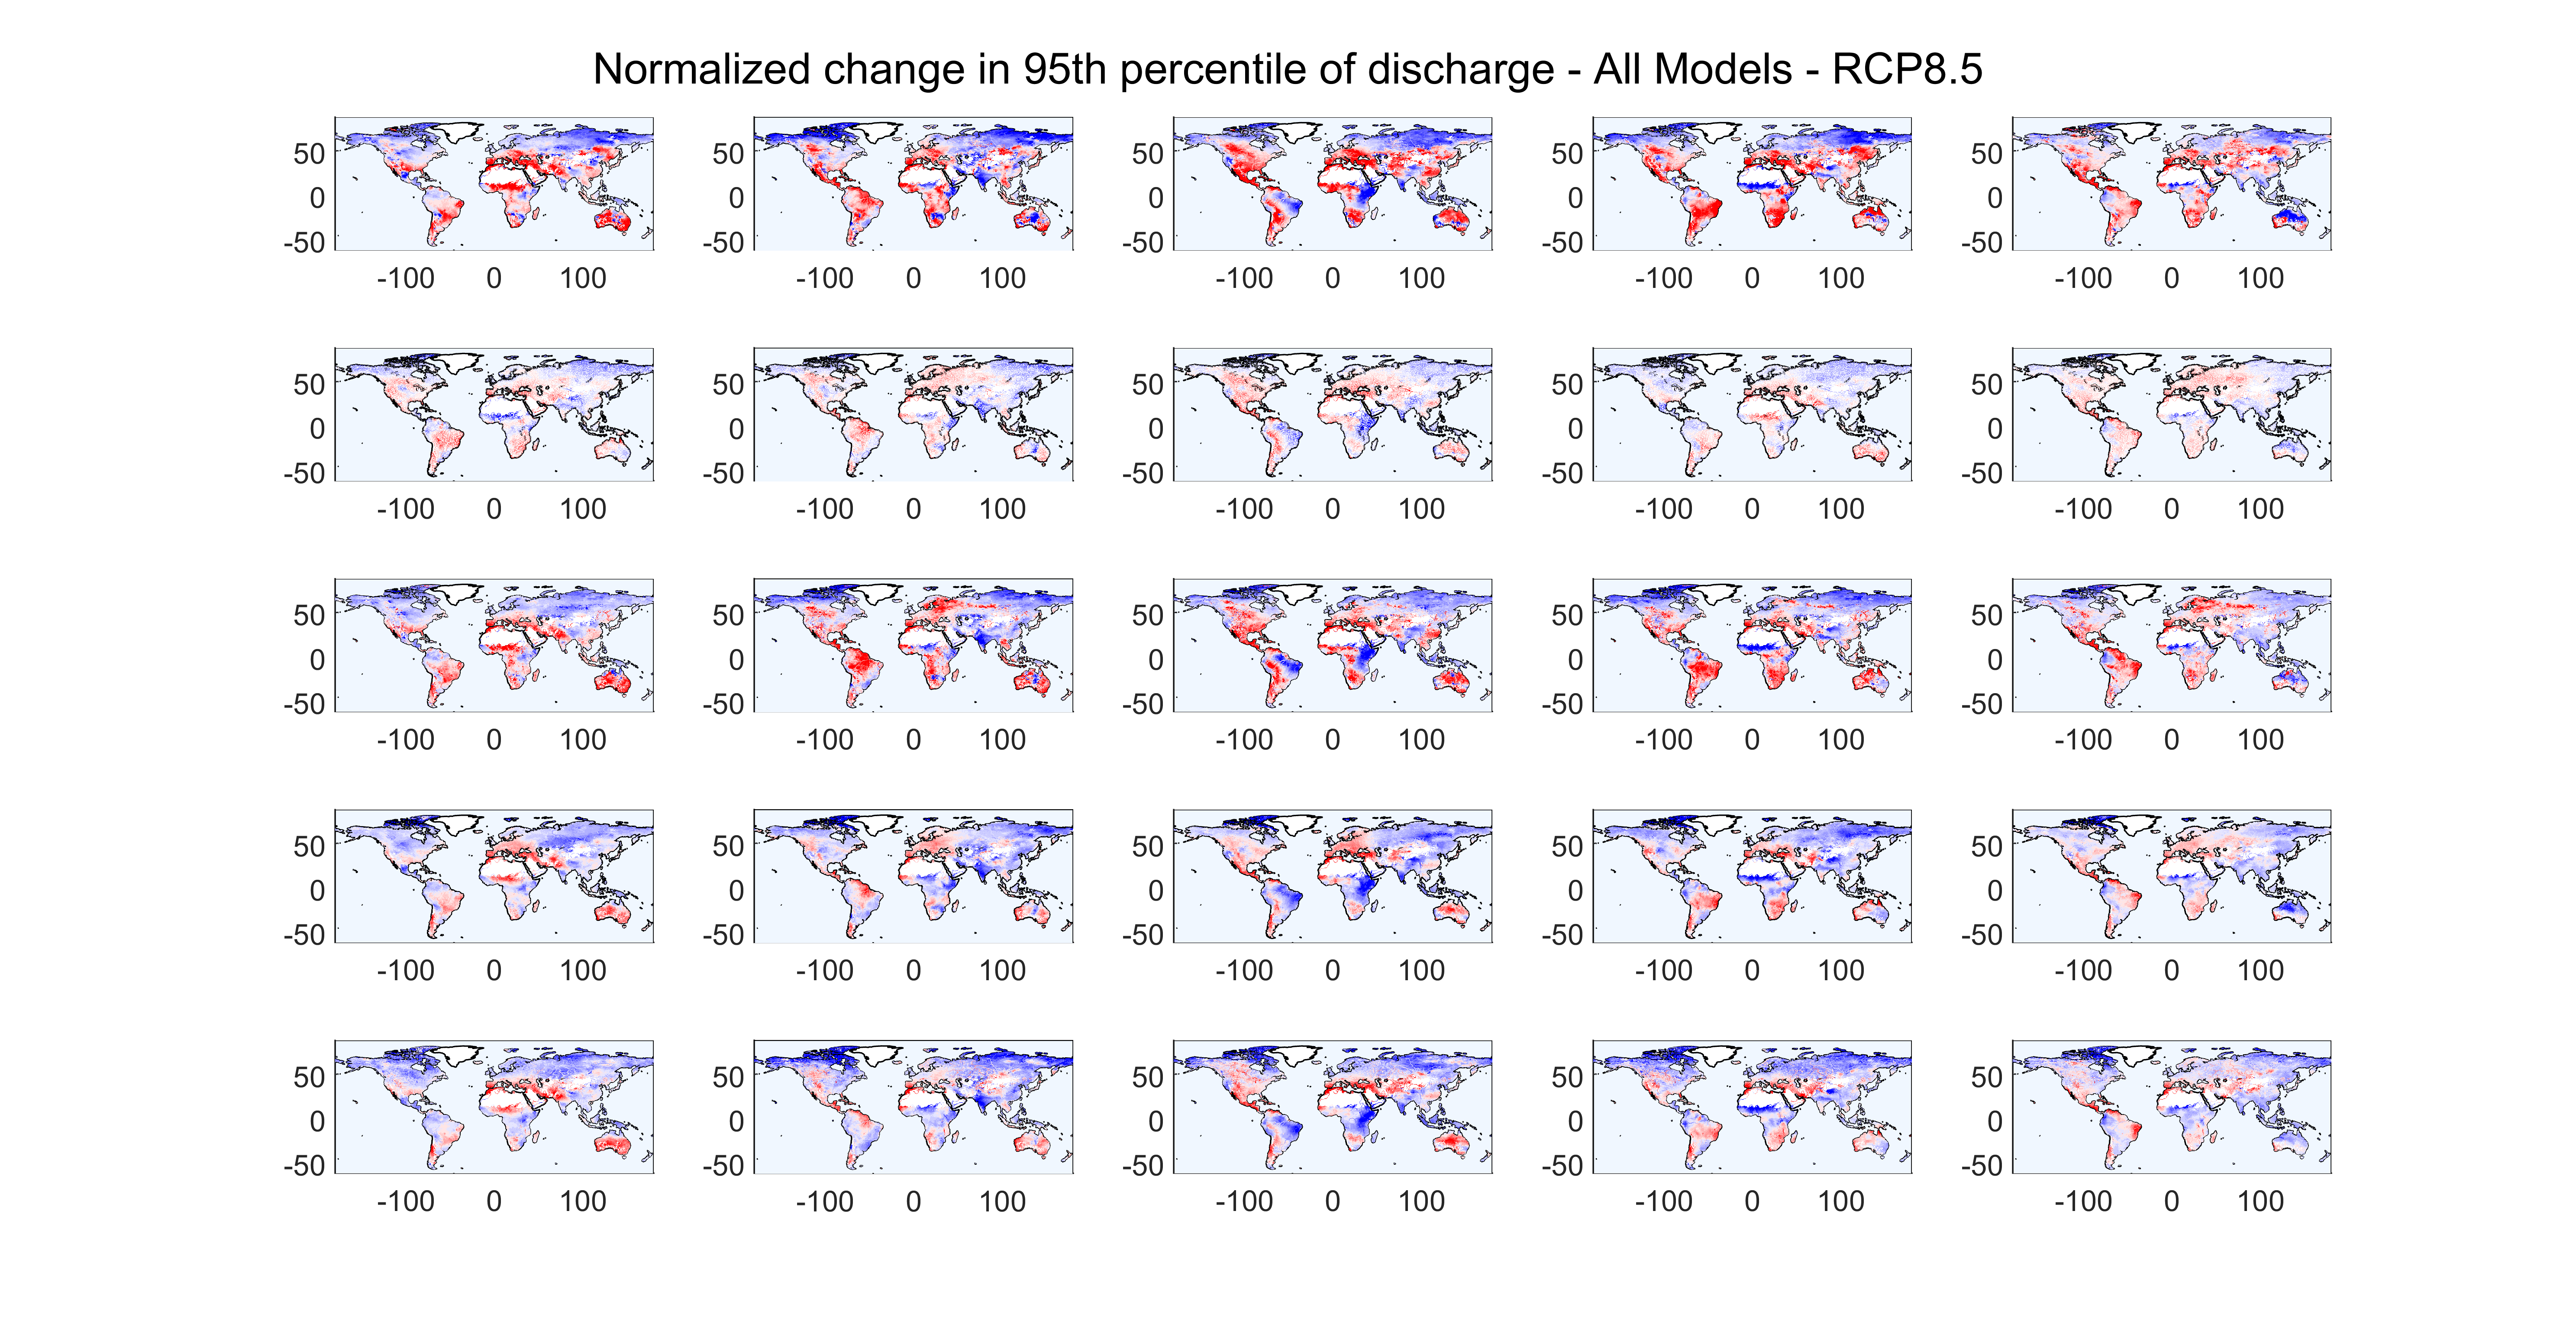
In order to calculate the normalized change in high extreme of a grid cell, the magnitude of the 95th percentile of daily streamflow (P95) is calculated for each year, and then averaged for 20C (called Q20C) and 21C (called Q21C). The normalized change is calculated as:
Delta_Q = ( Q_21C - Q_20C ) / ( Q_21C + Q_20C ) (Eq.1)
The ΔQ value ranges between -1 and +1, where a normalized change equal to -1 indicates total loss of the 20C flow in the 21C and a normalized change equal to +1 indicates that all of the 21C flow is resultant of the change and the flow in 20C was zero. As mentioned in the Introduction, an increase in P95 suggests the potential for an increase in flooding hazards. For normalized change in low extreme of a grid cell, the same calculations are performed on the magnitude of the 5th percentile of annual streamflow (P5). A decrease in P5 indicates the potential for worse drought hazards, and hence, the ΔQ for P5 is multiplied by -1 when shown in the plots, so that a positive value corresponds directly to increase in potential for hydrological drought. Multi-model ensemble averages of changes are calculated based on the normalized change values. However, averaged normalized changes are then reverted to relative changes, and results are shown in both normalized change and relative percentages (cf. Figure S1). Normalized change is symmetrical with respect to zero, meaning that multiplying flow by a factor of m and dividing flow by m over the 21C both yield normalized change values with same magnitude but opposite sign. For instance, tripling the flow over the 21C will yield a normalized change of 0.5, while dividing flow by 3 yields a normalized change value of -0.5. Relative changes in streamflow can be very large for individual grid cells, particularly in high latitudes that are currently ice-covered. This biases the averaging across models and grid cells towards a positive value, as the decreases are limited to 100% loss of the historic flow, while the increase can be well over 100% of the historic flow. Normalizing changes to between -1 and +1 is adopted here so the ranges of increases and decreases are comparable.We exclude grid cells that have average daily flow below 0.01 mm over the period of 1971-2000. Greenland and Antarctica are also excluded from the analysis. The remaining grid cells cover 75.9% of global land area, but include 95.9% of global population as of the year 2015. The grid cells with very low streamflow volume are excluded from the calculations, because such regions are very sensitive to changes projected by models and small increases in streamflow result in large relative changes in flood index, which may not meaningfully indicate to flooding risk for such dry regions. To identify the dry grid cells, the streamflow simulation of the WBM-plus model driven by reanalysis climate fields of WATCH Forcing Data (WFD) is used, as the ISI-MIP uses the WFD dataset for bias-correction of the GCM output.
Calculation of normalized change in streamflow in 21C compared to 20C is performed on each of the 25 GCM-GHM combination datasets individually. The results are averaged over the models for each grid cell. The multi-model averages are then averaged over the grid cells that show increase in the indicator and also separately over the grid cells that show decreases in the indicator (two separate values for each indicator). The multi-model averages are also averaged for each quadrant. This averaging gives a better sense of the projected magnitudes of changes in the high and low streamflow extremes for each warming scenario in affected regions than averaging over all land areas, because the positive and negative trends cancel each other out in a global averaging due to the semi-symmetric behavior of changes (Figures 2.c and d). In a supplementary analysis, the streamflow data of all the model combinations were averaged first and the normalized change was calculated on the multimodel-averaged streamflow data. Both approaches yielded very similar results, indicating that the analyses are not sensitive to the method of averaging.
The two-sample t-test is used in this study to quantify the statistical significance level of difference between the means of the 20C and 21C streamflow time series (refer to supplementary materials). The percentage of land area with statistically significant change (at 95% confidence level) is reported. The affected population is calculated using the Gridded Population of the World (GPW) data from the Center for International Earth Science Information Network (CIESIN).
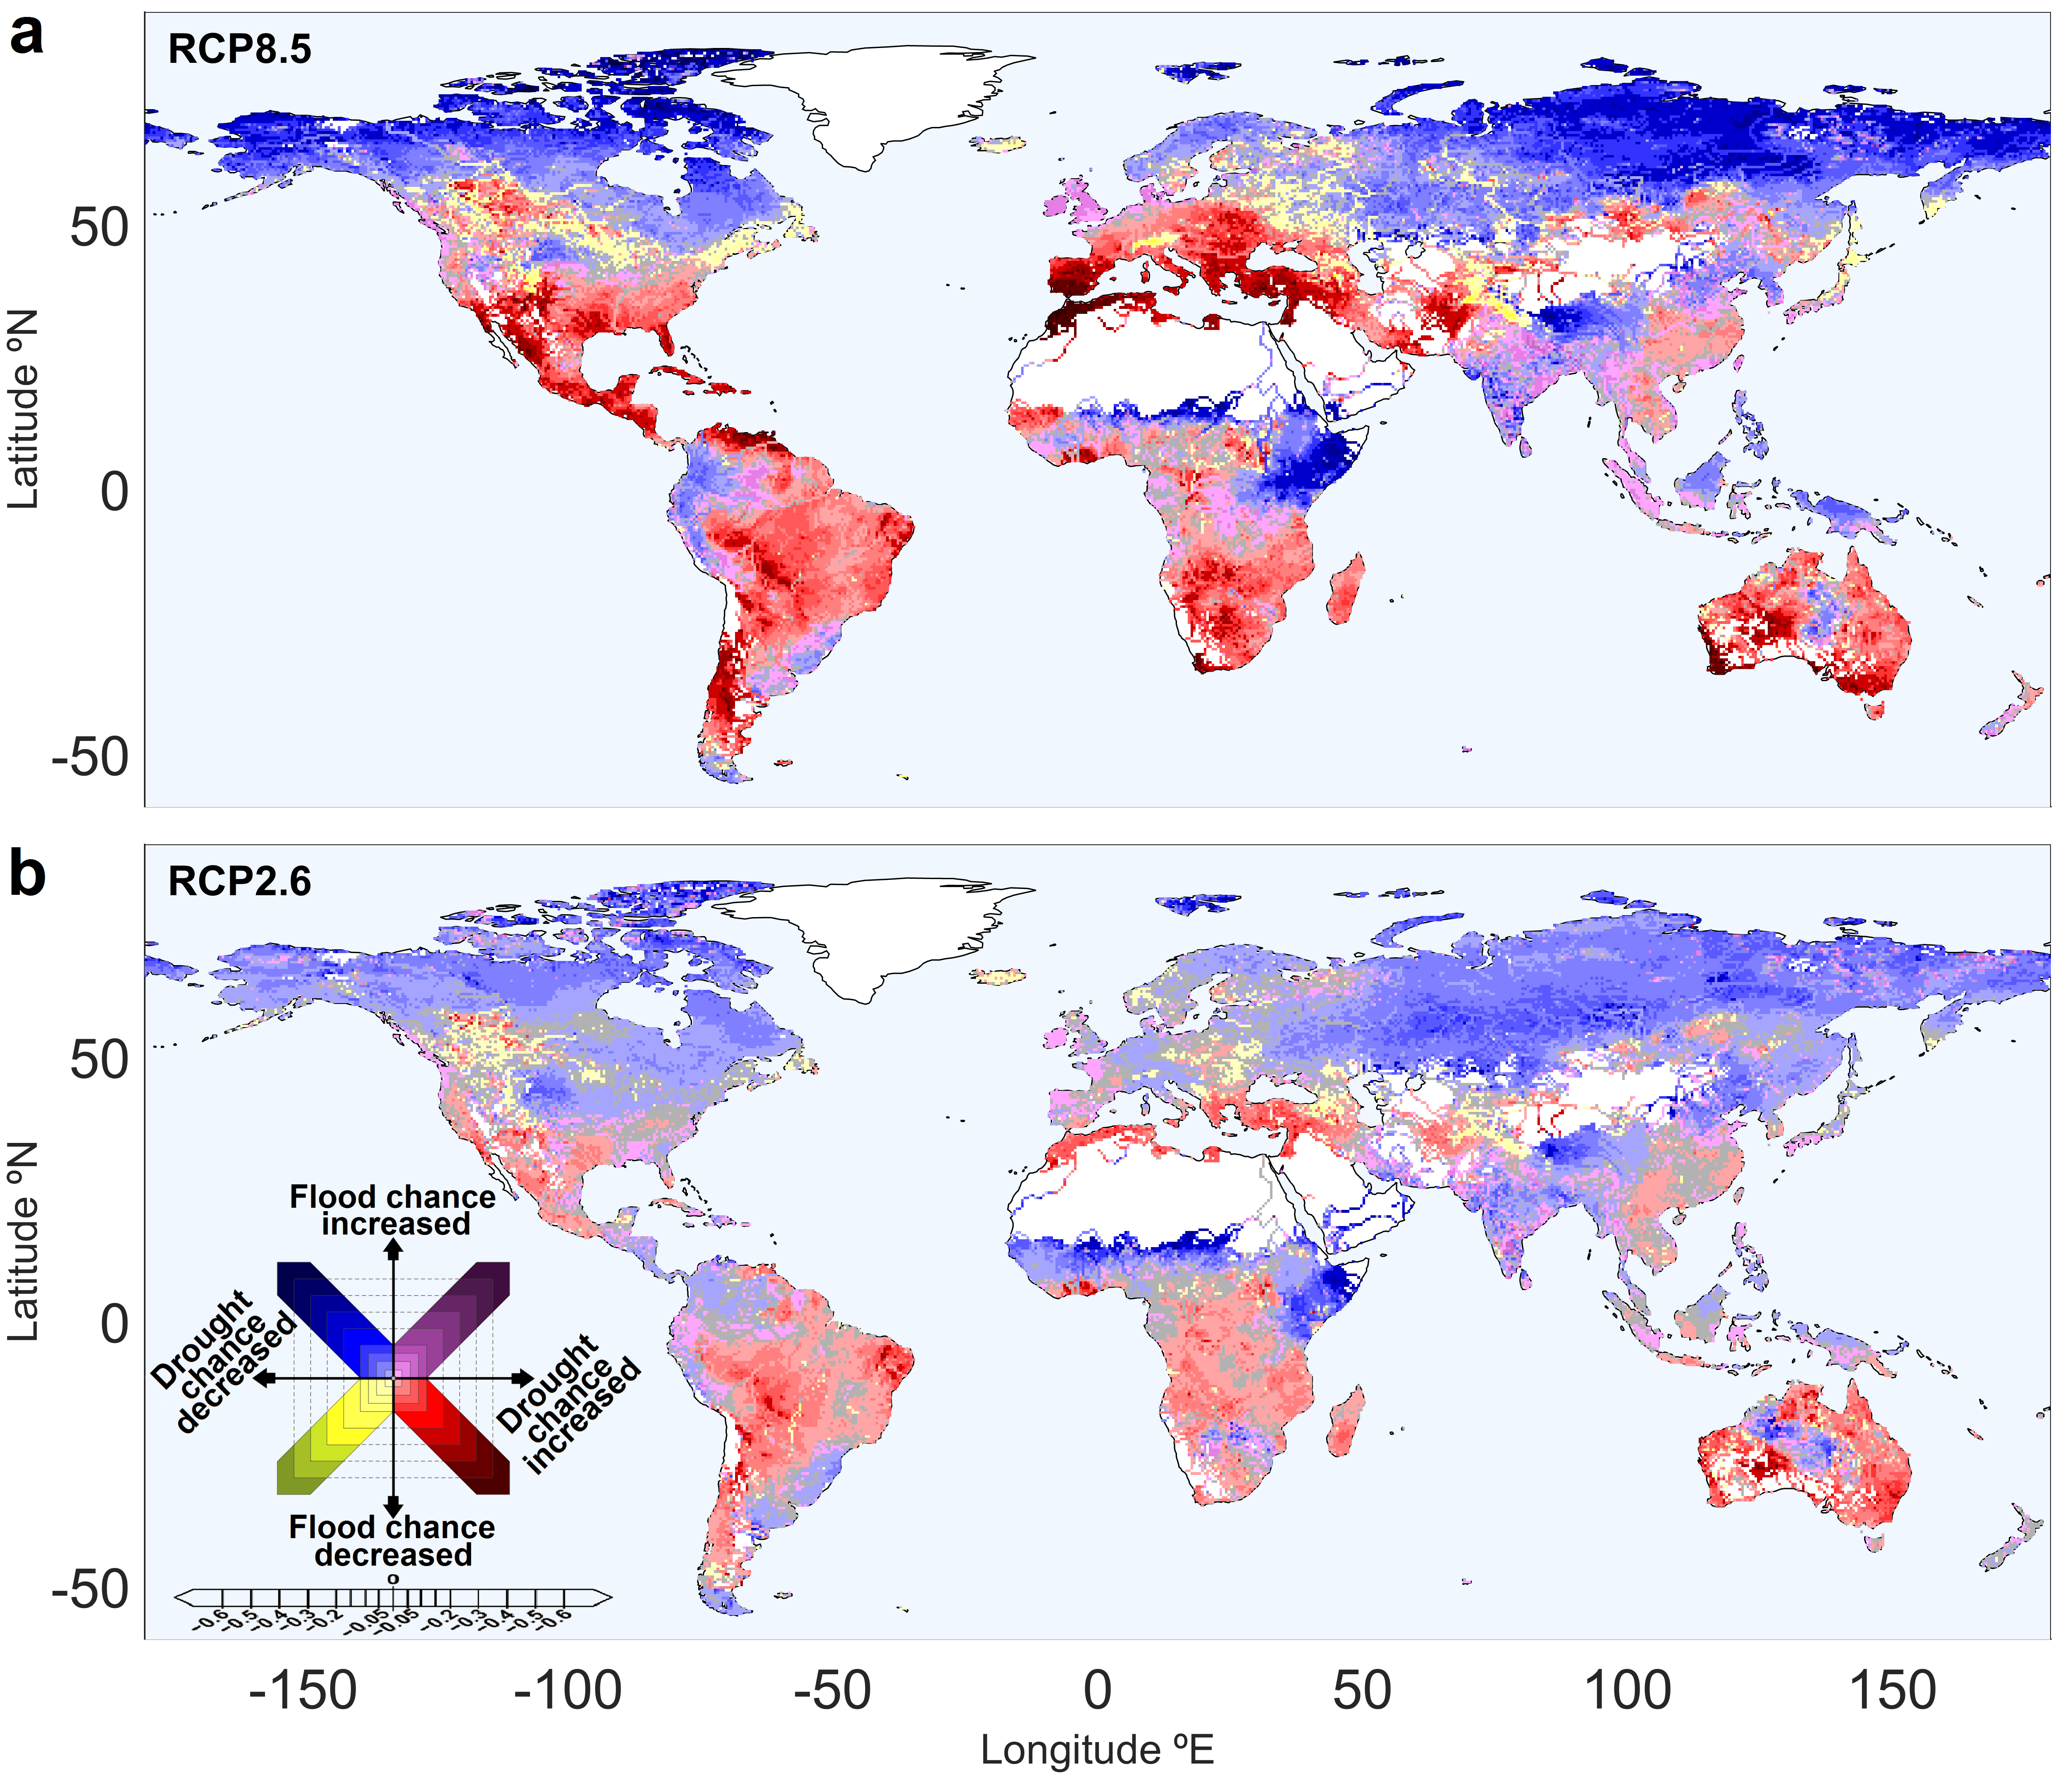
Main Figure: Global map of combined change in high and low extremes (related to change in flood and drought chance) under the (a) RCP8.5 and (b) RCP2.6 scenarios. The maps show the ensemble mean results of all 25 GCM-GHM combination datasets. Grid cells with an increase in both flood and drought chances (Quad. 1) are shown in purple shades, cells with increased flood chance (Quad. 2) and drought chance (Quad. 3) are shown in blue and red shades, respectively, and cells with a decrease in both flood and drought chances (Quad. 4) are shown in yellow shades. The saturation of colors is chosen based on the magnitude of normalized change in high and low extremes of streamflow, as shown in the legend. Distributions of cells in each of the quadrants are comparable to Fig. 2c and d. Grid cells with normalized changes less than 1 % (equal to 2 % in relative terms) in each quadrant are considered as no-change cells and are shown in gray.