- All of my projects are available at https://github.com/wrongsyntax?tab=repositories
![]()
![]()
![]()
![]()
![]()
![]()
![]()
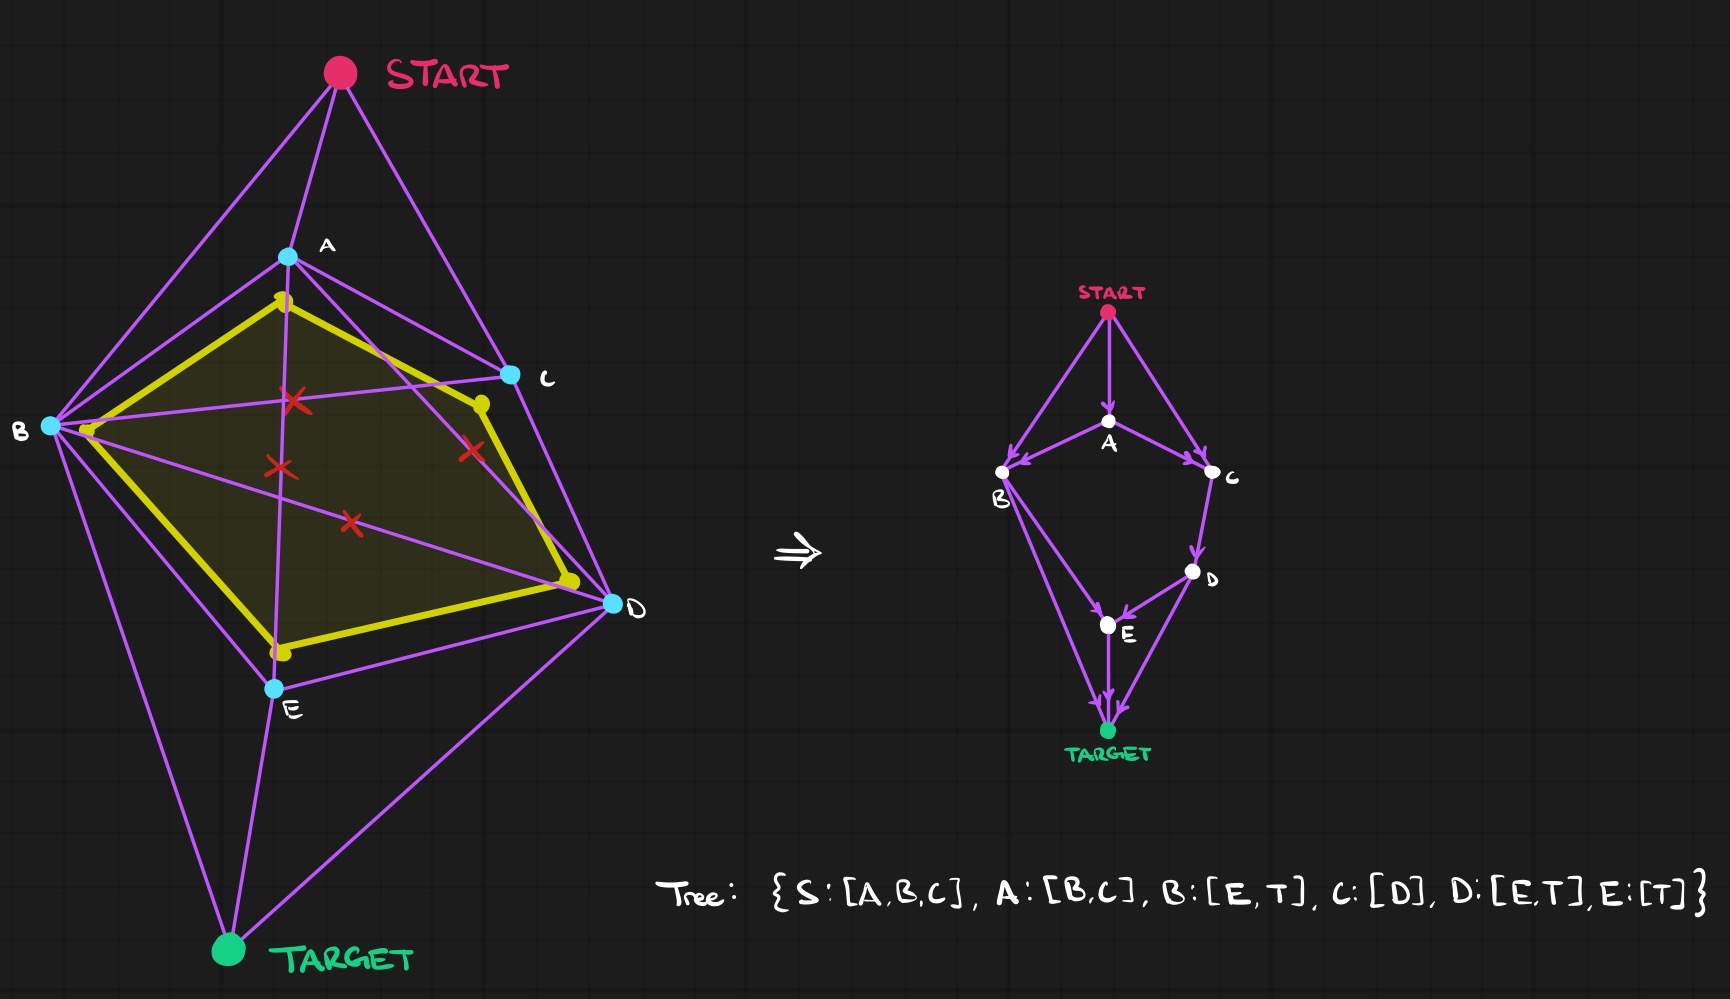
A* pathfinding implementation in Python
License: GNU General Public License v3.0
![]()
![]()
![]()
![]()
![]()
![]()
![]()


Traceback (most recent call last):
  File "[...]/AStar/tree.py", line 136, in <module>
    waypoints, nofly_region = create_safe_waypoints(parsed_nodes)
                              ^^^^^^^^^^^^^^^^^^^^^^^^^^^^^^^^^^^
  File "[...]/AStar/tree.py", line 63, in create_safe_waypoints
    safe_waypoints[name] = (safe_region.vertices[i].x, safe_region.vertices[i].y)
                            ~~~~~~~~~~~~~~~~~~~~^^^
IndexError: list index out of range
Occurred when attempting to add a new obstacle node 'F' at the end of data.csv.
Find a way to generate more test data, rather than just one csv file.
'start', 'target', or 'obstacle'Given a list of nodes and their (x,y) coordinates, find connections between nodes that avoid the region that must be avoided.
Nodes are given as:
The current position is known. This is the START position.
A series of nodes is given as the region that must be avoided. A safety_margin is added to the nodes. All nodes will move a constant amount away from where they originally are given as. A route needs to be found around this region.
The TARGET node is given.
Check if a straight line drawn between two nodes passes through the no-fly zone.
Generate the tree as required for the A* algorithm.
Find distance of each node from START (G_COST)
Find distance of each node from TARGET (H_COST)
Create and add documentation for treeplot.py in the wiki.
Making a Waypoint and Tree class could make the code more clear.
Not a necessary change as functionality would not change but could be done.
Create and add documentation for datagen.py in the Wiki.
Return list of waypoints in order.
Implement a way to visualize everything to ensure nothing weird is happening (polygons being incorrect was discovered by visualizing them)
Using matplotlib, plot all relevant data.
A declarative, efficient, and flexible JavaScript library for building user interfaces.
🖖 Vue.js is a progressive, incrementally-adoptable JavaScript framework for building UI on the web.
TypeScript is a superset of JavaScript that compiles to clean JavaScript output.
An Open Source Machine Learning Framework for Everyone
The Web framework for perfectionists with deadlines.
A PHP framework for web artisans
Bring data to life with SVG, Canvas and HTML. 📊📈🎉
JavaScript (JS) is a lightweight interpreted programming language with first-class functions.
Some thing interesting about web. New door for the world.
A server is a program made to process requests and deliver data to clients.
Machine learning is a way of modeling and interpreting data that allows a piece of software to respond intelligently.
Some thing interesting about visualization, use data art
Some thing interesting about game, make everyone happy.
We are working to build community through open source technology. NB: members must have two-factor auth.
Open source projects and samples from Microsoft.
Google ❤️ Open Source for everyone.
Alibaba Open Source for everyone
Data-Driven Documents codes.
China tencent open source team.