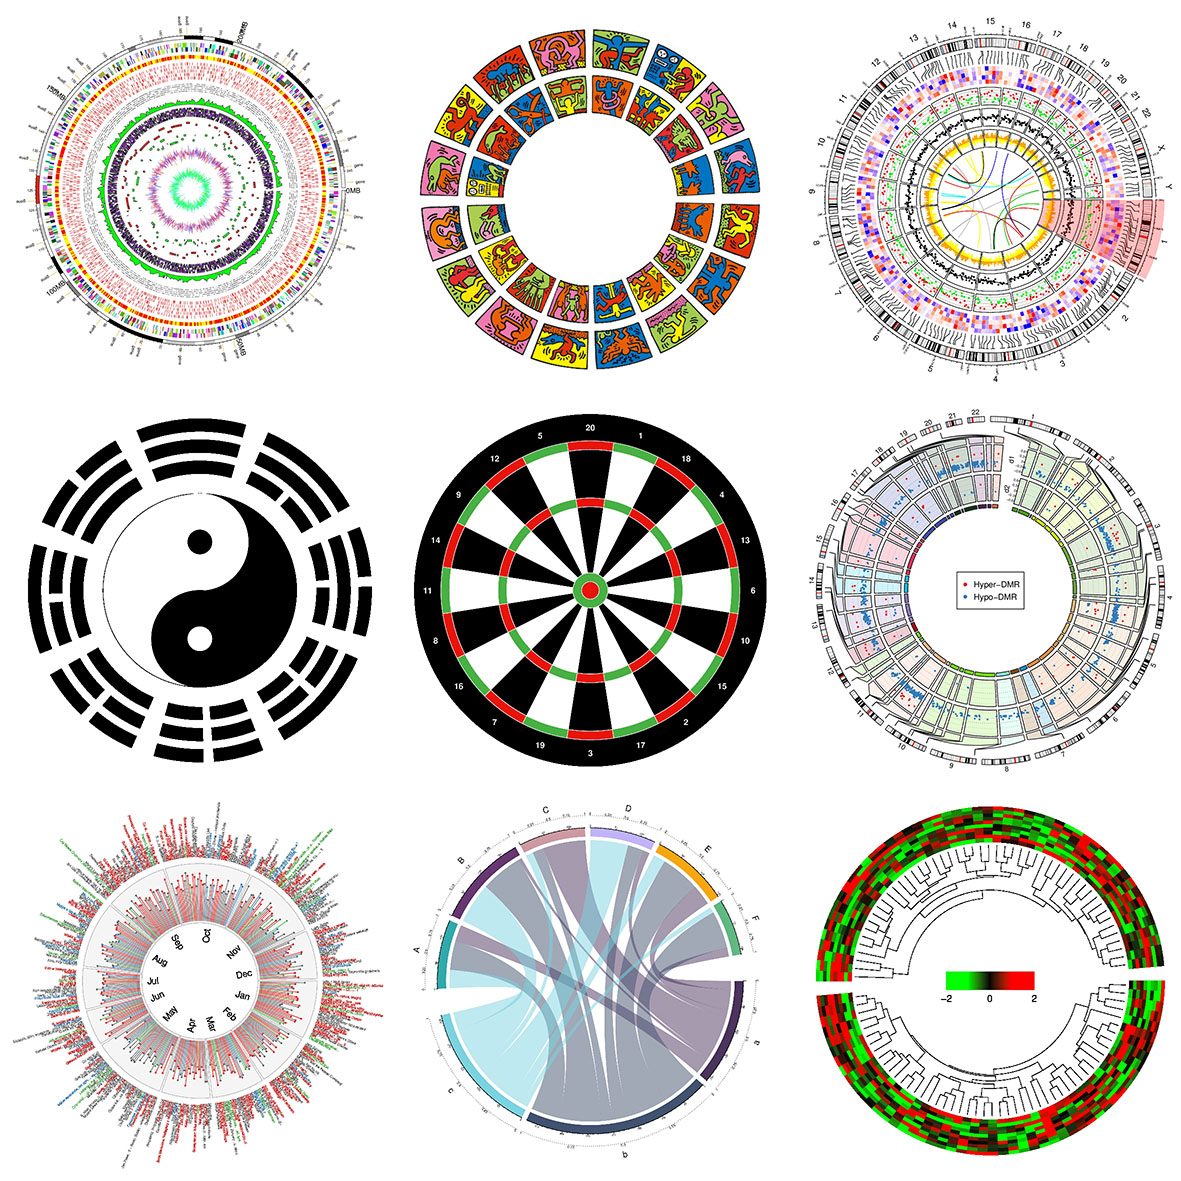
Circular layout is an efficient way for the visualization of huge amounts of information. Here the circlize package provides an implementation of circular layout generation in R as well as an enhancement of available software. The flexibility of this package is based on the usage of low-level graphics functions such that self-defined high-level graphics can be easily implemented by users for specific purposes. Together with the seamless connection between the powerful computational and visual environment in R, circlize givesa users more convenience and freedom to design figures for better understanding complex patterns behind multi-dimensional data.
Zuguang Gu, Lei Gu, Roland Eils, Matthias Schlesner, Benedikt Brors, circlize Implements and enhances circular visualization in R. Bioinformatics (Oxford, England) 2014. PubMed
The full documentations are available at http://jokergoo.github.io/circlize_book/book/.
Since most of the figures are composed of points, lines and polygons, we just need to implement functions for drawing points, lines and polygons, then the plots will not be restricted in any specific types.
Current there are following low-level graphic functions:
circos.points()circos.lines()circos.rect()circos.polygon()circos.text()circos.axis()circos.raster()circos.arrow()circos.link(), This maybe the unique feature for circos layout to represent relationships between elements.
For drawing points, lines and text through the whole track (among several sectors), the following functions are available:
circos.trackPoints()circos.trackLines()circos.trackText()
Functions to arrange the circular layout:
circos.track()circos.update()circos.nested()circos.par()circos.info()circos.clear()
Theoretically, you are able to draw most kinds of circular plots by the above functions.
For specific use in Genomics, we also implement functions which add graphics in genome scale.
Functions to initialize circular plot with genomic coordinates:
circos.initializeWithIdeogram()circos.genomicInitialize()
Functions to arrange genomic circular layout:
circos.genomicTrack()
Functions to add basic graphics in genomic scale:
circos.genomicPoints()circos.genomicLines()circos.genomicText()circos.genomicRect()circos.genomicLink()
Functions with specific purpose:
circos.genomicIdeogram()circos.genomicHeatmap()circos.genomicLabels()circos.genomicDensity()circos.genomicRainfall()
Finally, function that draws Chord diagram:
chordDiagram()
The package can be installed from CRAN:
install.packages("circlize")
or directly from GitHub:
devtools::install_github("jokergoo/circlize")
See http://jokergoo.github.io/circlize.
GPL (>= 2)


