Map generator is designed for game developers to simplify development and improve efficiency

Online display: https://alsritter.gitee.io/map-editor-online
⚠ This tool does not adapt to mobile terminal

Select the currently used brick

By default (you can parse the data in your own way) :
- Background: a Background layer that does not interact with the player
- Collision: Collision layer
- Traps: Traps layer
- Foreground: Occlude the layer in front of the character


What's the use of these tools?
- Pen Tool: the default pen tool, draw one square at a time
- Draw Area Tool: draw a block of squares
- Fill ALL Tool: Paint bucket tool, used to cover layers
- Fill Area Tool: used to fill the gaps
- Replace Tiles Tool: Replace tiles
- Erase Tool: Erase the current square
- Erase Area Tool: Erase a block

Set birth point and end point
Here are some working principles. Those who are not interested in this part can skip it directly~
<style>
  canvas {
    border: 1px solid black;
  }
</style>

<canvas width="500" height="500" id="testCanvas"></canvas>

<script type="text/javascript">
  function draw() {
    const canvas = document.getElementById('testCanvas')
    const ctx = canvas.getContext('2d') //取得2d 画布上下文

    const _cols = 16
    const _rows = 16

    // 先获取每个图形格子的大小
    const _space = canvas.width / _cols

    // 绘制线条
    for (let i = 0; i < _cols; i++) {
      ctx.beginPath(); // 开启路径,设置不同的样式
      ctx.moveTo(_space * i - 0.5, 0); // -0.5是为了解决像素模糊问题
      ctx.lineTo(_space * i - 0.5, canvas.height);
      ctx.setLineDash([1, 2]); //绘制虚线
      ctx.strokeStyle = "#2a2a2a"; // 设置每个线条的颜色
      ctx.stroke();
    }
    // 同理y轴
    for (let i = 0; i < _rows; i++) {
      ctx.beginPath(); // 开启路径,设置不同的样式
      ctx.moveTo(0, _space * i - 0.5);
      ctx.lineTo(canvas.width, _space * i - 0.5);
      ctx.strokeStyle = "#2a2a2a";
      ctx.stroke();
    }
  }
  window.addEventListener('load', draw, false)
</script>Note: There are three coordinate information that can be obtained by mouse events, offset must be used here for page, offset, and client, otherwise an error will occur
console.log('page: ', e.pageX, e.pageY)
console.log('offset: ', e.offsetX, e.offsetY)
console.log('client: ', e.clientX, e.clientY)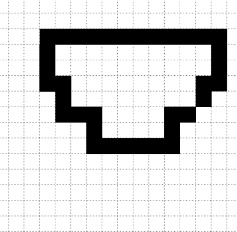
 const map = []
 // 先初始化 map
 for (let y = 0; y < _rows; y++) {
   const temp = []
   for (let x = 0; x < _cols; x++) {
     temp.push(0)
   }
   map.push(temp)
 }

 // 监听鼠标事件,判断当前点击了哪个格子
 canvas.onmousedown = (e) => {
   const x = Math.floor(e.offsetY / _space)
   const y = Math.floor(e.offsetX / _space)
   // 点击更新该区域的编号
   map[y][x] = 1
   // 刷新画布
   for (let y = 0; y < _rows; y++) {
     for (let x = 0; x < _cols; x++) {
       if(map[x][y] !== 0) {
         // 绘制
         ctx.fillRect(x * _space, y * _space, _space, _space)
       }
     }
   }
 }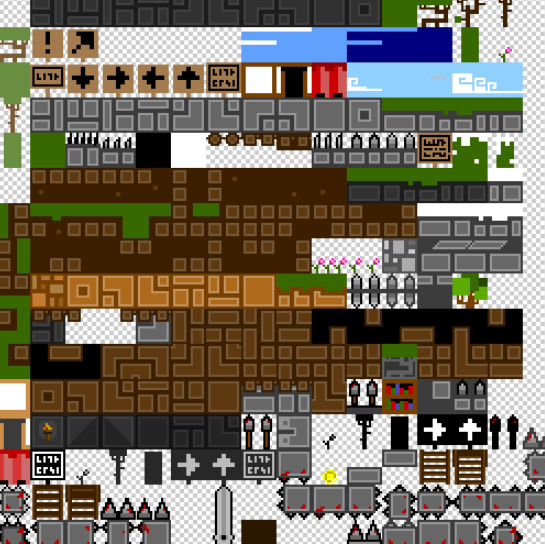
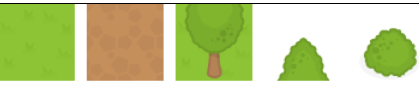
The most effective way to store Tileset is atlas or sprite sheet. This is all the required tiles grouped together in a single image file. When tiles need to be drawn, only a small part of this larger image is presented on the game canvas. The following RPGMaker is the Tileser used
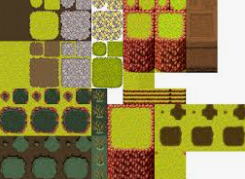
Here is the Tileset used in the tutorial

The first step is to cut this atlas (here is a direct demonstration of how to obtain the data, and actually start to use it in the next section)
function draw() {
  let ctx = document.getElementById('canvas').getContext('2d')
  let img = new Image()
  img.onload = () => {

    let tileColsNum = 5; // 图的宽度,以列表示
    let tileRowsNum = 1; // 图的高度,以行为中

    let sWidth = img.width / tileColsNum; // 切图的宽度
    let sHeight = img.height / tileRowsNum; // 切图的高度

    for (let col = 0; col < tileColsNum; col++) {
      for (let row = 0; row < tileRowsNum; row++) {

        ctx.drawImage(img,
          col * sWidth, // 开始切的 X 位置
          row * sHeight, // 开始切的 Y 位置
          sWidth, sHeight, // 切的高度和宽度
          col *( sWidth + 10) ,  row * sHeight, // 显示的位置
          sWidth, sHeight) // 显示的高度和宽度

      }
    }
  }

  img.src = './src/img/tiles.png'
}

window.addEventListener('load', draw, false)
The drawing effect is as follows
// 根据鼠标点击取得格子
canvas.onmousedown = (e) => {
  console.log(map[Math.floor(e.offsetY / _space)][Math.floor(e.offsetX / _space)])
}
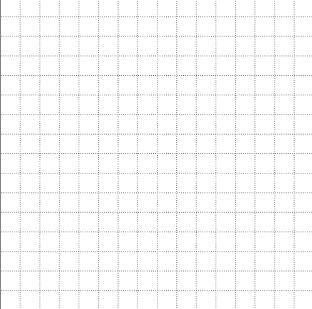
  /**
   * 绘制背景方格
   * @param {CanvasRenderingContext2D} ctx 传入 canvas 的 Context
   * @param {Number} width 画布的宽度
   * @param {Number} height 画布的高度
   */
  static drawBackground(ctx, width, height) {
    let emptyBox = ctx.createImageData(width, height)
    let emptyBoxData = emptyBox.data

    // 通过 canvas宽高 来遍历一下 canvas 上的所有像素点
    for (let i = 0; i < height; i++) {
      for (let j = 0; j < width; j++) {
        let point = (i * width + j) << 2 // << 相当于 * 4
        let rgbData = ((i >> 2) + (j >> 2)) & 1 ? 204 : 255 // >> 2 相当于 / 4 取整, & 1相当于 % 2
        emptyBoxData[point] = rgbData
        emptyBoxData[point + 1] = rgbData
        emptyBoxData[point + 2] = rgbData
        emptyBoxData[point + 3] = 255
      }
    }

    ctx.putImageData(emptyBox, 0, 0)
}To store the graph data, you can use a custom class
/**
 * 单个 Tile 在图片的位置
 */
class Tile {
  /**
   * Tile 在贴图里面的位置,以及保存它的路径偏移量(贴图位置和路径偏移量无关,后者是保存它显示在屏幕的位置)
   * @param {Number} x Tile 在贴图里的起始 x
   * @param {Number} y Tile 在贴图里的起始 y
   */
  constructor(x, y) {
    this.x = x
    this.y = y
  }
}

/**
 * TileImage 里面的 Tile
 */
export class TileMap {
  /**
   *
   * @param {Number} cols Tile贴图的宽度(一列有多少个 Tile)
   * @param {Number} rows Tile贴图的高度(一行有多少个 Tile)
   * @param {HTMLImageElement} img 这里传入的 Tile 贴图,必须放在 onload 里面执行
   */
  constructor(cols, rows, img) {
    this.cols = cols
    this.rows = rows
    this.img = img

    this.tiles = []
    this.sWidth = 0 // 每个单元格的宽度
    this.sHeight = 0 // 每个单元格的高度

    this.sWidth = this.img.width / this.cols // 切图的宽度
    this.sHeight = this.img.height / this.rows // 切图的高度

    for (let col = 0; col < this.cols; col++) {
      for (let row = 0; row < this.rows; row++) {
        this.tiles.push(new Tile(col * this.sWidth, row * this.sHeight))
      }
    }
  }
  /* 省略一堆 getter */
}Need to implement a mouse to move to a certain Tile to get the corresponding Tile number
Note: There are three coordinate information that can be obtained by mouse events, offset must be used here for page, offset, and client, otherwise an error will occur
console.log('page: ', e.pageX, e.pageY)
console.log('offset: ', e.offsetX, e.offsetY)
console.log('client: ', e.clientX, e.clientY)
These three events are mainly used: onmouseup, onmouseout, onmousedown
// 监听鼠标事件,松手时刷新画布
canvas.onmouseup = (e) => {
  ctx.clearRect(0, 0, canvas.width, canvas.height)
  DrawUtility.drawAllTile(ctx, map, posList)
}

// 移出画布也刷新
canvas.onmouseout = (e) => {
  ctx.clearRect(0, 0, canvas.width, canvas.height)
  DrawUtility.drawAllTile(ctx, map, posList)
}

// 监听鼠标事件,判断当前点击了哪个区域
canvas.onmousedown = (e) => {
  for (let index = 0; index < map.getTiles().length; index++) {
    if (
      ctx.isPointInPath(
        posList.getTilePosOfArray(index).path,
        e.offsetX,
        e.offsetY
      )
    ) {
      console.log(`点击了 ${index}`)
      DrawUtility.drawDarkTile(ctx, posList, index)
    }
  }
}Because there are many state changes involved, such as changing the layer, importing new data, changing the display mode, etc., it is necessary to use events to decouple them, and the control layer only needs to monitor the occurrence of a certain time.
For example, a refresh event needs to be issued when a certain state has changed
// 监听显示模式(这里对 Vuex 的值进行监听)
$store.watch(
  () => $store.state.isShowAllLayer,
  val => {
    isShowAll = new Boolean(val).valueOf();
    window.dispatchEvent(new CustomEvent("refreshData")); // 通知更新数据
  }
);
And monitor and refresh this event in the control layer
// 定义一个刷新事件的监听
window.addEventListener("refreshData", () => {
  // 这里进行刷新操作
});This withdrawal is actually a process of stacking and popping, so you can maintain a stack yourself.
import Grid from "./VO/Grid";

/**
 * 自定义的栈结构,主要用来维护 画布数据
 */
export default class MapStack {
  private arr: Array<{ layer: number; map: Grid[][] }>;

  constructor() {
    this.arr = [];
  }

  /**
   * 压栈操作
   * @param { { layer: number, map: Grid[][] }} mapInfo
   */
  push(mapInfo: { layer: number; map: Grid[][] }): void {
    this.arr.push(mapInfo);
  }

  /**
   * 退栈操作
   */
  pop(): { layer: number; map: Grid[][] } {
    return this.arr.pop() as { layer: number; map: Grid[][] };
  }
  /**
   * 获取栈顶元素
   */
  top(): { layer: number; map: Grid[][] } {
    return this.arr[this.arr.length - 1];
  }
  /**
   * 清空栈
   */
  clear(): boolean {
    this.arr = [];
    return true;
  }
}
Push to the stack in time after each write
And then monitor in the control layer Ctrl + Z
// 监听撤回键(使用栈)
document.onkeydown = e => {
  if (e.ctrlKey == true && e.key == "z") {
    // 如果栈内不为空才撤回
    if (recallMap.size() !== 0) {
      // 弹栈
      const temp = recallMap.pop();
      gridManagerArray[temp.layer].setMap(temp.map);
      window.dispatchEvent(refreshEvent); // 通知更新数据
    }
  }
};If you refresh all the data every frame, a lot of performance will be wasted, and there are multiple layers of data that make it worse
Create a cacheMap to record the modified location, it will be updated in the next frame
import BasePos from "./VO/BasePos";

export default class CacheMap {
  private cols: number;
  private rows: number;
  private map: boolean[][];

  constructor(cols: number, rows: number) {
    this.cols = cols;
    this.rows = rows;

    this.map = [];

    // 每个数组都需要先初始化 默认是 false
    for (let i = 0; i < rows; i++) {
      const temp: boolean[] = [];
      for (let j = 0; j < cols; j++) {
        temp.push(false);
      }
      this.map.push(temp);
    }
  }

  /**
   * 返回被修改的位置
   * @returns {ModifiedPos[]} 里面是被修改的位置,需要被更新
   */
  getChange(): BasePos[] {
    const list: BasePos[] = [];

    // 如果有被修改的则把这个位置添加到 List 里面
    for (let i = 0; i < this.rows; i++) {
      for (let j = 0; j < this.cols; j++) {
        if (this.map[i][j]) {
          list.push(new BasePos(i, j));
        }
      }
    }

    return list;
  }

  /**
   * 标识这个地方被修改了
   * @param x 被修改的 x 坐标
   * @param y 被修改的 y 坐标
   */
  setChange(x: number, y: number): void {
    this.map[x][y] = true;
  }

  /* ............. */

  /**
   * 当更新完成之后要归零
   */
  cleanChange(): void {
    for (let i = 0; i < this.rows; i++) {
      for (let j = 0; j < this.cols; j++) {
        this.map[i][j] = false;
      }
    }
  }
}
And after refreshing the data every frame, it will only be re-rendered after the Cache is changed.
// 局部刷新
    const modif = cacheMap.getChange();

for (let i = 0; i < modif.length; i++) {
  // 先清空指定的位置
  DrawTools.clearTile(
    ctx,
    space,
    gridManagerArray[layer].getGrid(modif[i].x, modif[i].y).x,
    gridManagerArray[layer].getGrid(modif[i].x, modif[i].y).y
  );
  // 因为有多层数据,所以这里遍历刷新每一层的这个位置
  for (let j = 0; j < gridManagerArray.length; j++) {
   RendererTools.changeTile(
     gridManagerArray,
     j,
     modif,
     i,
     tileManager,
     ctx,
     space
   );

}

// 更新完成后要归零
cacheMap.cleanChange();In fact, the paint bucket in PS is generally used for coloring. For example, clicking on the painted circle will automatically fill it without going outside.
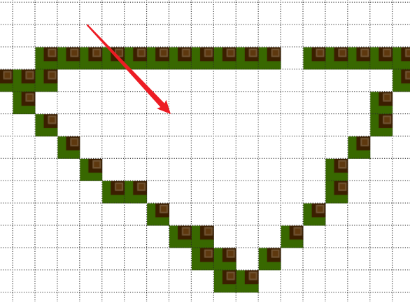
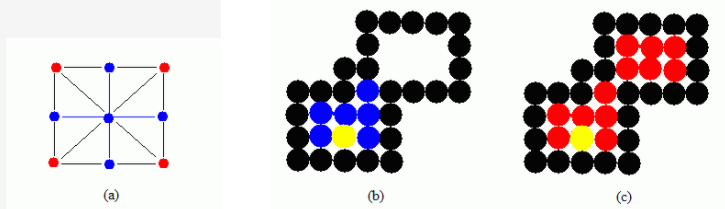
The 4-unicom algorithm is used here
Note: 8-Unicom and 4-Unicom are only different in the number of judgments. The blue one is 4 Unicom, and the red one is the effect of 8 Unicom.

// 4联通要判断的方向
const direction_4 = [
  { offsetX: -1, offsetY: 0 },
  { offsetX: 1, offsetY: 0 },
  { offsetX: 0, offsetY: -1 },
  { offsetX: 0, offsetY: 1 },
]

// 8联通要判断的方向
const direction_8 = [
  { offsetX: 0, offsetY: -1 },
  { offsetX: 0, offsetY: 1 },
  { offsetX: -1, offsetY: 0 },
  { offsetX: 1, offsetY: 0 },
  { offsetX: -1, offsetY: 1 },
  { offsetX: -1, offsetY: -1 },
  { offsetX: 1, offsetY: 1 },
  { offsetX: 1, offsetY: -1 },
]This can be used to achieve color replacement
The injection filling algorithm does not have the concept of a boundary, but only replaces the specified color in the Unicom area.
function floodSeedFill(map, x, y, oldValue, newValue, maxX, minX, maxY, minY) {

  // 要做边界值判断
  if (
    x > maxX ||
    x < minX ||
    y > maxY ||
    y < minY) {
    return
  }

  // 递归条件就是某个方向上指定的位置为旧值
  if (map[x][y] == oldValue) {
    map[x][y] = newValue
    for (let i = 0; i < direction_4.length; i++) {
      const newX = x + direction_4[i].offsetX
      const newY = y + direction_4[i].offsetY
      floodSeedFill(map, newX, newY, oldValue, newValue, maxX, minX, maxY, minY)
    }
  }
}This is different from the direction of the above injection and filling. This is more about the boundary (the specified color is the boundary), which will replace all the values within the specified boundary
function BoundarySeedFill(map, x, y, boundaryValue, newValue, maxX, minX, maxY, minY) {
  // 要做边界值判断
  if (
    x > maxX ||
    x < minX ||
    y > maxY ||
    y < minY) {
    return
  }

  if (map[x][y] !== boundaryValue && map[x][y] !== newValue) {

    map[x][y] = newValue
    for (let i = 0; i < direction_4.length; i++) {
      const newX = x + direction_4[i].offsetX
      const newY = y + direction_4[i].offsetY
      BoundarySeedFill(map, newX, newY, boundaryValue, newValue, maxX, minX, maxY, minY)
    }
  }
}