WholeBrain
WholeBrain is intended as a software suite, meaning a collection of computer programs sharing a common interface and ability to integrate and exchange data with each other.
The purpose of WholeBrain is to provide a user-friendly and efficient way for scientist with minimal knowledge of computers to create anatomical maps and integrate this information with behavioral and physiological data for sharing on the web.
WholeBrain is conceived and created by Daniel Fürth, a PhD student in Konstantinos Meletis lab, at Department of Neuroscience, Karolinska Institutet.
Quick question about something you think can be resolved quite fast? Then just go to the gitter room and chat with me:
Table of Contents
| section | description |
|---|---|
| For developers | instructions for dev. |
| Installation instructions | How to install on macOS, Windows and Linux. |
| How to get started | Link to tutorial page with Youtube videos and code |
| Example processing a single section | To get you started directly |
For developers
Sorry for the poor documentation. I’m working on it. DM me if interested in contributing or specific dev questions. As is usually the case with scientific code this code was written on the go with the purpose of what is valued in academia: getting scientific results and publishing. Sorry for this.
Time, effort and thought on design considerations are required to produce quality code/software. Given the publish or perish mantra in academia, this time investment is often spent writing a new publication. It's a risk-reward consideration. I hope I mitigate the problem at a later time by constantly refractory this code base.
### Installation instructionshttp://www.wholebrainsoftware.org/cms/install/
Tutorials
http://www.wholebrainsoftware.org/cms/tutorials/
Author(s)
Daniel Fürth - @wholebrainsuite - [email protected]
Example processing a single section
#load package
library(wholebrain)
Get the image(s) you want to process.
#set folder with 16-bit raw single-channel TIFF images
folder<-"~/Users/Documents/myexperiment/"

#get images
images<-get.images(folder)
Segment out neurons and the brain outline from autofluorescence.
#segment neurons and brain outline
seg<-segment(images[1])
# to access parameters programmatically tryout edit(seg$filter) on the output
Register to coordinate 0.38 mm anterior-posterior from bregma.
#register to atlas coordinate 0.38 mm from bregma anterior-posterior
regi<-registration(images[1], coordinate= 0.38, filter=seg$filter)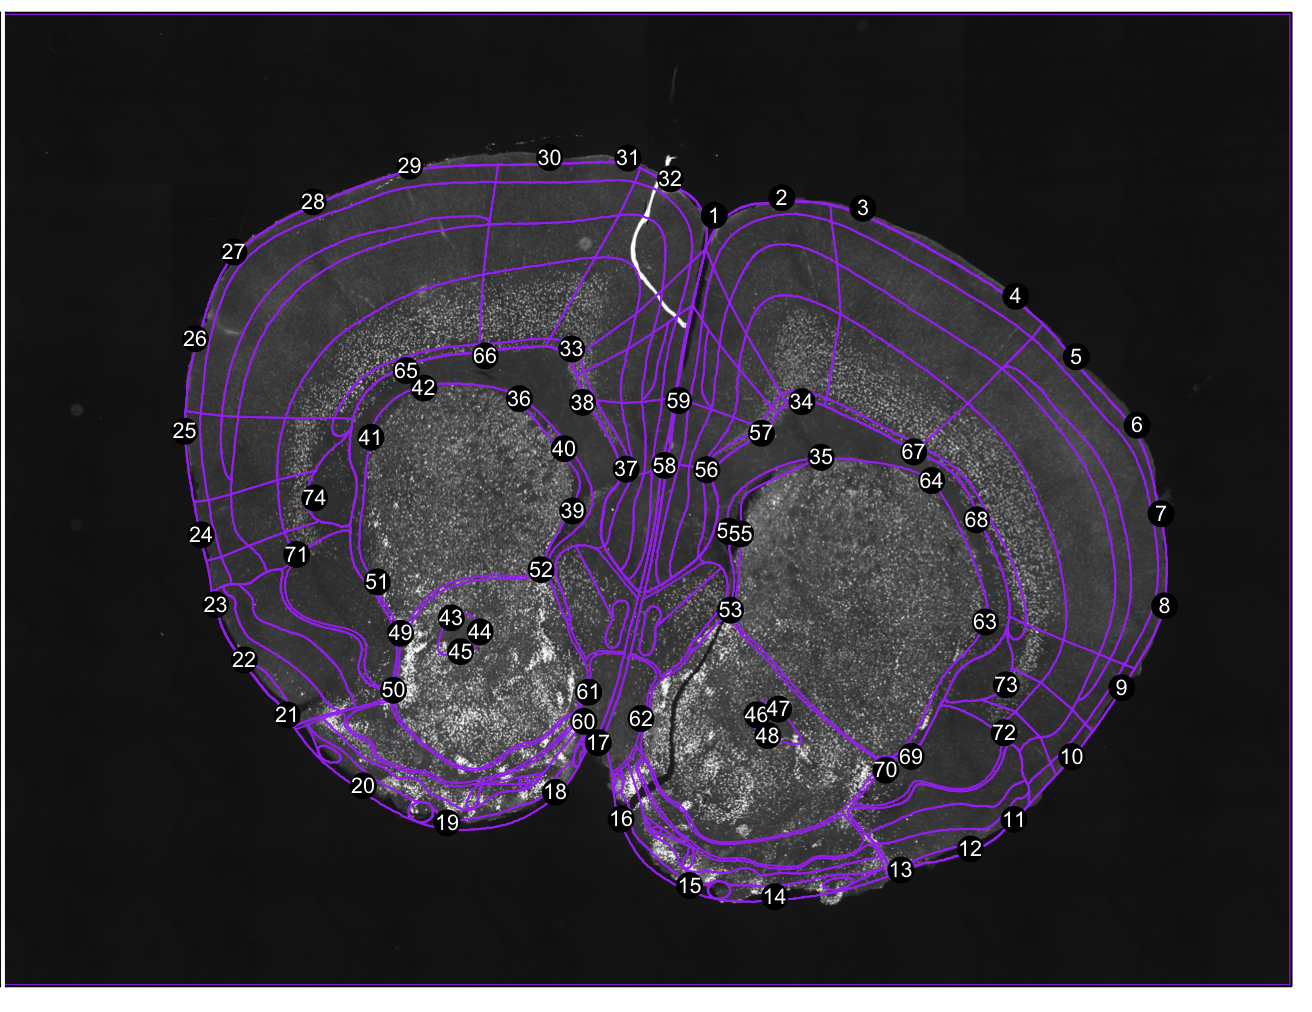 Figure 1. Correspondance points. Edit them with change.corrpoints(), add more points with add.corrpoints(), remove them with remove.corrpoints().
Get cell counts as well as stereotactic coordinates of each cell and display the results.
#get cell counts in regions as well as stereotactic coordinates while inspecting registration results
dataset<-inspect.registration(regi, seg, forward.warps = TRUE)
# try get.cell.ids() to just get the cell dataset object without plotting registration results.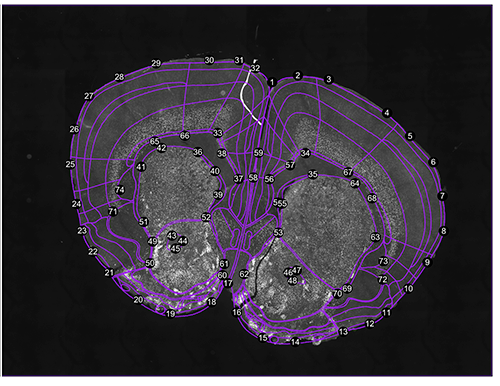
Figure 2. Registration result. Both a forward warp and a backward warp is generated by thin-plate splines.
Write web-based interactive map of your tissue section.
#set pixel resolution in microns
pixel.resolution<-0.64
#name of channel imaged
protein <- "EGFP"
#make a web map output of your result
makewebmap(images[1],
seg$filter,
registration = regi,
dataset = dataset,
scale = pixel.resolution,
fluorophore = protein
)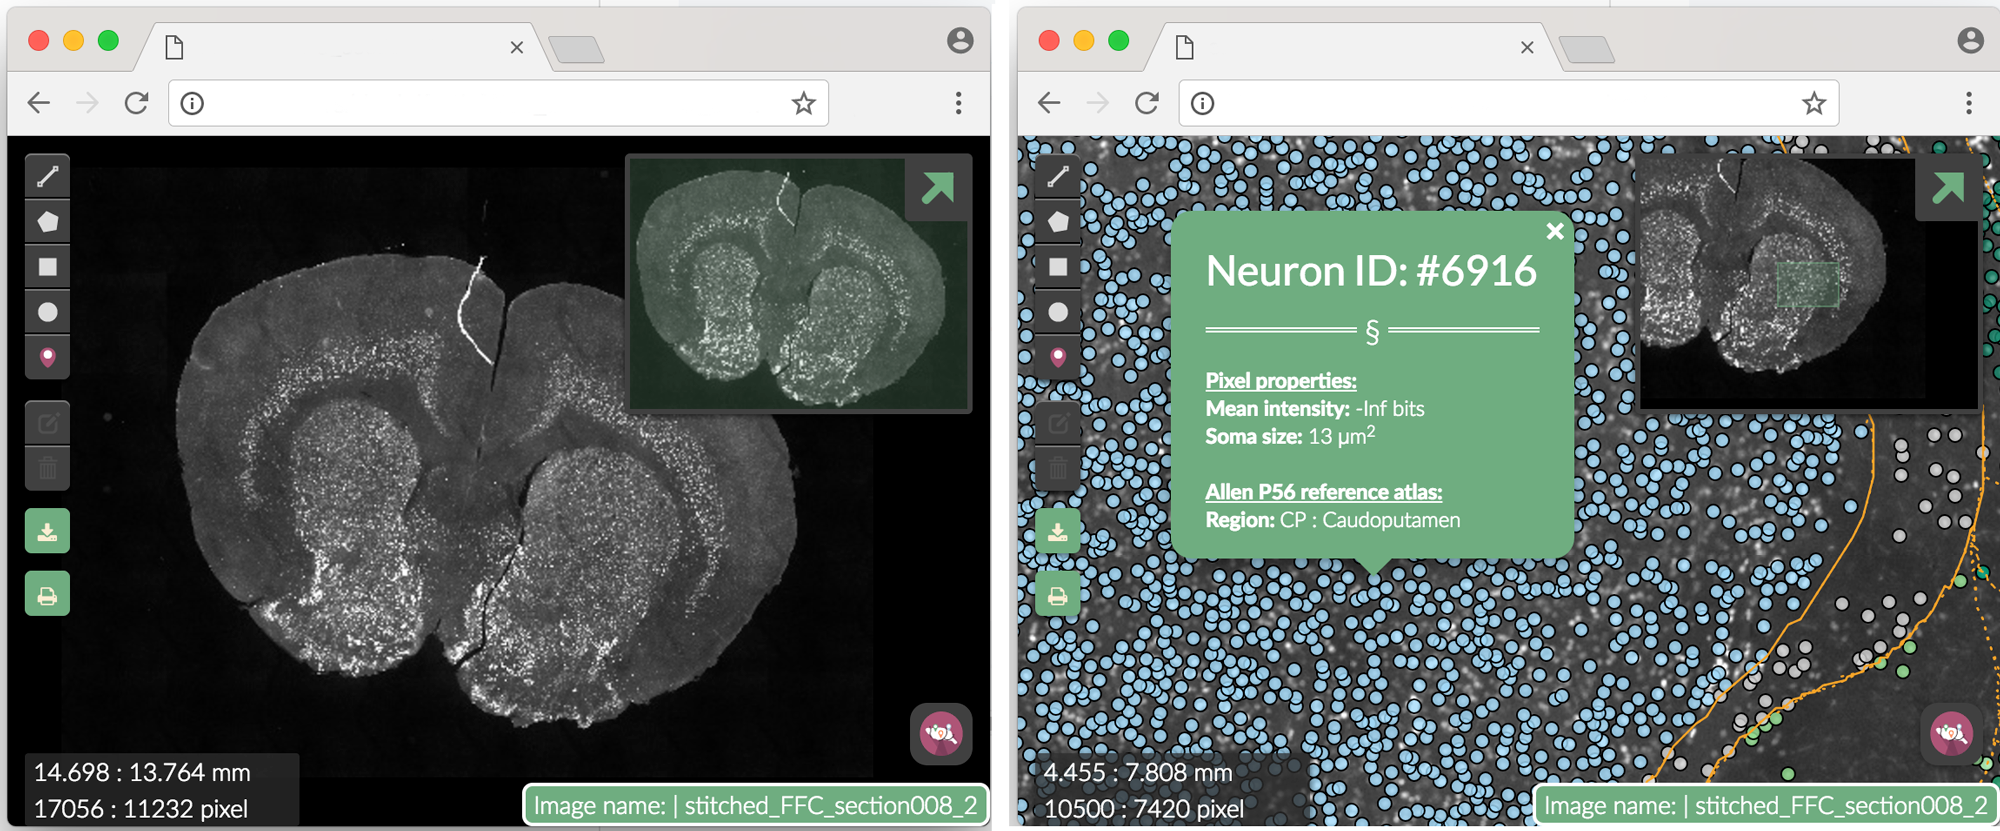 Figure 3. Webmap. Clicking on a single segmented neuron shows more info. The Neuron ID number corresponds to the row in dataset where the neuron can be found.
Some plotting
Plot schematic with cells and their position:
schematic.plot(dataset,
title=FALSE,
scale.bar=TRUE,
mm.grid=FALSE,
pch=21,
col=gray(0.1),
dev.size=c(13.54595, 10.65946)
)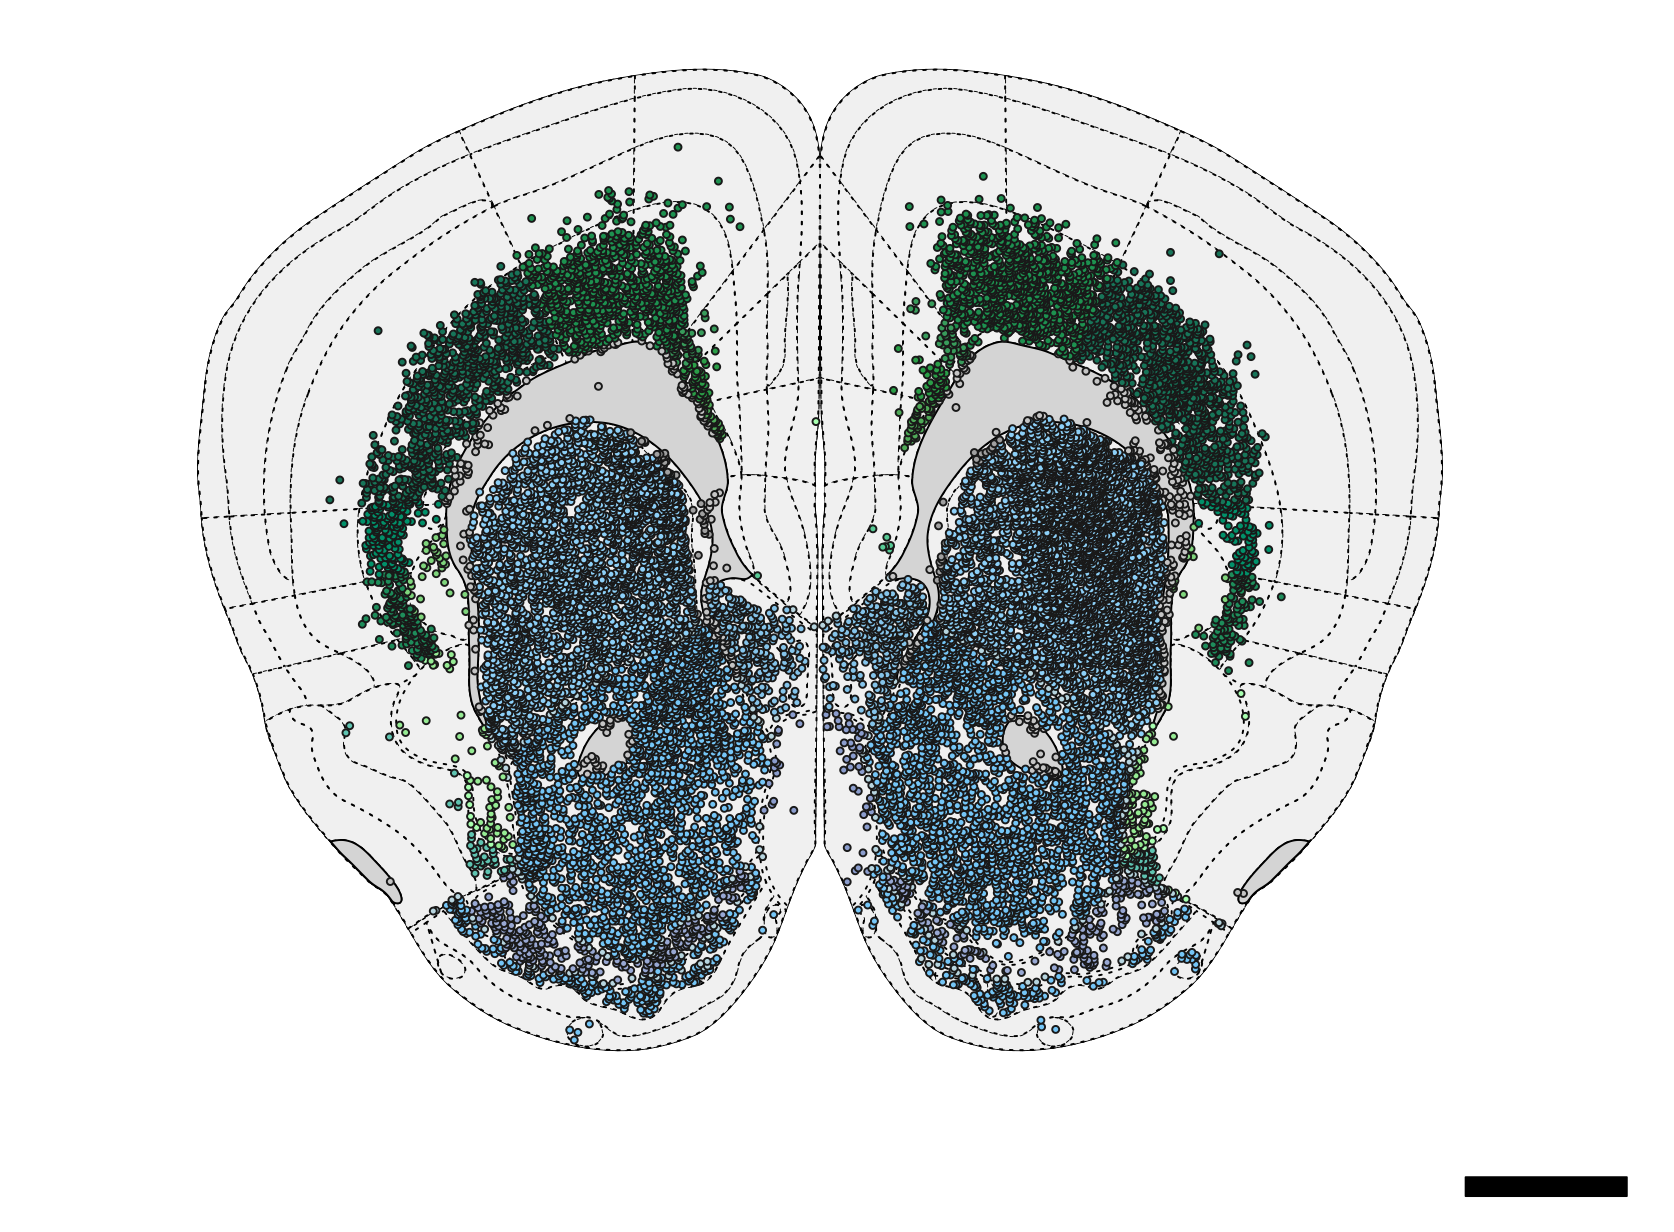 Figure 4. Schematic plot of neurons.
Examine cell counts in a single section:
dot.plot(dataset, region.lab='FoxP2 positive regions:')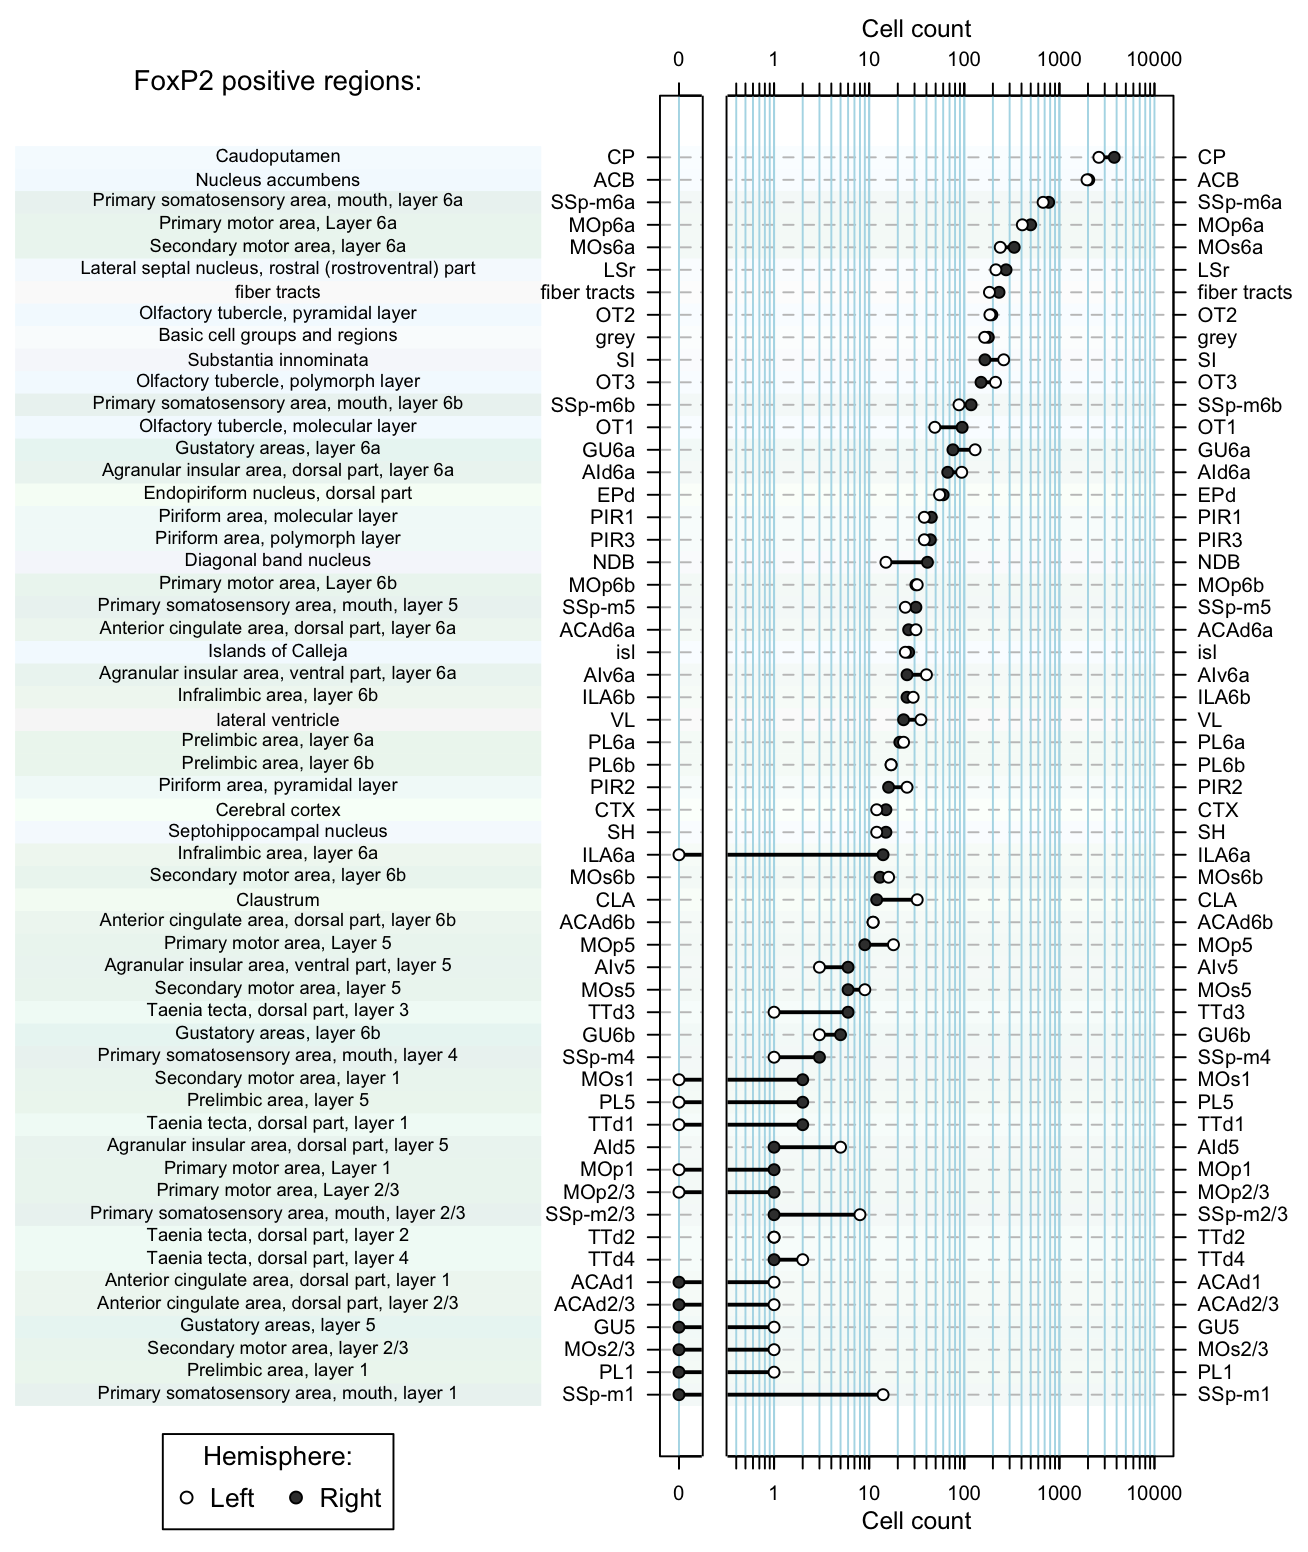 Figure 5. Dot plot of cell counts per region as afunction of hemisphere.


