Giter Site home page Giter Site logo

wavelets's Introduction

Continuous wavelet transforms in Python.

A Clean Python implementation of the wavelet analysis outlined in Torrence and Compo (BAMS, 1998)

random data

Usage

from wavelets import WaveletAnalysis

# given a signal x(t)
x = np.random.randn(1000)
# and a sample spacing
dt = 0.1

wa = WaveletAnalysis(x, dt=dt)

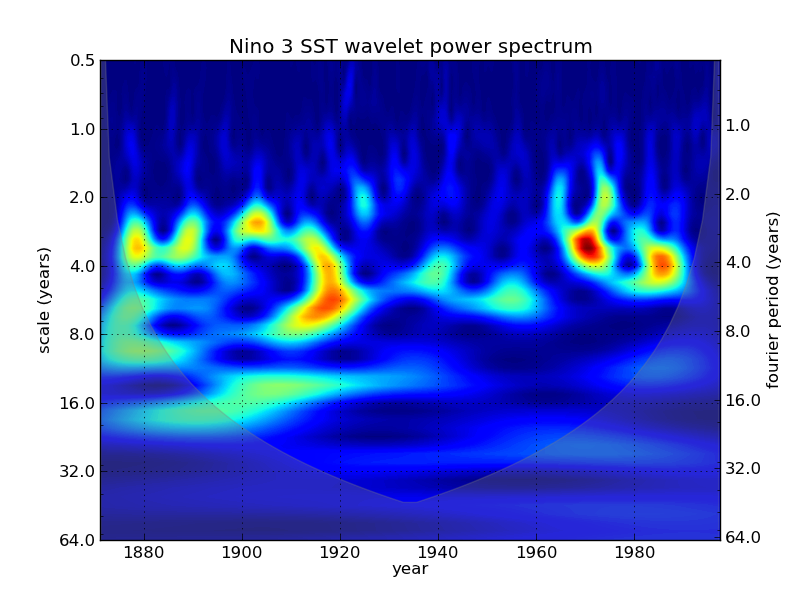
# wavelet power spectrum
power = wa.wavelet_power

# scales 
scales = wa.scales

# associated time vector
t = wa.time

# reconstruction of the original data
rx = wa.reconstruction()

How would you plot this?

import matplotlib.pyplot as plt

fig, ax = plt.subplots()
T, S = np.meshgrid(t, scales)
ax.contourf(T, S, power, 100)
ax.set_yscale('log')
fig.savefig('test_wavelet_power_spectrum.png')

See the tests for more plotting examples.

What wavelet functions can I use?

The default is to use the Morlet. The Ricker (aka Mexican hat, aka Marr) is also available.

You can write your own wavelet functions, in either time or frequency. Just follow the example of Morlet in the source.

You specify the function to use when starting the analysis:

from wavelets import Ricker

wa = WaveletAnalysis(data=x, wavelet=Ricker(), dt=dt)

Installation

pip install git+https://github.com/aaren/wavelets

or install from a local copy:

git clone https://github.com/aaren/wavelets.git
cd wavelets
pip install -r requirements.txt
python setup.py install
# Optional: Run testsuite
pip install -r test-requirements.txt
nosetests

Requirements

  • Python 2.7+ / 3.4+ (other versions might work but have not been tested)
  • Numpy (developed with 1.7.1)
  • Scipy (developed with 0.12.0)

Scipy is only used for signal.fftconvolve and optimize.fsolve, and could potentially be removed.

License

The MIT License (MIT)

Copyright (c) 2013 Aaron O'Leary ([email protected])

Permission is hereby granted, free of charge, to any person obtaining a copy of this software and associated documentation files (the "Software"), to deal in the Software without restriction, including without limitation the rights to use, copy, modify, merge, publish, distribute, sublicense, and/or sell copies of the Software, and to permit persons to whom the Software is furnished to do so, subject to the following conditions:

The above copyright notice and this permission notice shall be included in all copies or substantial portions of the Software.

THE SOFTWARE IS PROVIDED "AS IS", WITHOUT WARRANTY OF ANY KIND, EXPRESS OR IMPLIED, INCLUDING BUT NOT LIMITED TO THE WARRANTIES OF MERCHANTABILITY, FITNESS FOR A PARTICULAR PURPOSE AND NONINFRINGEMENT. IN NO EVENT SHALL THE AUTHORS OR COPYRIGHT HOLDERS BE LIABLE FOR ANY CLAIM, DAMAGES OR OTHER LIABILITY, WHETHER IN AN ACTION OF CONTRACT, TORT OR OTHERWISE, ARISING FROM, OUT OF OR IN CONNECTION WITH THE SOFTWARE OR THE USE OR OTHER DEALINGS IN THE SOFTWARE.

wavelets's People

Contributors

aaren avatar endolith avatar ulikoehler avatar

Stargazers

 avatar  avatar  avatar  avatar  avatar  avatar  avatar  avatar  avatar  avatar  avatar  avatar  avatar  avatar  avatar  avatar  avatar  avatar  avatar  avatar  avatar  avatar  avatar  avatar  avatar  avatar  avatar  avatar  avatar  avatar  avatar  avatar  avatar  avatar  avatar  avatar  avatar  avatar  avatar  avatar  avatar  avatar  avatar  avatar  avatar  avatar  avatar  avatar  avatar  avatar  avatar  avatar  avatar  avatar  avatar  avatar  avatar  avatar  avatar  avatar  avatar  avatar  avatar  avatar  avatar  avatar  avatar  avatar  avatar  avatar  avatar  avatar  avatar  avatar  avatar  avatar  avatar  avatar  avatar  avatar  avatar  avatar  avatar  avatar  avatar  avatar  avatar  avatar  avatar  avatar  avatar  avatar  avatar  avatar  avatar  avatar  avatar  avatar  avatar  avatar

Watchers

 avatar  avatar  avatar  avatar  avatar  avatar  avatar  avatar  avatar  avatar  avatar  avatar  avatar  avatar  avatar  avatar  avatar  avatar  avatar

wavelets's Issues

Power not correctly scaled with dt

Hi Aaren,

first of all thanks a lot for this awesome clean implementation, it's a pleasure to use!
I realized yesterday that somehow my power values where off quite a lot (using unbias=True), which I was able to fix by just scaling the powers by dt. I am not sure where one would need to fix this ideally within the library (maybe some other values are affected as well?) otherwise I would have raised a pr directly ;-).

Greetings

A program error that can cause "IndexError: only integers, ...... are valid indices"

my program is as follows:

    x, _ = librosa.core.load(dataset_path + "test.wav", sr=16000, mono=True)
    x = x[26000:40000]
    wa = WaveletAnalysis(sig, dt=0.1)
    print(wa.reconstruction().shape)

An error occurred during runtime:

  File "\wavelets\transform.py", line 85, in cwt
    return cwt_time(data, wavelet, widths, dt, axis)
  File "\wavelets\transform.py", line 105, in cwt_time
    wavelet_data[slices],
IndexError: only integers, slices (`:`), ellipsis (`...`), numpy.newaxis (`None`) and integer or boolean arrays are valid indices

Because there is an error in your source code, as shown below,

def cwt_time(data, wavelet, widths, dt, axis):
    # wavelets can be complex so output is complex
    ......
        wavelet_data = norm * wavelet(t, width)
        output[ind, :] = scipy.signal.fftconvolve(data,
                                                  wavelet_data[slices],
                                                  mode='same')
    return output

it should be corrected in this way. Obviously, the sequence value operation is missing:

def cwt_time(data, wavelet, widths, dt, axis):
    # wavelets can be complex so output is complex
    ......
        wavelet_data = norm * wavelet(t, width)
        output[ind, :] = scipy.signal.fftconvolve(data,
                                                  wavelet_data[slices[axis]],
                                                  mode='same')
    return output

Usage example fails

The usage example given in README.md fails on the line

power = wa.wavelet_power

with the error

ValueError: could not broadcast input array from shape (1042) into shape (1000)

Python version is 2.7.3, numpy version is 1.7.1, scipy version is 0.10.1.

Can't accurately compute C_d for an arbitrary wavelet.

Example code:

from wavelets import WaveletAnalysis
wa = WaveletAnalysis()

# hard coded Morlet value
print wa.C_d
print wa.wavelet.C_d

# override hard coding
wa.wavelet.C_d = None
# Now C_d is explicitly computed
print wa.C_d

The explicitly computed version is giving me a value of (0.13708 + 0j), rather than the 0.776 that we expect for a Morlet with w0 = 6 (which is the default).

set the scales by setting the fourier periods

Allow this behaviour:

wt.fourier_periods = array_of_periods

The scales of a transform can currently be set by

wt = WaveletTransform(data)
wt.scales = array_of_scales

The equivalent fourier period is available as a property wt.fourier_periods,
however we can't set the scales via the fourier_periods. This would be useful
as the equivalent fourier period allows us to compare wavelets.

memory issue

Hi, Thank you so much for creating such a nice wavelet package! Did you happen to have a problem with wavelet power calculation for large time series data? it seems there is a memory leakage problem. Thanks!

THIS REPO IS ABANDONED

@aaren hasn't done anything on Github since 2017?

There are a billion forks implementing the same factorial changes:

image

@joschaschmiedt has accepted a PR from another user. Are you the de facto canonical copy now?

scales not exactly correct?

Hi,
I am currently looking/ comparing different wavelet packages

have to say yours is a very nice package.

however there may be an issue in the correct calculation of the scaling.
In the standard Torrence/Compo wavelet package the default minimum scale (j0) is set to 2

Now according to your code (transform.py line 321) you should do the same (if I understood correctly)

However if I set dt =1 i get s0 = 1.93602661839, NOT 2.0!

Is that a mistake/ a rounding error coming from how you calculate s0 ?

I am using the python code hosted here for comparison (and the idl code also)
http://atoc.colorado.edu/research/wavelets/software.html

I mean, the result is overall the same, but the scales are slightly shifted, which is annoying.

More wavelet functions

Currently there is only Morlet and Ricker.

Extend Ricker to general Derivative of Gaussian.

Add Paul

Add Shannon.

Allow selection of scales for reconstruction

We can reconstruct the input data from the wavelet transform. By reconstructing using a non complete set of scales we can effectively filter the data to look at variation at the scales of interest.

Currently we get the reconstruction from the reconstruction() method of WaveletAnalysis. Add an argument to the method that specifies the scales to use.

How is Fourier wavelength derived?

Hi Aaren,

I am trying to compare your code with PyWavelet. My main objective is adding cone of influence visualisation for CWT in PyWavelet. I am using your bias example with three frequencies. I am using expression for COI taken from Table 1 in Torrence and Combo and I am computing my frequencies using scale2frequencies from PyWavelet which uses scaled central frequency and I additionally scale it by sampling period.

The picture I am getting is close to what I expect but not quite. COI is over-predicted which I think is due to the Fourier wavelength calculation or frequency-scale relationship. Could you perhaps tell me how Fourier wavelength is derived?

cwt

Where is WaveletAnalysis?

I found this project today. I tried to run test_wavelets.py at first. But it didn't work because I couldn't find function named WaveletAnalysis. If you know the solution, please teach me that. If I find the solution before you reply this comment, I'll delete this.

Recommend Projects

  • React photo React

    A declarative, efficient, and flexible JavaScript library for building user interfaces.

  • Vue.js photo Vue.js

    🖖 Vue.js is a progressive, incrementally-adoptable JavaScript framework for building UI on the web.

  • Typescript photo Typescript

    TypeScript is a superset of JavaScript that compiles to clean JavaScript output.

  • TensorFlow photo TensorFlow

    An Open Source Machine Learning Framework for Everyone

  • Django photo Django

    The Web framework for perfectionists with deadlines.

  • D3 photo D3

    Bring data to life with SVG, Canvas and HTML. 📊📈🎉

Recommend Topics

  • javascript

    JavaScript (JS) is a lightweight interpreted programming language with first-class functions.

  • web

    Some thing interesting about web. New door for the world.

  • server

    A server is a program made to process requests and deliver data to clients.

  • Machine learning

    Machine learning is a way of modeling and interpreting data that allows a piece of software to respond intelligently.

  • Game

    Some thing interesting about game, make everyone happy.

Recommend Org

  • Facebook photo Facebook

    We are working to build community through open source technology. NB: members must have two-factor auth.

  • Microsoft photo Microsoft

    Open source projects and samples from Microsoft.

  • Google photo Google

    Google ❤️ Open Source for everyone.

  • D3 photo D3

    Data-Driven Documents codes.