![]()
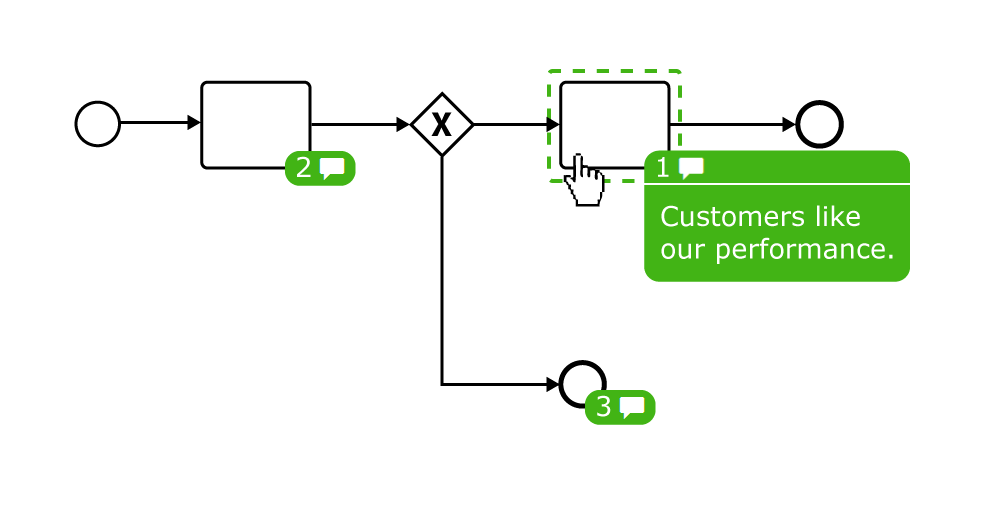
A toolbox for displaying and modifying diagrams on the web.
Some libraries / applications built on top of diagram-js:
Part of bpmn.io
- bpmn-js - A BPMN 2.0 viewer / modeler (Demo)
- cmmn-js - A CMMN 1.1 viewer / modeler (Demo)
- dmn-js - A DMN 1.3 viewer / modeler / table editor (Demo)
- Apache Seata Saga Designer - A visual orchestration tool for Seata Saga transaction (Demo)
- archimate-js - An ArchiMate diagram viewer and editor (Demo)
- chor-js - A BPMN 2.0 Choreography diagram viewer and editor (Demo)
- Node Sequencer - A Node-Based Sequencer for the Web (Demo)
- object-diagram-js - An object diagram viewer and editor (Demo)
- postit-js - Create Post-it boards on a canvas editor (Demo)
Prepare the project by installing all dependencies:
npm installThen, depending on your use-case you may run any of the following commands:
# build the library and run all tests
npm run all

# run the development setup
npm run dev

# run tests (single run)
npm test
Expose an environment variable TEST_BROWSERS=(Chrome|Firefox) to execute the tests in a non-headless browser.
Note
We do not generate any build artifacts. Required parts of the library should be bundled by consuming libraries as needed instead.
MIT


![dependabot[bot] avatar](https://avatars.githubusercontent.com/in/29110?v=4 "dependabot[bot]")


![renovate[bot] avatar](https://avatars.githubusercontent.com/in/2740?v=4 "renovate[bot]")