cerlymarco / tsmoothie Goto Github PK
View Code? Open in Web Editor NEWA python library for time-series smoothing and outlier detection in a vectorized way.
License: MIT License
A python library for time-series smoothing and outlier detection in a vectorized way.
License: MIT License


Hi, I have a time-series that has seasonality at certain time windows (lets call it sw) and no seasonality at other windows (lets call it nsw). I plan to pass random windows of this time-series into the smoother.
I am trying to use KalmanSmoother and is considering between:
smoother1 = ts.smoother.KalmanSmoother(component='level_trend_season',
                                       component_noise={'level':0.1, 'trend':0.1, 'season':0.1})

vs

smoother2 = ts.smoother.KalmanSmoother(component='level_trend',
                                       component_noise={'level':0.1, 'trend':0.1})
If the random window slice is sw, the smoother1 should work just fine, and at nsw cases, smoother2 should work better. However I can only use one smoother.
My question is if I pass nsw into smoother1, will it degrade performance as compared to if pass nsw to smoother2? Is the smoother1 smart enough to "ignore" the fact that nsw has no seasonality in its time-series?
Hi,
Rather a discussion point than issue: I just saw your post on MaxBenChrist/awesome_time_series_in_python#31 and I'd love to make sktime easily inter-operable with tsmoothie. Would you be interested in working on that?
Hi Marco,
I paste my code with a WindowWrapper example :
date_start='2000-01-01'
date_end='2021-01-01'
data = pdr.get_data_yahoo('AAPL', start=date_start, end=date_end)
CL = data['Close'].values
sm = []
window = 20
dzero = np.zeros((window - 1,), dtype=int)
smoother = WindowWrapper(ConvolutionSmoother(window_len=20, window_type='ones'), window_shape=window)
smoother.smooth(CL)
for i, (true, smooth) in enumerate(zip(smoother.Smoother.data, smoother.Smoother.smooth_data)):
sm.append(smooth[-1])
sig = np.append(dzero, sm, axis=0)
data['SM'] = sig
plt.plot(data['Close'])
plt.plot(data['SM'])
plt.show()
Can you confirm me that is the right way for build a smooth signal without look ahead bias ?
Sorry but python isn't my native language :)
Regards.
Ludo.
May I know on which version of SciPy does tsmoothie works upon?
I used smoothie on colab and it works fine but while deployment, I imported the code in the Anaconda environment where tsmoothie throws an error while using SciPy.
Here is the log of the error that I faced:
  File "c:/Users/sande/Documents/GitHub/Flask Model deployment MSFT/msft_2000_2021_mpn10pvcpcpr_mpn10p_lpn10p_hpn10p.py", line 15, in <module>
    import tsmoothie
  File "C:\Users\sande\anaconda3\envs\env\lib\site-packages\tsmoothie\__init__.py", line 2, in <module>
    from .utils_func import *
  File "C:\Users\sande\anaconda3\envs\env\lib\site-packages\tsmoothie\utils_func.py", line 6, in <module>
    import scipy.stats as stats
  File "C:\Users\sande\anaconda3\envs\env\lib\site-packages\scipy\stats\__init__.py", line 388, in <module>
    from .stats import *
  File "C:\Users\sande\anaconda3\envs\env\lib\site-packages\scipy\stats\stats.py", line 174, in <module>
    from scipy.spatial.distance import cdist
  File "C:\Users\sande\anaconda3\envs\env\lib\site-packages\scipy\spatial\__init__.py", line 98, in <module>
    from .qhull import *
ImportError: DLL load failed: The specified module could not be found.
Great package, could you perhaps provide a label to indicate whether a specific method can be used for data transformations (features), the reason I am asking is that some smoothers/filters are forward looking and would cause a forward looking bias. Tahnsk again :)
Hi:
Appreciate for good project about time series smoothing tsmoothie!
However, is there any possible documentation explaining all these algorithm and hyperparameters setting within the package? Sometime I don't really understand the algorithm details so I don't know which algorithm to choose as well as how to set the parameters. If there is a good documentation it will be of great help.
Thanks!
Hi Marco
I am new to Tsmootie and also Kalman filters. In a process to understand.
Have a doubt about component_noise. I have time series where daily seasonality is prominent. So mostly component noise: season= 0.1 works well (low sigma value as I am confident about daily seasonality). But I have tried values like 0.01 and 1 also for the same. I want to know is there any valid limits/ range for the sigma values of component_noise? i.e. 0 to 1 (0 to 100%) etc.
Hello, I'm new to tsmoothie. My time series has missing values in it. I'd like to find a way to best estimate missing data, possibly using smoothing and bootstrapping. So far, it seems only Kalman filter can work with masked data (i.e., data having NaN in it). Am I right? Thanks.
Hi,
I am trying the Spectral Smoothing with Fourier Transform on my data but received the following error, I successfully applied Kalman Smoothing without issue, what could be the problem?
---------------------------------------------------------------------------
ValueError                                Traceback (most recent call last)
<ipython-input-19-ad994a6784b5> in <module>()
      4
      5 # generate intervals
----> 6 low, up = smoother.get_intervals('sigma_interval')
      7
      8 # plot the first smoothed timeseries with intervals

1 frames
/usr/local/lib/python3.7/dist-packages/tsmoothie/utils_func.py in sigma_interval(true, prediction, n_sigma)
    206     """
    207
--> 208     std = np.nanstd(true - prediction, axis=1, keepdims=True)
    209
    210     low = prediction - n_sigma * std

ValueError: operands could not be broadcast together with shapes (1,3175) (1,3174)
Marco, thanks for the excellent project! You've made a great effort combining all the smoothing theories in one single, easy-to-use library! I couldn't thank you enough!
I stumbled upon a rounding math problem today on the "prediction_interval" function. This problem is actually not on your code, but instead on how Numpy chooses to round floating numbers on the numpy.sum method:
For floating point numbers the numerical precision of sum (and np.add.reduce) is in general limited by directly adding each number individually to the result causing rounding errors in every step. However, often numpy will use a numerically better approach (partial pairwise summation) leading to improved precision in many use-cases. This improved precision is always provided when no axis is given. When axis is given, it will depend on which axis is summed. Technically, to provide the best speed possible, the improved precision is only used when the summation is along the fast axis in memory. Note that the exact precision may vary depending on other parameters. In contrast to NumPy, Python’s math.fsum function uses a slower but more precise approach to summation. Especially when summing a large number of lower precision floating point numbers, such as float32, numerical errors can become significant. In such cases it can be advisable to use dtype=”float64” to use a higher precision for the output.
This only occurred with a very particular set of numbers while using the LowessSmoother, which ended up with a negative value that caused an excepetion on the square root later on:
mse = (np.square(resid).sum(axis=1, keepdims=True) / (N - d_free)).T
....
predstd = np.sqrt(predvar).T
tsmoothie\utils_func.py:306: RuntimeWarning: invalid value encountered in sqrt
Quick solution first:
mse = (np.square(resid).sum(axis=1, dtype="float64", keepdims=True) / (N - d_free)).T
Adding the dtype parameter solved the problem. This causes numpy to increase rounding precision (as stated above) which ended up giving me the correct result.
Quick observation: As yet, I'm not quite sure on how adding dtype might affect speed and performance on all the other smoother methods, but I will have to check on this eventually.
Explanation and info:
While calling Lowess Smother method, setting the iterations parameter to any value greater than 1 caused the rounding numpy problem on the following set of data:
data[6318, 36871, 39933, 22753, 9680, 6503, 4032, 2733, 2807, 2185, 1866, 1800, 1907, 1537, 1357, 1221, 1354, 1514, 2021, 11110, 17656, 17397, 24385, 22361, 18709, 20201, 20245, 25767, 21345, 18928, 20958, 20425, 23066, 20221, 18756, 17403, 17843, 21201, 25867, 17342, 16815, 5700, 25897, 20891, 20022, 22291, 24334, 21304, 25328, 22201, 20308, 21539, 29637, 22740, 19510, 18959, 21160, 23520, 20574, 16519, 18779]
Problem occurs at data[-3]. The problem doesn't occur when I cut the rest out:
data[0:len(data)-3]
At that point, the total sum causes numpy's rounding to go berserk, I imagine.
This ends up calling the square root exception above, which in turn causes your "prediction_interval" function to return an array of NaN results:
[[nan nan nan nan nan nan nan nan nan nan nan nan nan nan nan nan nan nan nan nan nan nan nan nan nan nan nan nan nan nan nan nan nan nan nan nan nan nan nan nan nan nan nan nan nan nan nan nan nan nan nan nan nan nan nan nan nan nan nan nan nan]] [[nan nan nan nan nan nan nan nan nan nan nan nan nan nan nan nan nan nan nan nan nan nan nan nan nan nan nan nan nan nan nan nan nan nan nan nan nan nan nan nan nan nan nan nan nan nan nan nan nan nan nan nan nan nan nan nan nan nan nan nan nan]]
Variable "mse" without dtype outputs:
[[-35780673.18644068]]
And after including dtype:
[[35780673.18644068]]
Other important parameters I used to help you check this were:
Prediction: prediction_interval
Confidence: 0.05
Smooth Fraction: 0.3
Batch Size: None
Didn't use a WindowWrapper
For this project I'm stuck with iterations between 5 and 6 and no Batch Size, I need to smooth the entire data together.
By the way, I think there something going on with the batch_size parameter also, but I haven't got time to look at it yet.
Thanks again for the great project!! Keep up the good work!!
pip install --upgrade tsmoothie -i https://pypi.tuna.tsinghua.edu.cn/simple
Hi Marco! Thank you for an awesome package!
I have a quick question for you. Since you're obviously well-rehearsed in time-series smoothing, which particular smoother will you recommend as a default option?
In particular, I have a training series y_train (which is potentially very short, <50 observations), and I use some univariate forecasting model to forecast H-periods ahead, resulting in an H-dim vector y_hat. Since my training vector is not always very long, some flexible methods give me crazy results for y_hat, which I want to reset to some sensible value.
I could do, for instance,
# Instantiate smoother
smoother = ConvolutionSmoother(window_len=0.1*len(y_train), window_type='ones')
smoother.smooth(pd.concat([y_train, y_hat], axis=0)

# Get threshold
threshold_lower, threshold_upper = smoother.get_intervals('sigma_interval', n_sigma=2)

# Subset to match length
threshold_lower = threshold_lower[0,-len(y_hat):]
threshold_upper = threshold_upper[0,-len(y_hat):]
and then use these thresholds. Do you have any recommendations in this setup?
Hi @cerlymarco
I got a short question about the Bootstrapping Algo: Is it possible to use the BootstrappingWrapper without a smoother? I am currently trying to implement a Wild-Block-Bootstrapp to generate synthetic Data for a Time-Series (Stock-Returns).
Best regards,
Mischkoni
I see the origin code, while call smoother function, the parameters of batch_size only for column, I wish it will be work at row.
Hi, thanks for this library.
Is it possible to vectorize across multiple dimensions? So a generic N dimensions (..., ..., ..., ..., , timesteps), currently it is limited to (series, timesteps). This would be useful to apply to multivariate time-series problems as well as deep learning applications where there is a batch_size. This should be fairly straight forward using PyTorch (actually even doable with numpy). Would there be a computation limitation?
smoother-->regression_basis.gaussian_kernel(line 119),
is it should be "X_base = - np.square(X[:, None] - knots) / (2 * sigma ** 2)" ?
This is a great library, thanks a lot! I have a question, is there a way to extend the smooth/CI past the data domain? See the below plot, aesthetically I would like the smooth regions to go to the edges of the graph region....

hi!Thank you very much for your work!
Exponential smoothing is simple exponential smoothing;holt exponential smoothing or holt winters?
或者可以提供一下思路,这是否可行
Hello. Thanks for this great library.
I need to detrend a time series for usage with an ML forecasting model. The most important step is to isolate the trend. I've tried dozens of strategies and all of the ones that produce a smooth and accurate trend line (e.g., HP filter, STA, fitting a polynomial model, etc) introduce look-ahead bias in the data. Then there are the moving average strategies which do not introduce look-ahead bias but the trend line is either too laggy (if we set a large look-behind period) or too choppy (if we set a small look-behind period).
Do you think I could use any of your smoothers to isolate the trend without introducing any kind of lookahead bias? I'm thinking that a heavily smoothed version of the time series could be a good representation of the trend, then I'd just have to subtract the trend from the series. By "not introducing any kind of lookahead bias", I mean that it should:
Thank you!
When I use the WindowWrapper in combination with LowessSmoother, like in the notebook example, I obtain the desired output (NxM numpy array, where N=samples and M=window size). However, when I use WindowWrapper with ExponentialSmoother i get a Nx1 numpy array.
Is this because ExponentialSmoother is an online-ready algorithm?
code:
https://ibb.co/GdBtWJv
Hi Marco
First thank you for your python package !
Among all the smoother of the package which one is casual ? or are they all no casual ?
Regards
Ludo
Would you consider the possibility of making it compatible with sklearn using fit and transform instead of smooth?
Is there a specific reason why you save the transformed data as an instance attribute? (this would be against the sklearn API)
I am thinking of doing it myself for a project I am working on but I wanted to ask you first if I missed anything obvious that would make this difficult or not possible.
Many thanks
Hi Marco,
Thanks for creating this very useful package!
Say I'm collecting data from a sensor over a set of time periods (24 hours) in two replicates. That means I have data from two different copies of the same type of sensor placed at the same place. Because of some experimental noise, we see some variation between values. My data looks like this, green is from one sensor, and the red is from other
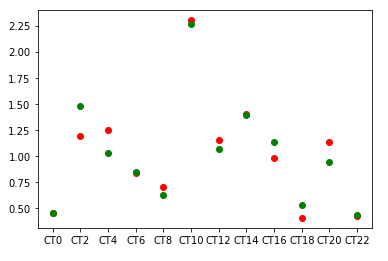
When I use my data in a smoother function, like a nested np array
smoother = LowessSmoother(smooth_fraction=0.1, iterations=1)
smoother.smooth(np.array([np.array(replicate1), np.array(replicate 2)]))
smoother.smooth_data has two arrays in a nested array, one for each replicate. How do I get a single value for each time point after fitting a curve?
Thanks for developing this library. This is a pretty interesting one. I have a question when using tsmoothie as follows.
Currently I am using an (unsupervised) clustering method to create a model once on a large amount of data (that, assigns inlier and outlier labels) and then query the model repeatedly with small amounts of new data to predict the label (to infer anomaly).
I am planning to use tsmoothie for filtering the noise in the large input data which will be subject to clustering to assign inlier and outlier labels . Later when I use new data points for predicting the normal or anomaly label, I should smooth that also before prediction. Is that correct?
A declarative, efficient, and flexible JavaScript library for building user interfaces.
🖖 Vue.js is a progressive, incrementally-adoptable JavaScript framework for building UI on the web.
TypeScript is a superset of JavaScript that compiles to clean JavaScript output.
An Open Source Machine Learning Framework for Everyone
The Web framework for perfectionists with deadlines.
A PHP framework for web artisans
Bring data to life with SVG, Canvas and HTML. 📊📈🎉
JavaScript (JS) is a lightweight interpreted programming language with first-class functions.
Some thing interesting about web. New door for the world.
A server is a program made to process requests and deliver data to clients.
Machine learning is a way of modeling and interpreting data that allows a piece of software to respond intelligently.
Some thing interesting about visualization, use data art
Some thing interesting about game, make everyone happy.
We are working to build community through open source technology. NB: members must have two-factor auth.
Open source projects and samples from Microsoft.
Google ❤️ Open Source for everyone.
Alibaba Open Source for everyone
Data-Driven Documents codes.
China tencent open source team.