Giter Site home page Giter Site logo

cytoscape / ipycytoscape Goto Github PK

View Code? Open in Web Editor NEW
263.0 29.0 62.0 2.82 MB

A Cytoscape Jupyter widget

Home Page: https://ipycytoscape.readthedocs.io/en/master/

License: BSD 3-Clause "New" or "Revised" License

CSS 0.16% Python 73.38% JavaScript 4.54% TypeScript 21.93%
cytoscape jupyter-notebook binder

ipycytoscape's Introduction

ipycytoscape

Tests Documentation Status StackOverflow Join the chat at https://gitter.im/QuantStack/Lobby

A widget enabling interactive graph visualization with cytoscape.js in JupyterLab and the Jupyter notebook.

Try it out using binder: Binder or install and try out the examples.

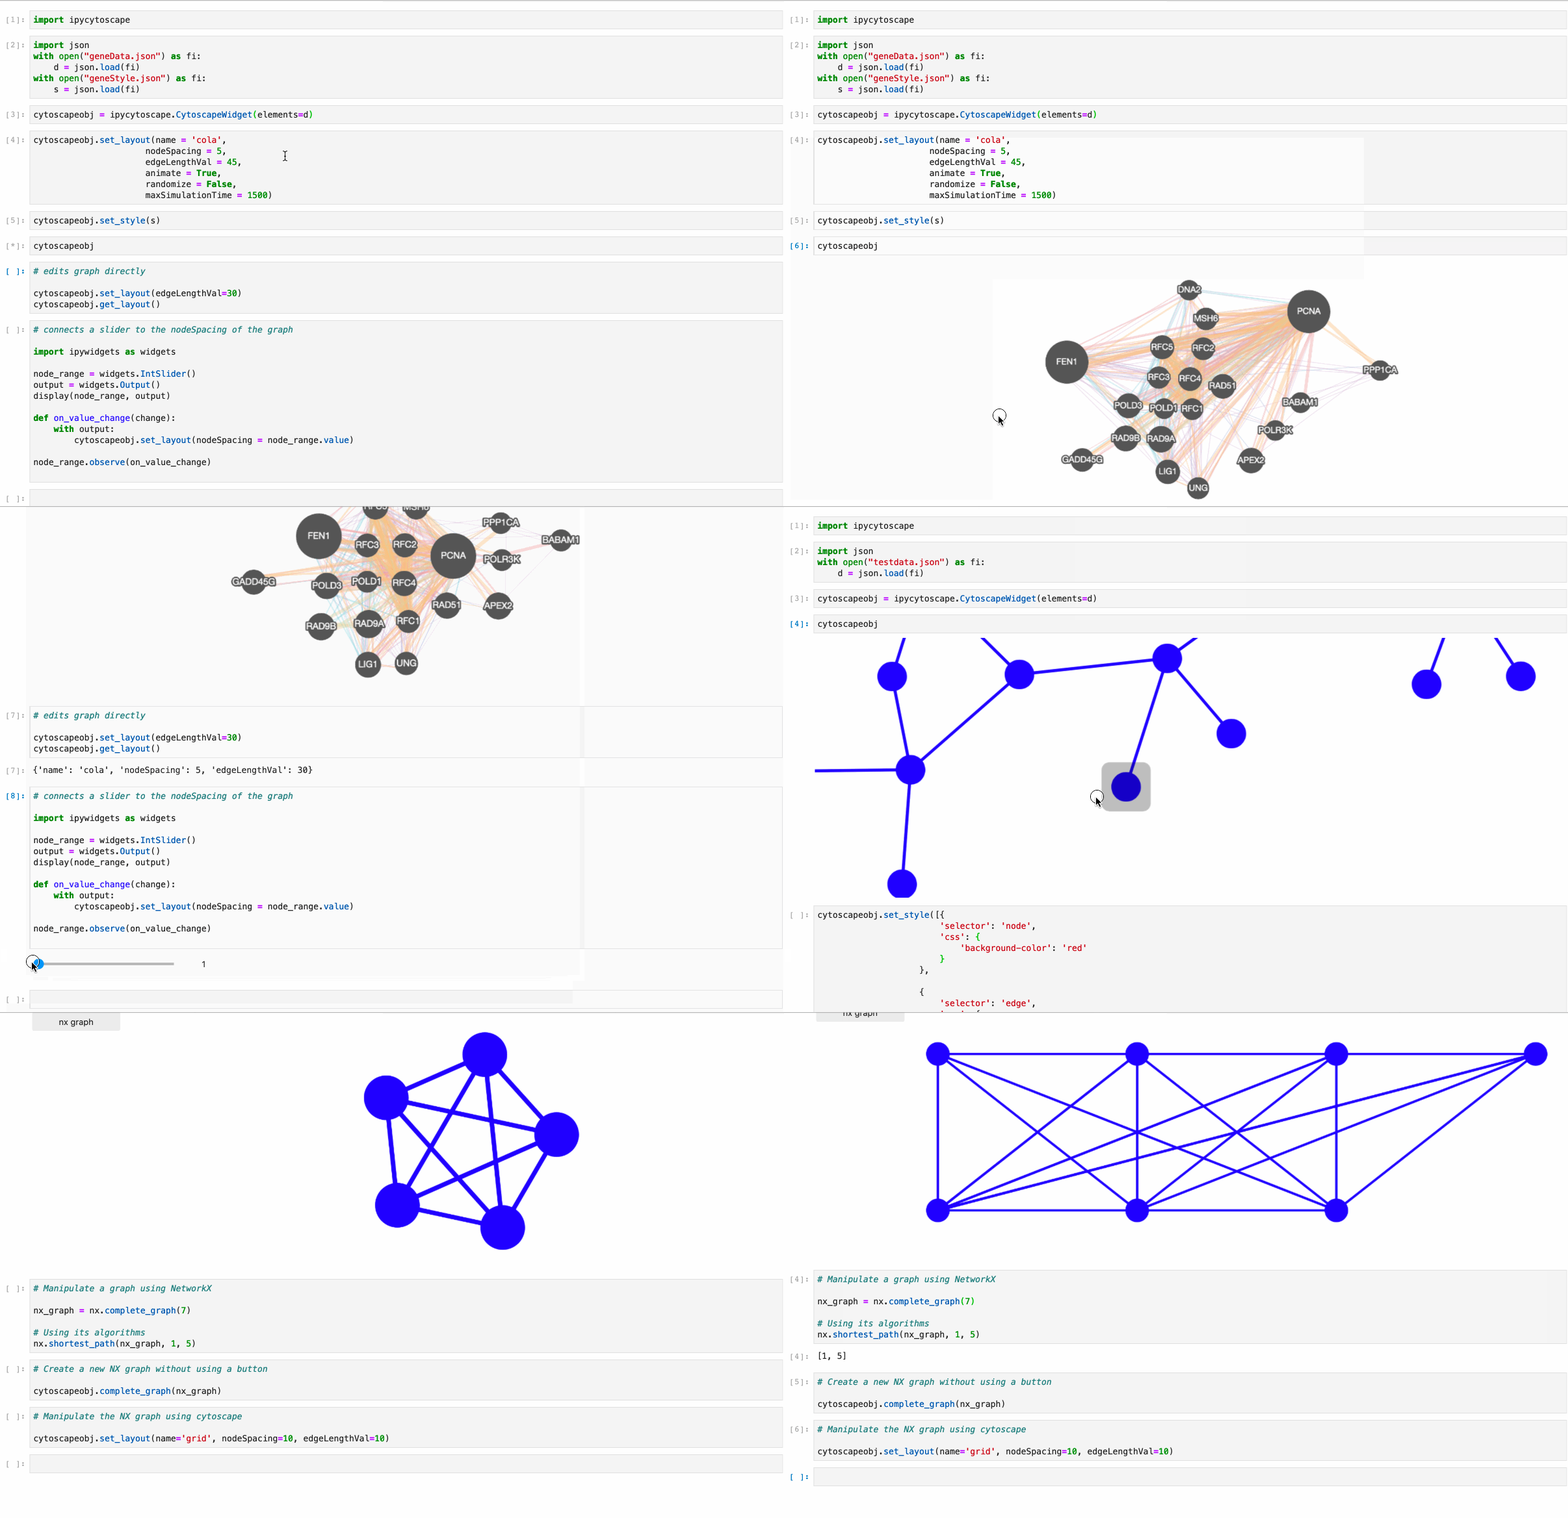
cytoscape screencast

Supports:

Installation

With mamba:

mamba install -c conda-forge ipycytoscape

With conda:

conda install -c conda-forge ipycytoscape

With pip:

pip install ipycytoscape

Pandas installation

You can install the Pandas dependencies for ipycytoscape with pip:

pip install pandas

Or conda-forge:

mamba install pandas

Neo4j installation

You can install the neo4j dependencies for ipycytoscape with pip:

pip install -e ".[neo4j]"

Or conda-forge:

mamba install py2neo neotime

For jupyterlab 1.x or 2.x:

If you are using JupyterLab 1.x or 2.x then you will also need to install nodejs and the jupyterlab-manager extension. You can do this like so:

# installing nodejs
conda install -c conda-forge nodejs


# install jupyterlab-manager extension
jupyter labextension install @jupyter-widgets/[email protected] --no-build

# if you have previously installed the manager you still to run jupyter lab build
jupyter lab build

For Jupyter Notebook 5.2 and earlier

You may also need to manually enable the nbextension:

jupyter nbextension enable --py [--sys-prefix|--user|--system] ipycytoscape

For a development installation:

(requires npm)

While not required, we recommend creating a conda environment to work in:

conda create -n ipycytoscape -c conda-forge jupyterlab nodejs
conda activate ipycytoscape

# clone repo
git clone https://github.com/cytoscape/ipycytoscape.git
cd ipycytoscape

Install python package for development

This will run npm install and npm run build. This command will also install the test suite and the docs locally:

pip install jupyter_packaging==0.7.9
pip install -e ".[test, docs]"

jupyter labextension develop . --overwrite

optionally install the pre-commit hooks with:

pre-commit install

Or for classic notebook, you can run:

jupyter nbextension install --sys-prefix --symlink --overwrite --py ipycytoscape
jupyter nbextension enable --sys-prefix --py ipycytoscape

Note that the --symlink flag doesn't work on Windows, so you will here have to run the install command every time that you rebuild your extension. For certain installations you might also need another flag instead of --sys-prefix, but we won't cover the meaning of those flags here.

How to see your changes

Typescript:

To continuously monitor the project for changes and automatically trigger a rebuild, start watching the ipycytoscape code:

npm run watch

And in a separate terminal start JupyterLab normally:

jupyter lab

once the webpack rebuild finishes refresh the JupyterLab page to have your changes take effect.

Python:

If you make a change to the python code then you need to restart the notebook kernel to have it take effect.

How to run tests locally

Install necessary dependencies with pip:

pip install -e ".[test]"

Or with conda/mamba:

mamba -c conda-forge install networkx pandas nbval pytest

And to run it:

pytest

How to build the docs

cd docs

Install dependencies:

conda env update --file doc_environment.yml

And build them:

make html

Acknowledgements

The ipycytoscape project was started by Mariana Meireles at QuantStack. This initial development was funded as part of the PLASMA project, which is led by Claire Vandiedonck, Pierre Poulain, and Sandrine Caburet.

License

We use a shared copyright model that enables all contributors to maintain the copyright on their contributions.

This software is licensed under the BSD-3-Clause license. See the LICENSE file for details.

ipycytoscape's People

Contributors

bollwyvl avatar cagtayfabry avatar dependabot[bot] avatar dhimmel avatar dreness avatar ianhi avatar jaydonnell avatar jenshnielsen avatar joseberlines avatar jtpio avatar kozo2 avatar krassowski avatar maartenbreddels avatar marimeireles avatar martinrenou avatar mriduls avatar ngthanhvinh avatar pre-commit-ci[bot] avatar pwrose avatar rmorshea avatar sandertyu avatar sevickson avatar shivam-miglani avatar stefco avatar svenschiffner avatar sylvaincorlay avatar telamonian avatar timkpaine avatar vaniisgh avatar yitzchak avatar

Stargazers

 avatar  avatar  avatar  avatar  avatar  avatar  avatar  avatar  avatar  avatar  avatar  avatar  avatar  avatar  avatar  avatar  avatar  avatar  avatar  avatar  avatar  avatar  avatar  avatar  avatar  avatar  avatar  avatar  avatar  avatar  avatar  avatar  avatar  avatar  avatar  avatar  avatar  avatar  avatar  avatar  avatar  avatar  avatar  avatar  avatar  avatar  avatar  avatar  avatar  avatar  avatar  avatar  avatar  avatar  avatar  avatar  avatar  avatar  avatar  avatar  avatar  avatar  avatar  avatar  avatar  avatar  avatar  avatar  avatar  avatar  avatar  avatar  avatar  avatar  avatar  avatar  avatar  avatar  avatar  avatar  avatar  avatar  avatar  avatar  avatar  avatar  avatar  avatar  avatar  avatar  avatar  avatar  avatar  avatar  avatar  avatar  avatar  avatar  avatar  avatar

Watchers

 avatar  avatar  avatar  avatar  avatar  avatar  avatar  avatar  avatar  avatar  avatar  avatar  avatar  avatar  avatar  avatar  avatar  avatar  avatar  avatar  avatar  avatar  avatar  avatar  avatar  avatar  avatar  avatar  avatar

ipycytoscape's Issues

new release?

With some of the recent merges I find that the master branch is substantially more useful to me than the latest release. Any chance of 0.3.0 release? It would make sharing this with some of my friends and collaborators much easier (no need to have them git clone anything...), I think it would also clear up #82

Maybe it would be worth dealing with :
#83
and #64 (comment)
before releasing a new version

Support for Notebook HTML Export

Really appreciate this project for bringing much-needed graph interactivity to Jupyter.

Was wondering if there are plans to have the graph exported properly into HTML notebook exports? Something akin to Plotly's plotly.offline.iplot(...) function. I recall needing one additional step to get interactive Plotly plots to export correctly in Jupyter Notebook HTML exports:
https://blog.matteoferla.com/2019/06/exporting-jupyter-notebooks-with-plotly.html

The target audience who would make good use of these graphs in HTML reports don't use Jupyter Notebooks and wouldn't use it as a medium to explore them. So it would be a vital feature to make available such that the exports show the analysis results for interpretation.

(And I'm not including ipywidgets interactivity here - just the graph itself as it would appear embedded in a normal HTML webpage.)

Is this doable?

Many thanks!

TypeError: null has no properties

When I try to drag and move the node in Tip gene example.ipynb using Voila it works (http://localhost:8888/voila/render/ipycytoscape/examples/Tip%20gene%20example.ipynb) but I get many JavaScript errors:

TypeError: null has no properties
44 index.js:35:60729
    headless https://unpkg.com/jupyter-cytoscape@^0.1.4/dist/index.js:35
    n https://unpkg.com/jupyter-cytoscape@^0.1.4/dist/index.js:32
    ei https://unpkg.com/jupyter-cytoscape@^0.1.4/dist/index.js:32
    boundingBox https://unpkg.com/jupyter-cytoscape@^0.1.4/dist/index.js:32
    x https://unpkg.com/jupyter-cytoscape@^0.1.4/dist/index.js:35
    findNearestElements https://unpkg.com/jupyter-cytoscape@^0.1.4/dist/index.js:35
    findNearestElement https://unpkg.com/jupyter-cytoscape@^0.1.4/dist/index.js:35
    load https://unpkg.com/jupyter-cytoscape@^0.1.4/dist/index.js:35

And one error:

TypeError: this._private.renderer is null15 index.js:35:60729
    headless https://unpkg.com/jupyter-cytoscape@^0.1.4/dist/index.js:35
    n https://unpkg.com/jupyter-cytoscape@^0.1.4/dist/index.js:32
    ei https://unpkg.com/jupyter-cytoscape@^0.1.4/dist/index.js:32
    boundingBox https://unpkg.com/jupyter-cytoscape@^0.1.4/dist/index.js:32
    x https://unpkg.com/jupyter-cytoscape@^0.1.4/dist/index.js:35
    findNearestElements https://unpkg.com/jupyter-cytoscape@^0.1.4/dist/index.js:35
    findNearestElement https://unpkg.com/jupyter-cytoscape@^0.1.4/dist/index.js:35
    load https://unpkg.com/jupyter-cytoscape@^0.1.4/dist/index.js:35

Firefox 74

Make tip visualization better

The visualization looks cramped now if you add more than one attribute to the tip. It's not possible to add line breaks. I think adding that would be enough already.

Screen Shot 2020-04-13 at 11 56 19 AM

Maybe upgrading to a new tip version will fix this.

aggregated suggestions

I want to start by saying thanks so much for this widget! I'm glad I started my current project (building and analyzing lots of graphs) now and not two months ago :) In a flurry of foolishness I was about to try to implement my own version of this widget before I found this. Which actually leads me to my first suggestion

1. more jupyter keywords

I spent an hour or so this morning searching around for the best way to visualize netowrkx graphs in jupyter notebooks and even after deciding I was interested in cytoscopejs I almost didn't find this widget. I found a few outdated widgets (e.g. this google search), but I only found this one because I searched in the jupyterlab extension manager for cytoscape. I don't know if this would affect anything but maybe more mentions of jupyterlab higher up in the readme. i.e. first sentence: A jupyter/jupyterlab widget for displaying ... could help with easier discovery of this repo.

2. Add a default style for directed graphs

I would be nice if I could give an argument to the constructor of the widget specifying that my graph was directed, and this would add the appropriate elements to the style add arrows to the edges.

3. link to examples directory in the README

I figured out how to style a directed graph by looking at JSON example. Leading people to this from the readme would be great

4. create an add_to_style method

If I do want to make a directed graph and want to style the edges to be directed then I need to recrete the entire default styling. A nice addition might be a method like this:

def add_to_style(self, style):
    """
    Adds the given stylesheet to the current stylesheet. Existing keys will be
    overwritten
    
    Parameters
    ----------
    stylesheet: dict
    """
    for key in style:
        self.style[key] = style[key]

I'm open to helping out on these if you think they're useful and can provide some guidance on any conventions you'd like to be followed.

Recuperate zoom and rendered position changed

There are these two functions who got lost from version 0.1 to 0.2 of ipycytoscape.
If you download this release file: https://github.com/QuantStack/ipycytoscape/releases/tag/0.1.4
You'll see it, but basically, we need to readd them to the code:

  this.cytoscape_obj.on('zoom', () => {
    this.model.set('zoom', {'level': this.cytoscape_obj.zoom()});
    this.model.save_changes();
  });

  this.cytoscape_obj.on('rendered_position', () => {
    this.model.set('rendered_position', {'renderedPosition': this.cytoscape_obj.rendered_position()});
    this.model.save_changes();
  })

  zoom_change() {
    this.cytoscape_obj.zoom(this.model.get('zoom'));
  }

  rendered_position_change() {
    this.cytoscape_obj.rendered_position(this.model.get('rendered_position'));
  }

This should lie inside https://github.com/QuantStack/ipycytoscape/blob/1cba2f411d6e323d83025d52dd314817f064ad94/src/widget.ts#L334

We also have to make sure it works, a calling of these functions in one of the example notebooks will be enough :)

Highlight edges

Hi!

I want to highlight edges after user input via some widgets. For this I defined a CSS class like:

#...
{
  "selector": "edge.highlighted",
  "css": {
    "line-color": "red"
  }
},
#....

I then have some widgets for input and also a cell which looks like this:

widget = ipycytoscape.CytoscapeWidget()
widget.set_style(precgraph_jupyterutil.graph_css)
widget.graph.add_graph_from_networkx(some_networkx_graph, directed=True)

btn = widgets.Button(description="apply", icon="check", disabled=False)

def btn_callback(b):
  for edge in widget.graph.edges:
    classes = set(edge.classes.split(" "))
    classes.add("highlighted")
    edge.classes = " ".join(classes)

btn.on_click(callback=btn_callback)
display(btn)

widget

However I cannot get the graph to update interactively. It renders at the beginning as it should, but updating the classes attribute has no effect. I also cannot find any update function or similar.

I verified that it works at all by adding another cell after the one posted above with:

widget

If I run this cell I can see the graph with all edges in red (which verifies that the CSS etc works as expected).

What is the intended way to update the visualization? I would really appreciate any help :)

use eslint for typescript

Something I found pretty useful in making jupyterlab extensions (rather than widgets) is the automatic linting of typescript code using eslint. Adding eslint as a dev dependency would allow for running: npm run lint to automatically style the typescript code (e.g. https://github.com/jupyterlab/jupyterlab-git/blob/8d56986409461cd9968d7208da4946fca8c70392/package.json#L23-L25). You can also add it to the the checks that happen on opening PRs https://github.com/jupyterlab/jupyterlab-git/blob/8d56986409461cd9968d7208da4946fca8c70392/.travis.yml#L15

Given that this is more of a python first project this may not be necessary, but thought I'd raise the idea.

FWIW this is included by default in the extension-ts-cookiecutter, but not in the widget-ts-cookiecutter

Change style of tips

The contrast in the tips it's not the best, also it might not fit the rest of the aesthetics of the graph the user is using.
I think it'd be cool if we were able to allow the use to set the style of the tip that they're using.

I don't have much clue why, but the only kind of style that's working is this one:

https://github.com/QuantStack/ipycytoscape/blob/ca24d865b54c3d16e676940a28471dde0387a26c/src/widget.ts#L30

You can see in the tippy.js documentation that we were supposed to have at least the other default options working.

It might be some weird interaction with Poppy, but I'm really not sure.

node id in from_networkx is always cast to int

In the add_graph_from_networkx method the node id is forced to be an int:
https://github.com/QuantStack/ipycytoscape/blob/59e3440d8a77efb3ecae4867e1992d400be5b96c/ipycytoscape/cytoscape.py#L194-L197

But networkx nodes can be any hashable object (ref):

The most common choices are numbers or strings, but a node can be any hashable object (except None)

for example:

import ipycytoscape
import networkx as nx

class person:
    def __init__(self, name):
        self.name = name
    def __repr__(self):
        return str(self.name)
person1 = person('ian')
person2 = person('maleah')

G = nx.Graph()
G.add_node(person1)
G.add_node(person2)
G.add_edge(person1,person2)

cytoscapeobj = ipycytoscape.CytoscapeWidget()
cytoscapeobj.graph.add_graph_from_networkx(G)

throws a type error.

As far as I can I can tell the JSON examples use strings as ids for the nodes so I don't think it will break anything to allow more types for the from_networkx method.

Class selectors in examples not working

Hi,

I just installed version 0.2.3 with Jupyter 6.0.3 and the latest Jupyter labs extension, and the class selectors didn't seem to be working. After an hour of struggling, I tried the examples and noticed the class selectors don't work in the "labels" example either:

Screen Shot 2020-06-21 at 6 08 33 PM

Is zoom suddenly more digital than analogical?

Zoom in and zoom out are jumping in my screen.
As far as I remember it used to be a smooth animation.

  • Is it reproducible in other computers?
  • Test with older versions of ipycytoscape
  • Test on a Mac/machine other than thinkpad

Having this issue on ArchLinux, Firefox 77

Adding pop-up boxes to nodes

Is there a way to add a text-box containing clickable urls to a node with json? Specifically, I want to be able to click on any node on my graph, and have some kind of box that contains a link. I see this feature on the cytoscape.js cola example, but I cannot replicate this on ipycytoscape.

Error displaying widget: model not found

Hello!
I'm trying to run examples in JupyterLab 2.0.1:

pip install ipycytoscape
jupyter labextension install @jupyter-widgets/jupyterlab-manager
jupyter labextension install [email protected]

I've got the error in every example:

cytoscapeobj
Error displaying widget: model not found

What I'm doing wrong?

KeyError: 'nodeSpacing'

When I run Grid Example.ipynb or Labels example.ipynb I get:

Traceback (most recent call last)
<ipython-input-5-36fb9ff467a6> in <module>
----> 1 cytoscapeobj.set_layout(name='grid')

~/miniconda3/lib/python3.7/site-packages/ipycytoscape/cytoscape.py in set_layout(self, name, nodeSpacing, edgeLengthVal, animate, randomize, maxSimulationTime, padding)
    119             dummyDict['nodeSpacing'] = nodeSpacing
    120         else:
--> 121             dummyDict['nodeSpacing'] = self.cytoscape_layout['nodeSpacing']
    122         if edgeLengthVal != None:
    123             dummyDict['edgeLengthVal'] = edgeLengthVal

KeyError: 'nodeSpacing'

Add a constructor in the main widget

Quoting @ianhi:

In the init method it could check if its been passed a networkx graph, json graph, and/or dataframe and then call the appropriate add_to_graph_from__ method. Something like:

if isinstance(graph, networkx):
    self.graph.add_graph_from_networkx(graph)
elif isinstance(graph, json):
...

Make dagre visualization prettier

Currently the dagre visualization just looks like a cola visualization with hierarchy.
I'd like to add arrows to it and basically make it look like the example in the main cytoscape page. Here is the link for its code.

Add a reset button

It would be great if there was a button similar to the home button in ipympl:

image

When I'm scrolling up an down the notebook I can end up accidentally zooming way out and end up being unable to find the graph again. This would give me a way to return. Ideally if there was a button there would be an option to hide it.

Ability to export/save graphs

It would be great to implement the cytoscape functions for saving the current view as an image https://js.cytoscape.org/#core/export

This may be tricky because if there are multiple views of the object that have diverged it's not clear which one should be used.

Related: I've now used this widget to create a graph I thought justified saving!

add spaces to classes when using directed=True

cytoscapejs expects the classes to either be an array of strings or a string with classes separated by spaces. Currently when creating a graph with directed=True then a directed class will be added without any spaces. This works if there aren't any classes already present, but should break if there are any classes already present.
https://github.com/QuantStack/ipycytoscape/blob/b662ec1538564676ffc0c2334ff77dd407a7a1a0/ipycytoscape/cytoscape.py#L210

Maybe we could switch to using a list of strings for the classes? I think this would remove ambiguities as to whether spaces need to be added. We could also use a traitlets Union here but I think life would be made easier sticking to either strings or arrays.

List of fixes & regressions

Must:

  • add conda package to spectate (maybe it already exists? = it doesn't)
  • add from json
  • fix examples

Not a must but nice:

  • fix edge fine update on frontend
  • add zoom_change (will fail on jupyterlab see issue #26)
  • add rendered_position_change (js)
  • add functions get node and edge by id on python side
  • add from csv or from df
  • implement get/set for rendered_position
  • update TippyJS for latest version (^6.0.0 will probably do)
  • set_tip (on python side)

Add granular change to style so user doesn't have to repeat the content of style every time they want to update it

The issue: every time style is updated the user needs to copy the old style and add the new parts to it if they want to include something new. E.g: if you have a style set on your graph and now you want to add new commands to this style, instead of simply calling the set_style method with your new commands, you need to copy all the style content of your graph + the new commands.

See 1, #270, #197.

Explanation: This happens because cytoscape.js, the library which ipycytoscape draws from, need to have the following style configuration to show up arrows:

            {
                "selector": "edge.directed",
                "style": {
                    "curve-style": "bezier",
                    "target-arrow-shape": "triangle",
                    "target-arrow-color": "#9dbaea",
                },
            },

(Of course you can change the shape and color of the arrow, but it's necessary to specify these three attrs in order to see them).

The problem here is that because of traitlets implementation (the library in which Jupyter lab depends on to sync the backend with the frontend attrs) doesn't offer support to deep objects like lists or dictionaries. In other words, it's only syncing simple objects like ints and strings automatically.
Fortunately, I was able to overcome this issue in ipycytoscape using a library called spectate. However, spectate doesn't seem to be able to sync nested deep objects, aka, a dict inside a dict as we have when creating styles.

One way to fix it: creating an API like this.
Positive: seems like it will work
Negative: too much code to write, very different from current API, users will have to change their code

Another way to fix it: make the MutableDict work with this.
Positive: less code, more elegant solution, minimal changes to current API. users will also have to change their code, but just by adding one word.
Negative: I spent some time looking into it and couldn't make it work. Not sure why.

Thinking it further, ideally I think we would have both solutions as we strive to keep cytoscape.js and ipycy as close as possible API wise.

restructure model - view relationship in typescript?

Currently there is no way to keep two views of the same graph synced together, which makes implementing something like a save as png functionality difficult (#75). Currently every view has a new cytoscapejs object created - and any user changes to that graph are not synced back to the model. To see this create multiple views of a graph and move the nodes on one of them - they will not move in the other view. It would be nice to keep these things synced and would also help with the problems mentioned in #66 (comment)

I think that the ideal solution would be to have a single cytoscapejs object that lived in the model and is rendered to multiple elements. Unfortunately it doesn't seem as though cytoscapejs plans to enable attaching a graph to multiple views cytoscape/cytoscape.js#94.

Short of that I think the current situation could be improved by doing the following:
Have NodeModel and EdgeModel objects that own the data associated with a node/edge and hold a list of all the nodes in cytoscapes graphs that represent them. When a change to a node's attributes occurs it uses a forEachView loop and updates the nodes for every instance of the cytoscapejs graph. This would allow for easy syncing of changes from python to all views with re-instantiating the cytoscape objects which is what currently happens. User interactions with the graph could be also be synced by listening to the cytoscapejs events which would feed back into a forEachView loop as approriate.

So the main widget model would own:

  • List of NodeModels
  • List of EdgeModels
  • List of views

As is apparently always true for me this is inspired by the way ipympl works https://github.com/matplotlib/ipympl/blob/6b44a6f90cf74b12cfcf930b440010984d8a9b4d/js/src/mpl_widget.js#L235-L241

TraitError: The 'zoom' trait of a CytoscapeWidget instance must be a float

When I run Test handling in Jupyter.ipynb (and others) it works but in the log entries on the status bar in JupyterLab 2.0.1 I get many errors:

TraitError                                Traceback (most recent call last)
~/miniconda3/lib/python3.7/site-packages/ipywidgets/widgets/widget.py in _handle_msg(self, msg)
    674                 if 'buffer_paths' in data:
    675                     _put_buffers(state, data['buffer_paths'], msg['buffers'])
--> 676                 self.set_state(state)
    677 
    678         # Handle a state request.

~/miniconda3/lib/python3.7/site-packages/ipywidgets/widgets/widget.py in set_state(self, sync_data)
    543                     from_json = self.trait_metadata(name, 'from_json',
    544                                                     self._trait_from_json)
--> 545                     self.set_trait(name, from_json(sync_data[name], self))
    546 
    547     def send(self, content, buffers=None):

~/miniconda3/lib/python3.7/site-packages/traitlets/traitlets.py in set_trait(self, name, value)
   1341                                 (cls.__name__, name))
   1342         else:
-> 1343             getattr(cls, name).set(self, value)
   1344 
   1345     @classmethod

~/miniconda3/lib/python3.7/site-packages/traitlets/traitlets.py in set(self, obj, value)
    557 
    558     def set(self, obj, value):
--> 559         new_value = self._validate(obj, value)
    560         try:
    561             old_value = obj._trait_values[self.name]

~/miniconda3/lib/python3.7/site-packages/traitlets/traitlets.py in _validate(self, obj, value)
    589             return value
    590         if hasattr(self, 'validate'):
--> 591             value = self.validate(obj, value)
    592         if obj._cross_validation_lock is False:
    593             value = self._cross_validate(obj, value)

~/miniconda3/lib/python3.7/site-packages/traitlets/traitlets.py in validate(self, obj, value)
   1974             value = float(value)
   1975         if not isinstance(value, float):
-> 1976             self.error(obj, value)
   1977         return _validate_bounds(self, obj, value)
   1978 

~/miniconda3/lib/python3.7/site-packages/traitlets/traitlets.py in error(self, obj, value)
    623             e = "The '%s' trait must be %s, but a value of %r was specified." \
    624                 % (self.name, self.info(), repr_type(value))
--> 625         raise TraitError(e)
    626 
    627     def get_metadata(self, key, default=None):

TraitError: The 'zoom' trait of a CytoscapeWidget instance must be a float, but a value of {'level': 1.3618039761322855} <class 'dict'> was specified.

Add a default style for directed graphs

As suggested by @ianhi in #46 in his second point.

One idea is to add a flag that can be activated if the graph is directed in the add_graphs methods:

https://github.com/QuantStack/ipycytoscape/blob/59e3440d8a77efb3ecae4867e1992d400be5b96c/ipycytoscape/cytoscape.py#L184

https://github.com/QuantStack/ipycytoscape/blob/59e3440d8a77efb3ecae4867e1992d400be5b96c/ipycytoscape/cytoscape.py#L204

https://github.com/QuantStack/ipycytoscape/blob/59e3440d8a77efb3ecae4867e1992d400be5b96c/ipycytoscape/cytoscape.py#L225

Once this flag is activated it calls a function that changes the style of the graph, you can either use the set_style() or copy the style in the dagre example and apply it to the graph.

Allow using kwargs when creating cytoscapewidget

It'd be nice to be able to define widget attributes at creation time, rather than after.

i.e.:

style = .....
cytoscapeobj1 = ipycytoscape.CytoscapeWidget(cytoscape_style = style)
cytoscapeobj2 = ipycytoscape.CytoscapeWidget(cytoscape_style = style)

instead of

style = .....
cytoscapeobj1 = ipycytoscape.CytoscapeWidget()
cytoscapeobj2 = ipycytoscape.CytoscapeWidget()
cytoscapeobj1.set_style(style)
cytoscapeobj2.set_style(style)

This could either be implemented as explicit keyword arguments to init, or maybe init could accept **kwargs.

Enable resizing the view of the graph

It would awesome to be able to resize the view similar to how ipympl does it.
ipympl-resize

I think this would require two steps:

  1. Resize the DOM element that the graph is in
  2. call https://js.cytoscape.org/#cy.resize

I don't fully understand whats going on in ipympl but it would probably be a great starting point:

handling resizing

https://github.com/matplotlib/ipympl/blob/479a91b79838bfe13cc4c6f2a83dfc066e195da1/js/src/mpl_widget.js#L118
https://github.com/matplotlib/ipympl/blob/479a91b79838bfe13cc4c6f2a83dfc066e195da1/js/src/mpl_widget.js#L470

resize handle (gray triangle in bottom right):

https://github.com/matplotlib/ipympl/blob/479a91b79838bfe13cc4c6f2a83dfc066e195da1/js/src/mpl_widget.js#L429-L431
https://github.com/matplotlib/ipympl/blob/479a91b79838bfe13cc4c6f2a83dfc066e195da1/js/src/mpl_widget.js#L501-L502

Tuple IDs not working on NetworkX

Thanks to some comments on #70 I tried to add some tuples as IDs to nodes and tried to connect them to create a graph.

It's not working.

Here is some reproducible code to run in a notebook:

import networkx
import matplotlib
import ipycytoscape

undirected = ipycytoscape.CytoscapeWidget()
undirected.graph.add_graph_from_networkx(G)
undirected
G2 = nx.Graph()
G2.add_node((0, 1))
G2.add_node((0,2))
G2.add_edge((0,1), (0,2))
nx.draw(G2)
undirected.graph.add_graph_from_networkx(G2)

This code will produce the following result:

Screenshot_2020-06-16_21-01-47

Meaning that this is a valid output for NetworkX but ipycytoscape is not able to render it. Doesn't throw errors
I tried to convert the node to a string:

[link to node]

But didn't work, even though node is successfully converted to string, I'm getting this js error.

Error setting state: Can not create edge `dce70ec3-36b9-4bbc-a2d3-6b4a0365b5cf` with nonexistant source `1,2`

Optimize communication with front-end

At this place in the code: https://github.com/QuantStack/ipycytoscape/blob/master/ipycytoscape/cytoscape.py#L226-L229, we loop over all the nodes of the JSON file, and append new values to the MutableList structure. This will have the effect of sending as many update messages to the front-end as there are nodes in the structure.

It might be preferable to loop over the JSON, constructing the node instances, and only once all the node instances are created we should assign the list of nodes to the nodes attribute. This will have the effect of sending one update message.

Add screencast to the README

Congrats on the first release!

Since this widget will probably be getting more and more attention, it would be nice to have a screencast in the README to get an idea of what it looks like.

kernel restart causes cytoscape widget to grow forever

restarting_kernel
This isn't the biggest deal as it doesn't occur while the kernel is live. But restarting the kernel is definitely something I do often enough that I could see this being annoying. Unfortunately I don't have any insight as to why this happening.

Of note: it only expands until it is out of view, it will only expand more once you scroll down

Context:

jupyterlab == 2.1.1
ipycytoscape == master branch
browser: firefox 75.0 and chrome 80.0
OS: PopOs 19.10 (basically Ubuntu 19.10)

Recommend Projects

  • React photo React

    A declarative, efficient, and flexible JavaScript library for building user interfaces.

  • Vue.js photo Vue.js

    🖖 Vue.js is a progressive, incrementally-adoptable JavaScript framework for building UI on the web.

  • Typescript photo Typescript

    TypeScript is a superset of JavaScript that compiles to clean JavaScript output.

  • TensorFlow photo TensorFlow

    An Open Source Machine Learning Framework for Everyone

  • Django photo Django

    The Web framework for perfectionists with deadlines.

  • D3 photo D3

    Bring data to life with SVG, Canvas and HTML. 📊📈🎉

Recommend Topics

  • javascript

    JavaScript (JS) is a lightweight interpreted programming language with first-class functions.

  • web

    Some thing interesting about web. New door for the world.

  • server

    A server is a program made to process requests and deliver data to clients.

  • Machine learning

    Machine learning is a way of modeling and interpreting data that allows a piece of software to respond intelligently.

  • Game

    Some thing interesting about game, make everyone happy.

Recommend Org

  • Facebook photo Facebook

    We are working to build community through open source technology. NB: members must have two-factor auth.

  • Microsoft photo Microsoft

    Open source projects and samples from Microsoft.

  • Google photo Google

    Google ❤️ Open Source for everyone.

  • D3 photo D3

    Data-Driven Documents codes.