Giter Site home page Giter Site logo

implot's Introduction

ImPlot

ImPlot is an immediate mode, GPU accelerated plotting library for Dear ImGui. It aims to provide a first-class API that ImGui fans will love. ImPlot is well suited for visualizing program data in real-time or creating interactive plots, and requires minimal code to integrate. Just like ImGui, it does not burden the end user with GUI state management, avoids STL containers and C++ headers, and has no external dependencies except for ImGui itself.

Features

  • GPU accelerated rendering
  • multiple plot types:
    • line plots
    • shaded plots
    • scatter plots
    • vertical/horizontal/stacked bars graphs
    • vertical/horizontal error bars
    • stem plots
    • stair plots
    • pie charts
    • heatmap charts
    • 1D/2D histograms
    • images
    • and more likely to come
  • mix/match multiple plot items on a single plot
  • configurable axes ranges and scaling (linear/log)
  • subplots
  • time formatted x-axes (US formatted or ISO 8601)
  • reversible and lockable axes
  • multiple x-axes and y-axes
  • controls for zooming, panning, box selection, and auto-fitting data
  • controls for creating persistent query ranges (see demo)
  • several plot styling options: 10 marker types, adjustable marker sizes, line weights, outline colors, fill colors, etc.
  • 16 built-in colormaps and support for and user-added colormaps
  • optional plot titles, axis labels, and grid labels
  • optional and configurable legends with toggle buttons to quickly show/hide plot items
  • default styling based on current ImGui theme, or completely custom plot styles
  • customizable data getters and data striding (just like ImGui:PlotLine)
  • accepts data as float, double, and 8, 16, 32, and 64-bit signed/unsigned integral types
  • and more! (see Announcements 2022/2021/2020)

Usage

The API is used just like any other ImGui BeginX/EndX pair. First, start a new plot with ImPlot::BeginPlot(). Next, plot as many items as you want with the provided PlotX functions (e.g. PlotLine(), PlotBars(), PlotScatter(), etc). Finally, wrap things up with a call to ImPlot::EndPlot(). That's it!

int   bar_data[11] = ...;
float x_data[1000] = ...;
float y_data[1000] = ...;

ImGui::Begin("My Window");
if (ImPlot::BeginPlot("My Plot")) {
    ImPlot::PlotBars("My Bar Plot", bar_data, 11);
    ImPlot::PlotLine("My Line Plot", x_data, y_data, 1000);
    ...
    ImPlot::EndPlot();
}
ImGui::End();

Usage

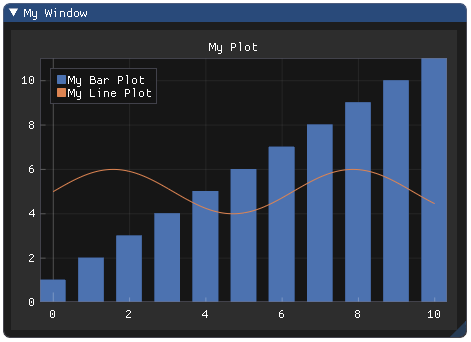
Of course, there's much more you can do with ImPlot...

Demos

A comprehensive example of ImPlot's features can be found in implot_demo.cpp. Add this file to your sources and call ImPlot::ShowDemoWindow() somewhere in your update loop. You are encouraged to use this file as a reference when needing to implement various plot types. The demo is always updated to show new plot types and features as they are added, so check back with each release!

An online version of the demo is hosted here. You can view the plots and the source code that generated them. Note that this demo may not always be up to date and is not as performant as a desktop implementation, but it should give you a general taste of what's possible with ImPlot. Special thanks to pthom for creating and hosting this!

More sophisticated demos requiring lengthier code and/or third-party libraries can be found in a separate repository: implot_demos. Here, you will find advanced signal processing and ImPlot usage in action. Please read the Contributing section of that repository if you have an idea for a new demo!

Integration

  1. Set up an ImGui environment if you don't already have one.
  2. Add implot.h, implot_internal.h, implot.cpp, implot_items.cpp and optionally implot_demo.cpp to your sources. Alternatively, you can get ImPlot using vcpkg.
  3. Create and destroy an ImPlotContext wherever you do so for your ImGuiContext:
ImGui::CreateContext();
ImPlot::CreateContext();
...
ImPlot::DestroyContext();
ImGui::DestroyContext();

You should be good to go!

Installing ImPlot using vcpkg

You can download and install ImPlot using the vcpkg dependency manager:

git clone https://github.com/Microsoft/vcpkg.git
cd vcpkg
./bootstrap-vcpkg.sh
./vcpkg integrate install
./vcpkg install implot

The ImPlot port in vcpkg is kept up to date by Microsoft team members and community contributors. If the version is out of date, please create an issue or pull request on the vcpkg repository.

Extremely Important Note

Dear ImGui uses 16-bit indexing by default, so high-density ImPlot widgets like ImPlot::PlotHeatmap() may produce too many vertices into ImDrawList, which causes an assertion failure and will result in data truncation and/or visual glitches. Therefore, it is HIGHLY recommended that you EITHER:

  • Option 1: Enable 32-bit indices by uncommenting #define ImDrawIdx unsigned int in your ImGui imconfig.h file.
  • Option 2: Handle the ImGuiBackendFlags_RendererHasVtxOffset flag in your renderer if you must use 16-bit indices. Many of the default ImGui rendering backends already support ImGuiBackendFlags_RendererHasVtxOffset. Refer to this issue for more information.

FAQ

Q: Why?

A: ImGui is an incredibly powerful tool for rapid prototyping and development, but provides only limited mechanisms for data visualization. Two dimensional plots are ubiquitous and useful to almost any application. Being able to visualize your data in real-time will give you insight and better understanding of your application.

Q: Is ImPlot the right plotting library for me?

A: If you're looking to generate publication quality plots and/or export plots to a file, ImPlot is NOT the library for you! ImPlot is geared toward plotting application data at realtime speeds with high levels of interactivity. ImPlot does its best to create pretty plots (indeed, there are quite a few styling options available), but it will always favor function over form.

Q: Where is the documentation?

A: The API is thoroughly commented in implot.h, and the demo in implot_demo.cpp should be more than enough to get you started. Also take a look at the implot_demos repository.

Q: Is ImPlot suitable for plotting large datasets?

A: Yes, within reason. You can plot tens to hundreds of thousands of points without issue, but don't expect millions to be a buttery smooth experience. That said, you can always downsample extremely large datasets by telling ImPlot to stride your data at larger intervals if needed. Also try the experimental backends branch which aims to provide GPU acceleration support.

Q: What data types can I plot?

A: ImPlot plotting functions accept most scalar types: float, double, int8, uint8, int16, uint16, int32, uint32, int64, uint64. Arrays of custom structs or classes (e.g. Vector2f or similar) are easily passed to ImPlot functions using the built-in striding features (see implot.h for documentation), and many plotters provide a "getter" overload which accepts data generating callbacks. You can fully customize the list of accepted types by defining IMPLOT_CUSTOM_NUMERIC_TYPES at compile time: see doc in implot_items.cpp.

Q: Can plot styles be modified?

A: Yes. Data colormaps and various styling colors and variables can be pushed/popped or modified permanently on startup. Three default styles are available, as well as an automatic style that attempts to match you ImGui style.

Q: Does ImPlot support logarithmic scaling or time formatting?

A: Yep! Both logscale and timescale are supported.

Q: Does ImPlot support multiple y-axes? x-axes?

A: Yes. Up to three x-axes and three y-axes can be enabled.

Q: Does ImPlot support [insert plot type]?

A: Maybe. Check the demo, gallery, or Announcements (2020/2021)to see if your desired plot type is shown. If not, consider submitting an issue or better yet, a PR!

Q: Does ImPlot support 3D plots?

A: No, and likely never will since ImGui only deals in 2D rendering.

Q: Does ImPlot provide analytic tools?

A: Not exactly, but it does give you the ability to query plot sub-ranges, with which you can process your data however you like.

Q: Can plots be exported/saved to image?

A: Not currently. Use your OS's screen capturing mechanisms if you need to capture a plot. ImPlot is not suitable for rendering publication quality plots; it is only intended to be used as a visualization tool. Post-process your data with MATLAB or matplotlib for these purposes.

Q: Why are my plot lines showing aliasing?

A: You probably need to enable ImGuiStyle::AntiAliasedLinesUseTex (or possibly ImGuiStyle:AntiAliasedLines). If those settings are already enabled, then you must ensure your backend supports texture based anti-aliasing (i.e. uses bilinear sampling). Most of the default ImGui backends support this feature out of the box. Learn more here. Alternatively, you can enable MSAA at the application level if your hardware supports it (4x should do).

Q: Can I compile ImPlot as a dynamic library?

A: Like ImGui, it is recommended that you compile and link ImPlot as a static library or directly as a part of your sources. However, if you must and are compiling ImPlot and ImGui as separate DLLs, make sure you set the current ImGui context with ImPlot::SetImGuiContext(ImGuiContext* ctx). This ensures that global ImGui variables are correctly shared across the DLL boundary.

Q: Can ImPlot be used with other languages/bindings?

A: Yes, you can use the generated C binding, cimplot with most high level languages. DearPyGui provides a Python wrapper, among other things. DearImGui/DearImPlot provides bindings for .NET. imgui-java provides bindings for Java. ImPlot.jl provides bindings for Julia. A Rust binding, implot-rs, is currently in the works. An example using Emscripten can be found here.

implot's People

Contributors

adela0814 avatar aybe avatar bear24rw avatar chiefychief23 avatar cwahn avatar elvissteinjr avatar epezent avatar epezentfb avatar jaapsuter avatar jminor avatar joellinn avatar jpieper avatar jspanchu avatar krasjet avatar minty-meeo avatar npostma avatar ocornut avatar ozlb avatar pcothren avatar perrymacmurray avatar peterjohnson avatar phkehl avatar pozemka avatar pthom avatar rjasiak54 avatar rokups avatar sergeyn avatar sonoro1234 avatar sthenic avatar xqms avatar

Stargazers

 avatar  avatar  avatar  avatar  avatar  avatar  avatar  avatar  avatar  avatar  avatar  avatar  avatar  avatar  avatar  avatar  avatar  avatar  avatar  avatar  avatar  avatar  avatar  avatar  avatar  avatar  avatar  avatar  avatar  avatar  avatar  avatar  avatar  avatar  avatar  avatar  avatar  avatar  avatar  avatar  avatar  avatar  avatar  avatar  avatar  avatar  avatar  avatar  avatar  avatar  avatar  avatar  avatar  avatar  avatar  avatar  avatar  avatar  avatar  avatar  avatar  avatar  avatar  avatar  avatar  avatar  avatar  avatar  avatar  avatar  avatar  avatar  avatar  avatar  avatar  avatar  avatar  avatar  avatar  avatar  avatar  avatar  avatar  avatar  avatar  avatar  avatar  avatar  avatar  avatar  avatar  avatar  avatar  avatar  avatar  avatar  avatar  avatar  avatar  avatar

Watchers

 avatar  avatar  avatar  avatar  avatar  avatar  avatar  avatar  avatar  avatar  avatar  avatar  avatar  avatar  avatar  avatar  avatar  avatar  avatar  avatar  avatar  avatar  avatar  avatar  avatar  avatar  avatar  avatar  avatar  avatar  avatar  avatar  avatar  avatar  avatar  avatar  avatar  avatar  avatar  avatar  avatar  avatar  avatar  avatar  avatar  avatar  avatar  avatar  avatar  avatar  avatar  avatar  avatar  avatar  avatar  avatar  avatar  avatar  avatar  avatar  avatar  avatar  avatar  avatar  avatar  avatar  avatar  avatar  avatar  avatar  avatar  avatar  avatar  avatar  avatar  avatar  avatar  avatar  avatar  avatar  avatar  avatar

implot's Issues

HiDPI support

How to achieve HiDPI scaling with Pie Charts ?

image

Ubuntu 20.04
Resolution: 3840x2160
Scaling factor: 2

Suggested addition "void SetPlotRange(ImPlotRange)"

Just spotted this library as I needed some plotting tools with imgui. I like the work. I made the following changes to allow dynamic resizing of windows and I wonder.

For implot.h-file

/// Set the axes limits of this plot
void SetPlotLimits(ImPlotLimits limits, int y_axis=-1);

For implot.cpp-file

void SetPlotLimits(ImPlotLimits limits, int y_axis_in) {
    IM_ASSERT_USER_ERROR(y_axis_in >= -1 && y_axis_in < MAX_Y_AXES, "y_axis needs to between -1 and MAX_Y_AXES");
    IM_ASSERT_USER_ERROR(gp.CurrentPlot != NULL, "GetPlotLimits() Needs to be called between BeginPlot() and EndPlot()!");
    const int y_axis = y_axis_in >= 0 ? y_axis_in : gp.CurrentPlot->CurrentYAxis;

    ImPlot& plot = *gp.CurrentPlot;
    plot.XAxis.Range = limits.X;
    plot.YAxis[y_axis].Range = limits.Y;
}

I am new to imgui so I do not know how to include the ImGuiCond statements here.

Use case: resizing by numbers from a text-box or slider. This requires seeing the plot before knowing what to do with the ImPlotRange. Example code added after an EndPlot() call to demonstrate usefulness:

ImPlotLimits range = ImGui::GetPlotLimits();
bool change=false;
change |= ImGui::InputFloat("X min", &range.X.Min, 0, 0, "%g"); 
change |= ImGui::InputFloat("X max", &range.X.Max, 0, 0, "%g");
change |= ImGui::InputFloat("Y min", &range.Y.Min, 0, 0, "%g");
change |= ImGui::InputFloat("Y max", &range.Y.Max, 0, 0, "%g");
if (change) ImGui::SetPlotLimits(range);

edit: update code to version from yesterday (warning, no testing of last function!)

rand(), srand() and RAND_MAX not found

The above functions used in the demo is causing issues on c++11/17 compilers. A trivial fix is to use the new style headers but that violates Dear ImGui's strict compliance with pre c++11 feature set.

Any ideas other than keeping a separate fork for C++11?

Minor optimization in RenderMarkers

Do we need to really support logical combination of markers like (ImPlotMarker_Circle | ImPlotMarker_Square) ?

If not we can directly have a jump table [ImPlotMarker_XXX has to indexed on element number instead of bits ]

template <typename Transformer, typename Getter>
inline void RenderMarkers(Getter getter, Transformer transformer, ImDrawList& DrawList, bool rend_mk_line, ImU32 col_mk_line, bool rend_mk_fill, ImU32 col_mk_fill) {
    static void (*marker_table[])(ImDrawList&, const ImVec2&, float s, bool, ImU32, bool, ImU32, float) = { MarkerCircle, MarkerSquare, MarkerDiamond , MarkerUp , MarkerDown , MarkerLeft, MarkerRight, MarkerCross, MarkerPlus, MarkerAsterisk};
    
    
    for (int i = 0; i < getter.Count; ++i) {
        ImVec2 c = transformer(getter(i));
        if (gp.BB_Plot.Contains(c)) {
            marker_table[gp.Style.Marker](DrawList, c, gp.Style.MarkerSize, rend_mk_line, col_mk_line, rend_mk_fill, col_mk_fill, gp.Style.MarkerWeight);
            // TODO: Optimize the loop and if statements, this is atrocious
            /*if (HasFlag(gp.Style.Marker, ImPlotMarker_Circle))
                MarkerCircle(DrawList, c, gp.Style.MarkerSize, rend_mk_line, col_mk_line, rend_mk_fill, col_mk_fill, gp.Style.MarkerWeight);
            if (HasFlag(gp.Style.Marker, ImPlotMarker_Square))
                MarkerSquare(DrawList, c, gp.Style.MarkerSize, rend_mk_line, col_mk_line, rend_mk_fill, col_mk_fill, gp.Style.MarkerWeight);
            if (HasFlag(gp.Style.Marker, ImPlotMarker_Diamond))
                MarkerDiamond(DrawList, c, gp.Style.MarkerSize, rend_mk_line, col_mk_line, rend_mk_fill, col_mk_fill, gp.Style.MarkerWeight);
            if (HasFlag(gp.Style.Marker, ImPlotMarker_Up))
                MarkerUp(DrawList, c, gp.Style.MarkerSize, rend_mk_line, col_mk_line, rend_mk_fill, col_mk_fill, gp.Style.MarkerWeight);
            if (HasFlag(gp.Style.Marker, ImPlotMarker_Down))
                MarkerDown(DrawList, c, gp.Style.MarkerSize, rend_mk_line, col_mk_line, rend_mk_fill, col_mk_fill, gp.Style.MarkerWeight);
            if (HasFlag(gp.Style.Marker, ImPlotMarker_Left))
                MarkerLeft(DrawList, c, gp.Style.MarkerSize, rend_mk_line, col_mk_line, rend_mk_fill, col_mk_fill, gp.Style.MarkerWeight);
            if (HasFlag(gp.Style.Marker, ImPlotMarker_Right))
                MarkerRight(DrawList, c, gp.Style.MarkerSize, rend_mk_line, col_mk_line, rend_mk_fill, col_mk_fill, gp.Style.MarkerWeight);
            if (HasFlag(gp.Style.Marker, ImPlotMarker_Cross))
                MarkerCross(DrawList, c, gp.Style.MarkerSize, rend_mk_line, col_mk_line, rend_mk_fill, col_mk_fill, gp.Style.MarkerWeight);
            if (HasFlag(gp.Style.Marker, ImPlotMarker_Plus))
                MarkerPlus(DrawList, c, gp.Style.MarkerSize, rend_mk_line, col_mk_line, rend_mk_fill, col_mk_fill, gp.Style.MarkerWeight);
            if (HasFlag(gp.Style.Marker, ImPlotMarker_Asterisk))
                MarkerAsterisk(DrawList, c, gp.Style.MarkerSize, rend_mk_line, col_mk_line, rend_mk_fill, col_mk_fill, gp.Style.MarkerWeight);*/
        }
    }
}

max frame rate < 60?

Hi,
I found the new version is much slower than 60.
How can I accelerate it? Thanks

vertical asymptotes

When plotting 1/x or similar it would be useful to have a vertical line appearing for infinite values.
Does it make sense?

Floating Point Precision

There have been a few issues recently that would suggest we need to move from using float to double for plot coordinate values (at least internally for axis ranges and pixel conversions). Namely this relates to precision needed when zooming (#34 , #33 (comment)). Additionally, I know there's many of us in the science/robotics fields that may have double precision data as opposed to gaming devs using single precision.

I've made some progress on the double branch and would appreciate another set of eyes on it. There's a chance I overlooked a few important casts or something to that effect. Note that the precision can be reverted by changing typedef double ImPlotFloat; at the top of implot.h to float.

I have not made double versions of each PlotXXX function yet. I see two paths forward here:

  1. Remove ImPlotFloat typedef and explicitly use double internally. Expose both double and float versions of all our API functions. Data passed as float will be converted to double before being transformed to pixel space. My initial testing suggests this incurs around a 5% slowdown, which seems acceptable.
  2. Keep ImPlotFloat typedef and allow the user to choose their floating point precision. The signatures of all API functions will take ImPlotFloat* etc. This would mean less code to maintain, with the downside being users can't mix/match double and float data in the same application (easily).

Thoughts?

Bounds in heatmap

In heatmap I have observed that another bounds other than [0,1] is not allowing.
After checking the code this issue could be resolved by replacing the max bound set to 1 (for determining the y coordinate of p) by the max y bound as parameter in function RenderHeatmap().

Good job

Announcements and New Features (2020)

Announcements of changes and new features will be posted here. Click Subscribe to the right to receive updates!

PLEASE DO NOT COMMENT ... EMOJIS ARE WELCOME :)

ImPlot namespace and style

Congratulations on the amazing library! (I noticed it was linked from Hackernews and Reddit recently, hence possibly influx of users)

As discussed earlier, I feel like using a distinct namespace e.g. ImPlot may be easier for users to find/distinguish among functions provided by this library (because it has many functions).

If anything we could imagine that large features of ImGui with many entry points could want adopt the same idea but there are none so far (Tables API being the closest and many of its function are prefixed ImGui::TableXXX for that reason).

Demo failure

In the Drag and Drop window, data stops appearing about one third from the left.
The same happens in Realtime plots

Compilation error after refactor

Hi,

After last refactor, I got the following compilation errors with gcc 9.3.0:

implot_items.cpp:247:20: error: specializing member ‘ImPlot::MaxIdx<short unsigned int>::Value’ requires ‘template<>’ syntax
  247 | const unsigned int MaxIdx<unsigned short>::Value = 65535;
      |                    ^~~~~~~~~~~~~~~~~~~~~~
implot_items.cpp:248:20: error: specializing member ‘ImPlot::MaxIdx<unsigned int>::Value’ requires ‘template<>’ syntax
  248 | const unsigned int MaxIdx<unsigned int>::Value   = 4294967295;
      |                    ^~~~~~~~~~~~~~~~~~~~

Regards,

Splitting Source Files

ImPlot has rapidly grown to almost 5000 LOC across all of its source files. While this is by no means large, implot.cpp is becoming a bit of a pain to navigate and maintain. I anticipate that this will become more challenging as the library grows. I'm considering splitting the source files in a manner similar to ImGui:

implot.h - no change
implot_internal.h - struct declarations and inline helper functions used internally by cpp files.
implot.cpp - code related to creating Plot axes and maintaining their state (i.e. BeginPlot/EndPlot) and misc user API
implot_items.cpp - implementation and helpers related to plotting and rendering items (e.g. PlotLines, PlotBars etc)
implot_demo.cpp - no change

I'd like to get thoughts from our usual contributors and users. Specifically:

  1. Would adding 3 additional source files be an issue or turnoff for you?
  2. Could you see yourself using functionality exposed in implot_internal.h to extend/modify ImPlot if it were designed that way?

Line rasteriation issues for dense plots

When you have super dense plots (many points hit a pixel), you can see holes in the rasterization pattern. Consider following plot, which plots a line:
ImPlot::PlotLine("line, [](void*, int idx) { float v = float( 3.0 * idx / (1000000 - 1)); return ImVec2(v, v); }, nullptr, 1000000);
You can observe single pixels missing on a plot.
I believe it's because triangles generated for line segments do not have exactly same coordinates.
(PS. you need my million line PR for this to work)

Pie Chart Support

My team liked your plotting extension for ImGUI and have integrated it into our project. We are looking for support for pie charts, and we hope this would not be too much work. If you provide some pointers where to start, we could look into doing a pull request.

Addition of a Fit Data function

I was thinking of adding a function which performs the exact same operation as a double click on a graph to fit the data but as a function call, thoughts? Should be a simple addition (If not already in and I've somehow missed it)

Could also include a new enum to specific which axes you want to fit specifically

enum ImPlotAxis_{
X_AXIS,
Y1_AXIS,
Y2_AXIS,
Y3_AXIS,
ALL
}

Simple function declaration with default to do all

ImPlot::FitData(ImPlotAxis_ axis = ImPlotAxis_::ALL);

implot_demo gcc warning

I have this warning compiling

C:\LuaGL\gitsources\anima\LuaJIT-ImGui\cimplot\implot\implot_demo.cpp:215:65: warning: ISO C++ forbids converting a string constant to 'char*' [-Wwrite-strings]
         static char* labels1[]   = {"Frogs","Hogs","Dogs","Logs"};

one solution is to decalre static const char* labels1[], but then also PlotPieChart should take const char* instead of just char*

Bug in BenchmarkItem in implot_demo.cpp

There is a memory leak in BenchmarkItem in implot_demo.cpp. The Data pointer is freed with delete even though it points to an array. Please use delete[] or switch to a std::vector if you can.

This error showed up immediately when running Cppcheck on the code.

Rust bindings

Hi there, love the library :) I wanted to ask if anyone is aware of Rust bindings being created for implot, similar to the ones for imgui itself (https://github.com/Gekkio/imgui-rs)?

If not, I'd like to step up and start working on that - I'd probably ask the folks over at imgui-rs about their approach and if any coordination should be done with that project.

global context issues

First of all thanks for this great library!

I have a few issues related to the static global variable gp

I use a custom allocator and static globals init/deinit order is not guaranteed, and so my app will crash at exit cos my custom allocator (that imgui and in turn implot uses) will be destroyed before the gp.

Also within ImPlotContext destructor the call to SetColormap will access gp! that is a bug...

I am hacking the library to fix my needs but I wonder if a more clean design would be a better option for everyone's use?

Cheers

Candlestick chart

Hi. Thank you very much for such an amazing library!
Would you mind to implement a candlestick chart? It would be great to have a function with signature like

void PlotCandlestickChart(const char* label_id, const float* xs, const float* opens, const float* closes, const float* lows, const float* highs, int count, int offset, int stride)

I have a very basic implementation which looks like this
candles
The implementation is very straightforward and based on the error bars code, but I can share it here if you want.

Let me explain some problems I've faced here:

  1. As you can see, I use 2 colors for candles. The main problem is you cannot show a 2-colored marker in the legend box. I see 2 solutions here: either to support a multicolor markers in the legend, or use one color, but mark rising and falling candles with solid and hollow filling. I'm not sure what option is more suitable for implot.
  2. It would be great to be able to show a time on the X axis in some form.
  3. I'm not sure if this is a topic for implot, but it would be great to have some tools to show the candle parameters (OHLC values) when mouse is hovered or clicked the candle.

Please let me know if I can help somehow.
Thanks!

Make flags easier to use via FFI

This is relating to the effort to bind implot and use it in GIU. Relevant GIU issue.

I've gotten some of the basics of implot bound into imgui-go already working. However one issue I ran into was that some of the enum types don't have defined values (they are enumerated automatically). This makes them hard to use via FFI. To work around this, I modified our in-tree fork to split the relevant enums out into their own header, which let me interface with it from Cgo. (implot.h cannot be directly imported into Cgo, since it doesn't understand many of the C++-isms)

There are two ways to work around this that I can think of:

  1. Separate the flags into their own header as I did (example)
  2. Assign specific values to each flag, so the same values can be hard-coded on the other side of the FFI.

I would be happy to make the needed changes and submit a PR, but I wanted to see if @epezent had a preference between the two before I do the work, or if you can think of a better way to do this.

User Defined Tick Labels

Both PlotBars and PlotHeatmap could benefit from the ability to add custom tick labels at specific locations (actually, this is a useful feature in general). The API function(s) for this would likely have to precedeBeginPlot due to the order in which plot-bounding boxes are calculated. Something like this might work:

SetNextPlotTickLabelsX(const char** labels, float* values, int n);
SetNextPlotTickLabelsY(const char** labels, float* values, int n, int y_axis = 0);

We would have to consider whether this should add to or override the default tick labels. Thoughts?

Looping in folks...
@ozlb @sergeyn @jpieper

Showing values of points in tooltips and hovering markers

Although a small feature. I think this gives user a better way for seeing and comparing the value instead of showing the value at a fixed position .

Here is an example for the same .

b68290c6290184728990d120b48fcfd8

We could also provide value getters for the user for these tooltips . So that they can show different values on hover .

Like if someone wants to see some stats which they don't want to plot but see the values w.r.t to x axis . They could add those in the getters .

Feature request: drag from legend

My application has multiple visible plots. It’s really easy to drag from a data source to a particular plot, but it would also be a nice feature to be able to drag a series from the legend of one plot to another plot. API wise I'm thinking something like (between BeginPlot and EndPlot), mimicing ImGui::BeginDragDropSource():

if (ImPlot::BeginLegendDragDropSource("id")) {
  ImGui::SetDragDropPayload(...);
  // text etc for DND tooltip
  ImPlot::EndLegendDragDropSource();
}

I think a temporary workaround would be to use the legend hovered feature and detect drags, but that feels very manual and error-prone.

bugfix for axes

Hello,

Small bug when drawing several Begin/EndPlot with different sizes : the axis are based on the canvas BB of the previous Plot.

Quick fix : in implot.cpp move the lines 936-941 ("adaptive division") after the calculation of the canvas BB line 976. Then the axis will use the correct canvas BB (not the previous one)

Thx

Find data extents

In PlotEx()

    // find data extents
    if (gp.FitThisFrame) {
        for (int i = 0; i < count; ++i) {
            ImPlotPoint p = getter(i);
            FitPoint(p);
        }
    }

is not handling the case of constant y values where result of FitPoint() will return gp.ExtentsX.Min and gp.ExtentsX.Max equal. This will stuck scrolling and Y resizing interaction.

Crash on drag&drop demo

I can reproduce a crash in the implot drag & drop demo:

  • Pause the graph
  • Clear the graph
  • Drag & drop any label to the graph

This is the crash:

↪ ./example_sdl_opengl3
Assertion failed: (i < Size), function operator[], file ../../imgui.h, line 1326.
fish: './example_sdl_opengl3' terminated by signal SIGABRT (Abort)

OSX 10.14.16, running example_sdl_opengl3. I'm using today's imgui master branch.

Seeking Advice - `FitThisFrame` and narrow vertical graphs

Hello,

Looking for some advice here...

One of our potential uses for ImPlot involves rendering many graphs vertically next to each other, per the following screen shot:

image

Which is a first-draft prototype mockup to reproduce functionality of a different application, which looks like this:

image

Now, let me acknowledge that using ImPlot to draw graphs vertically (essentially swapping X and Y and hoping things will work) could be considered 'abusing' the library outside its intended use. But since it appears that (for the most part) ImPlot happy draws multiple Y values for unique X values, we figured it's worth exploring ImPlot for this use case.

We integrated the new table branch of ImGui and use the new table layout functionality to create the multiple column "tracks", each containing one graph. Thanks to ImGui we automatically get resizing, reordering, and hiding/showing of each track. Which is pretty cool.

So I became tentatively optimistic.

The main issue where things currently fall down appears to be around double-click auto sizing (and the FitThisFrame functionality. For some reason, whenever the plot width shrinks below a certain size (like in the first screenshot above), the FitThisFrame logic appears to break down, and a double click on the graph no longer zooms to fit the entire graph.

I've stepped through ImPlot's code, and as far as I've been able to debug; all the logic around calculating the X- and Y-axis extents works as expected, as does the calculation of Mx in the UpdateTransformCache.

My hunch is that somewhere in the drawing code, gp.PixelRange is only willing to shrink to a certain point, beyond which it clamps to some kind of minimum graph width, and thus failing to fully fit the full extents of the graph's X-axis.

I'm not expecting you to debug this issue for us. Like I said, I recognize that ImPlot's primary purpose is to render traditional X-Y graphs with a horizontal layout (unfortunately that's not an option for us).

My questions are two-fold:

  1. Specific to this issue -- without you spending time looking into this issue, do you happen to have any hunch as to why FitThisFrame might break down when a graph gets very narrow, and where I should look to debug this myself?

  2. And more generally -- do you think using ImPlot is even a good idea here, or did we step so far outside of ImPlot's intended purpose, that we're better of writing our own bespoke graph/plot functionality? (FWIW, we already use ImPlot for several other panels in our application, that have traditional X-Y graphs, and we're very happy with it there).

Appreciate any thoughts, but I realize the open-endedness of this question, so feel free to ignore.

Thanks,

Jaap Suter

Visualisation Improvement ideas/fixes

1.) Minor ticks should not suddenly become major ticks, but gradually blend into major ticks. New minor ticks should blend in out of completely transparent ones. This will look much nicer when you do zooming, especially very rapid zooming. The point is not to have sudden changes in an image
2.) Add very mild animation on zooming - instead of sudden changes in zoom, zoom in gradually, starting at very fast speed, and slowing down when reaching zoom target, play the whole animation within 0.5-0.8second so it is still as sharp and responsive and not annoying. Also put it on a flag
3.) When zooming in, amount of digits for each tick grows and at some point they start to overlap.
image
I suggest skipping outputting text for ticks which will overlap with previous tick, with preference for major ticks of course.

[Proposition] Online interactive demonstration

Your library is truly awesome, congrats!

When it come to C++ libraries, most of the time there is most of the time no easy way to get a working demonstration. First, you have to download the code setup the build environment, etc. There, C++ is lagging behind some other languages, especially on the web.

However, emscripten can help a lot in this case. In order to tryr to fill this gap, I spent a few hours this afternoon in order to make an online demo of your library.

It is live here, and the source code for this demo is on github.

Here are some screenshots:

implot demo:
image

source code browser with access to the different demos:
image

It runs at 120 fps, except for the benchmark (which I suspect is blocked because it may consume too much memory)

If you are interested, you could may be use this in order to add an interactive demo in your Readme. Feel free to deploy the wasm files on any server of your choice.

Thanks

Implot crashes when compiled with address sanitizer on gcc

I used the examples_sdl_opengl3 bundled with imgui and added in the implot code with
ImPlot::ShowDemoWindow() to draw the example code. This triggers a crash when compiled with -fsanitize=address on Linux and GCC 9.3.0 using implot git version
37ee2d4

=================================================================
==48757==ERROR: AddressSanitizer: global-buffer-overflow on address 0x55bf12668948 at pc 0x55bf1250ef5a bp 0x7ffeebd56060 sp 0x7ffeebd56050
READ of size 4 at 0x55bf12668948 thread T0
    #0 0x55bf1250ef59 in OffsetCalculator ../../implot.cpp:164
    #1 0x55bf1250d61e in ImPlot::SetColormap(int, int) ../../implot.cpp:3499
    #2 0x55bf12510d14 in ImPlot::ImPlotContext::ImPlotContext() ../../implot.cpp:424
    #3 0x55bf1250f062 in __static_initialization_and_destruction_0 ../../implot.cpp:524
    #4 0x55bf1250f09b in _GLOBAL__sub_I__ZN11ImPlotStyleC2Ev ../../implot.cpp:3631
    #5 0x55bf125be26c in __libc_csu_init (/home/qeed/imgui/examples/example_sdl_opengl3/example_sdl_opengl3+0x2a926c)
    #6 0x7fe54894303f in __libc_start_main (/lib/x86_64-linux-gnu/libc.so.6+0x2703f)
    #7 0x55bf123620cd in _start (/home/qeed/imgui/examples/example_sdl_opengl3/example_sdl_opengl3+0x4d0cd)

0x55bf12668948 is located 0 bytes to the right of global variable 'csizes' defined in '../../implot.cpp:3498:16' (0x55bf12668920) of size 40
SUMMARY: AddressSanitizer: global-buffer-overflow ../../implot.cpp:164 in OffsetCalculator
Shadow bytes around the buggy address:
  0x0ab8624c50d0: f9 f9 f9 f9 f9 f9 f9 f9 f9 f9 f9 f9 f9 f9 f9 f9
  0x0ab8624c50e0: f9 f9 f9 f9 f9 f9 f9 f9 f9 f9 f9 f9 f9 f9 f9 f9
  0x0ab8624c50f0: f9 f9 f9 f9 f9 f9 f9 f9 f9 f9 f9 f9 f9 f9 f9 f9
  0x0ab8624c5100: f9 f9 f9 f9 f9 f9 f9 f9 f9 f9 f9 f9 f9 f9 f9 f9
  0x0ab8624c5110: f9 f9 f9 f9 f9 f9 f9 f9 f9 f9 f9 f9 f9 f9 f9 f9
=>0x0ab8624c5120: f9 f9 f9 f9 00 00 00 00 00[f9]f9 f9 f9 f9 f9 f9
  0x0ab8624c5130: 00 00 00 00 00 00 00 00 00 00 00 00 00 00 00 00
  0x0ab8624c5140: 00 00 00 00 00 00 00 00 00 00 00 00 00 00 00 00
  0x0ab8624c5150: 00 00 00 00 00 00 00 00 f9 f9 f9 f9 f9 f9 f9 f9
  0x0ab8624c5160: f9 f9 f9 f9 f9 f9 f9 f9 f9 f9 f9 f9 f9 f9 f9 f9
  0x0ab8624c5170: f9 f9 f9 f9 f9 f9 f9 f9 f9 f9 f9 f9 f9 f9 f9 f9
Shadow byte legend (one shadow byte represents 8 application bytes):
  Addressable:           00
  Partially addressable: 01 02 03 04 05 06 07 
  Heap left redzone:       fa
  Freed heap region:       fd
  Stack left redzone:      f1
  Stack mid redzone:       f2
  Stack right redzone:     f3
  Stack after return:      f5
  Stack use after scope:   f8
  Global redzone:          f9
  Global init order:       f6
  Poisoned by user:        f7
  Container overflow:      fc
  Array cookie:            ac
  Intra object redzone:    bb
  ASan internal:           fe
  Left alloca redzone:     ca
  Right alloca redzone:    cb
  Shadow gap:              cc
==48757==ABORTING

Looking at the location of the crash, the error seems to occur at line 3499

  static int csizes[ImPlotColormap_COUNT] = {10,9,9,12,11,11,11,11,11,11};
  static OffsetCalculator<ImPlotCol_COUNT> coffs(csizes);

ImPlotCol_COUNT is larger than ImPlotColormap_COUNT and thus it will overwrite memory.
The fix seems to be using ImPlotColormap_COUNT for OffsetCalculator.

math functions not declared

iI thing this was triggered when droping #include imgui_internal.h which was including math.h

C:\LuaGL\gitsources\anima\LuaJIT-ImGui\cimplot\implot\implot_demo.cpp: In member function 'void {anonymous}::RollingData
::AddPoint(float, float)':
C:\LuaGL\gitsources\anima\LuaJIT-ImGui\cimplot\implot\implot_demo.cpp:50:22: error: 'fmodf' was not declared in this sco
pe
         float xmod = fmodf(x, Span);
                      ^~~~~

[not-an-issue] Sharing Alternative Input Mapping

Evan requested I share the alternative input map we use in our application. Frankly, the new input mapping feature is pretty self explanatory. But here it is all the same.

Some comments:

  • Our software has existing panels that used left-mouse-button for box selection, and middle-mouse-button for panning. We want our ImPlot panels to behave the same.
  • We don't use ImPlot's query functionality, so I didn't put too much consideration in how I mapped those features, merely making sure that it wouldn't conflict with the inputs we do care about.
  • We run the code below once, right after we've initialized ImGui and set up it's custom theme and all that.
// Set ImPlot's input mapping to more closely mirror the rest of our application
{
    ImPlotInputMap& i = ImPlot::GetInputMap();

    i.PanButton = ImGuiMouseButton_Middle;
    i.PanMod = ImGuiKeyModFlags_None;

    i.BoxSelectButton = ImGuiMouseButton_Left;
    i.BoxSelectMod = ImGuiKeyModFlags_None;
    i.BoxSelectCancelButton = ImGuiMouseButton_Right;

    i.QueryButton = ImGuiMouseButton_Right;
    i.QueryMod = ImGuiKeyModFlags_None;
    i.QueryToggleMod = ImGuiKeyModFlags_Ctrl;
    
    i.ContextMenuButton = ImGuiMouseButton_Middle;

    i.HorizontalMod = ImGuiKeyModFlags_Alt;
    i.VerticalMod = ImGuiKeyModFlags_Shift;
}

Big thanks to Evan for adding custom input map support to ImPlot.

sprintf unsafe

I am getting the above error on the sprintf statements with vc(v142) compiler and c++17. Please add the following directive _CRT_SECURE_NO_WARNING to disable the warning but ideally, we should remove the sprintf with other safer options.

Dragging a plot also drags another plot

To reproduce:
in the plot demo window expand custom styles and custom rendering (2entries before last one)
Drag plot from custom styles all the way down and observer that plot from custom rendering is also being dragged

Feature request - gantt chart / event chart

First, thanks for this awesome lib, I love it.
I am using implot to build a homebrew performance profiler / time series visualizer.
The current charts of implot can plot metrics well, and what I am missing is gantt chart, or event chart, as shown by the following screeshot, from https://github.com/Celtoys/Remotery:

image

Is is possible to have this kind of feature in implot, I believe it will benefit other users as well.

Recommend Projects

  • React photo React

    A declarative, efficient, and flexible JavaScript library for building user interfaces.

  • Vue.js photo Vue.js

    🖖 Vue.js is a progressive, incrementally-adoptable JavaScript framework for building UI on the web.

  • Typescript photo Typescript

    TypeScript is a superset of JavaScript that compiles to clean JavaScript output.

  • TensorFlow photo TensorFlow

    An Open Source Machine Learning Framework for Everyone

  • Django photo Django

    The Web framework for perfectionists with deadlines.

  • D3 photo D3

    Bring data to life with SVG, Canvas and HTML. 📊📈🎉

Recommend Topics

  • javascript

    JavaScript (JS) is a lightweight interpreted programming language with first-class functions.

  • web

    Some thing interesting about web. New door for the world.

  • server

    A server is a program made to process requests and deliver data to clients.

  • Machine learning

    Machine learning is a way of modeling and interpreting data that allows a piece of software to respond intelligently.

  • Game

    Some thing interesting about game, make everyone happy.

Recommend Org

  • Facebook photo Facebook

    We are working to build community through open source technology. NB: members must have two-factor auth.

  • Microsoft photo Microsoft

    Open source projects and samples from Microsoft.

  • Google photo Google

    Google ❤️ Open Source for everyone.

  • D3 photo D3

    Data-Driven Documents codes.