gorhill / javascript-voronoi Goto Github PK
View Code? Open in Web Editor NEWA Javascript implementation of Fortune's algorithm to compute Voronoi cells
Home Page: http://www.raymondhill.net/voronoi/
License: Other
A Javascript implementation of Fortune's algorithm to compute Voronoi cells
Home Page: http://www.raymondhill.net/voronoi/
License: Other


Hey there,
I'm using your awesome library here two do some graphics with two.js. After a lot of testing, I've found a potential bug in Safari 6.x on OS X 10.8.3. If you check out this demo in Chome (26.x), it works pretty well, with expected slowdowns when there's more polygons to draw.
In Safari, at around 21 - 23 sites, the demo gets stuck. If you run with the developer console open, it works fine for some reason. I ran it with the dev console closed, ran until it gets stuck, then immediately opened the console and found this output:
I'm not 100% sure what's going on here... seems to be getting suck in the for(;;) loop. I am by no means a good JavaScript developer, so I'm afraid this is a little above my head to debug.
Any thoughts? Any and all help would be greatly appreciated.
I’m not sure the subject is an accurate description of when the error occurs, but this bug is a mirror of d3/d3#1578. A small example that produces the error is:
162.625000000000000,  97.42857142857143
-12.022138010542562, 426.24997828655780
-208.632321624577860, 239.89177832355410
-164.515150982886550,  97.42857142857147
The expected result is:
However, it crashes when trying to close the cell because none of the four branches are taken to initialize the other end of the border edge.
Hi Raymond.
I'm a clinical psychologist in New York with a strong interest in visual imagery. I first came across your Javascript Voronoi program in February and I have been online experimenting with it over the past several months. I find it to be a very interesting and versatile tool with many potentials.
I've developed some ideas for conceptual expansion of the program but unfortunately I am not a computer programmer myself. One basic idea is to allow users to choose which colors appear in the "colourize" function, and there are some other basic "forks" I would like to explore. I'm wondering if you might be interested in such a project or might know someone else who might be? I would certainly expect to compensate programmers for their time.
I would much appreciate any feedback or leads you could offer. Please feel free to contact me here or at [email protected]
Best,
Michael Ritter, PhD
Hello,
I know this project is an archive but it would be great if a license can be added if applicable to help other developers know their rights and for the creator (Xennis) to provide details : https://docs.github.com/en/repositories/managing-your-repositorys-settings-and-features/customizing-your-repository/licensing-a-repository#choosing-the-right-license.
Because as it stands, all rights are reserved.
Thank you.
I'd like to access all the adjacent vertices of a given vertex.
Something like the "getNeighborIds()" method of cells would be great.
May be there is already a way to do this that I missed ?
Thanks for this great library !
What are the chances we can port this to the new JS standards?
Could you please tag your main branch with the version number you have in package.json
https://github.com/gorhill/Javascript-Voronoi/releases
It will help to use your code with bower ;)
It would be useful to be able to weigh the points being used in generating the Voronoi diagram. Examples of the type of resulting diagrams this would create can be found at http://en.wikipedia.org/wiki/Power_diagram
My idea for the implementation of this would be to have two optional parameters in the voronoi.compute function so that the function signature would look like voronoi.compute(sites, bbox, weights)
The parameter weights would expect an array the same size as the sites parameter. If weights is given in the function call, each site would be assigned a weight from the array in the order given.
This would allow a lot of new applications, such as creating a point which is "greedier" than its neighbors, and thus has a larger cell than others, or one which is "more important" or "larger." Than other cells.
The following parameters cause "this makes no sense!" exception:
var  sites =
 [
  { id:"A", x:0      , y:1994781.61 }
 ,{ id:"B", x:2225857, y:34336      }
 ,{ id:"C", x:2575935, y:33225      }
 ,{ id:"D", x:5464269, y:0          }
 ]
;
var  buffer = 360000;
var  bbox = { xl:0          - buffer
            , yt:0          - buffer
            , xr:5464269    + buffer
            , yb:1994781.61 + buffer
//            , yb:2000000    + buffer
            };

var  v = new Voronoi();
var  r = v.compute( sites, bbox );
When yb:2000000 line is uncommented - exception goes away.
If I put some visualizing code just in front of this.closeCells(bbox); call, I get the following picture:
where in green are this.edges state just before the call.
Exception happens when the cell for the "B" site is processed.
I'm using rhill-voronoi-core.js from the current master branch.
Complete example https://gist.github.com/tg8/4b4b2b5c853fbb41f7e1
Thanks for your work on this :)
I'm sure I'm missing something very simple here, but I'm not able to have an useful result.
This is the input:
{ xl: 11.5658569335938,
  xr: 11.6853332519531,
  yt: 44.8761789907703,
  yb: 44.7924263989408 }

[ { x: 11.604309082031248, y: 44.86852295681338 },
  { x: 11.634521484374998, y: 44.85294822403813 },
  { x: 11.604309082031248, y: 44.83736927811443 },
  { x: 11.638641357421875, y: 44.83736927811443 },
  { x: 11.63177490234375, y: 44.820812031724444 },
  { x: 11.5960693359375, y: 44.820812031724444 },
  { x: 11.619415283203125, y: 44.810095984897416 },
  { x: 11.6619873046875, y: 44.83347388333049 },
  { x: 11.649627685546875, y: 44.822760189927365 } ]
And this is the output:
{ site: undefined,
  cells:
   [ { site: [Object], halfedges: [], closeMe: true },
     { site: [Object], halfedges: [], closeMe: true },
     { site: [Object], halfedges: [], closeMe: false },
     { site: [Object], halfedges: [], closeMe: true },
     { site: [Object], halfedges: [], closeMe: true },
     { site: [Object], halfedges: [], closeMe: false },
     { site: [Object], halfedges: [], closeMe: false },
     { site: [Object], halfedges: [], closeMe: true },
     { site: [Object], halfedges: [], closeMe: true } ],
  edges: [],
  vertices:
   [ { x: 11.643666783643415, y: 44.794610574161624 },
     { x: 11.64012678846446, y: 44.827050838189045 },
     { x: 11.611433233521034, y: 44.823495044087075 },
     { x: 11.616290671377905, y: 44.826185494149776 },
     { x: 11.650178960146114, y: 44.834610273456285 },
     { x: 11.621475219726562, y: 44.83478582961569 },
     { x: 11.621475219726562, y: 44.84116389601012 },
     { x: 11.652647967468768, y: 44.84940757076509 },
     { x: 11.615399748176795, y: 44.8529461174639 },
     { x: 11.552253172290776, y: 44.8529461174639 },
     { x: 11.627376478435822, y: 44.8761789907703 },
     { x: 11.584201353792057, y: 44.7924263989408 },
     { x: 11.671629951202616, y: 44.8761789907703 },
     { x: 11.61224608828216, y: 44.7924263989408 },
     { x: 11.686745224281982, y: 44.7924263989408 },
     { x: 11.61414593296328, y: 44.8761789907703 },
     { x: 11.644582329600441, y: 44.7924263989408 },
     { x: 11.609475555148991, y: 44.8761789907703 },
     { x: 11.597172383342123, y: 44.7924263989408 },
     { x: 11.635615745083602, y: 44.8761789907703 } ],
  execTime: 6 }
There are no edges and no halfedges - what's wrong?
Thanks in advance!
I'd like to access the diagram's nodes, but currently the only way I can see to do this is to look at all the edges and ignore duplicate points. Is there a more logical way to do this?
Thanks!
While porting the code to Haxe, I noticed that you're missing a local "var v" in getBbox loop.
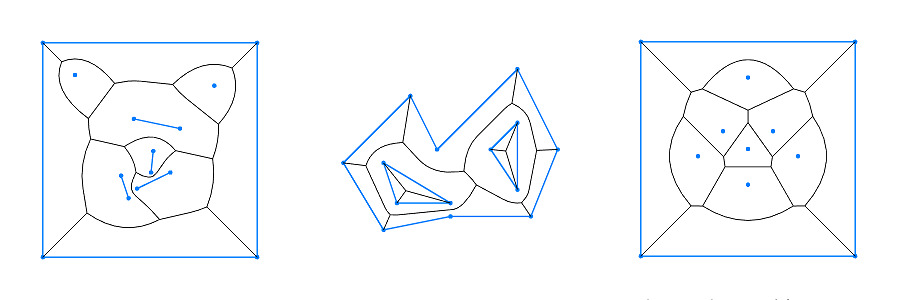
There are Voronoi diagram variants which the sites include straight segments. The result may contain parabola arcs.
An example image:
hello, now I have the requirement for get the center point in every single polygon.
To do that, I should keep a list for every point in the sites to store relevant edges.
Could u please show me where should i modify your code to get this job done?
Thank U.
edges va and vb do mix text and float, this caused my center function to return wrong values (huge numbers)

function center(he){
    return ({x:(he.edge.va.x+he.edge.vb.x)/2,y:(he.edge.va.y+he.edge.vb.y)/2})
}
when adding this sanatizing function after calling compute, it does solve the issue :
        this.res.edges.forEach((edge)=>{
            edge.va.x = parseFloat(edge.va.x)
            edge.va.y = parseFloat(edge.va.y)
            edge.vb.x = parseFloat(edge.vb.x)
            edge.vb.y = parseFloat(edge.vb.y)
        })
The reason why I did not want to add the parseFloat on the center function, is that I might be calling it a high number of times, it is therefore for my use case more efficient to run it once on the output results.
In case you think it makes sense for a more homogeneous types of the output, I would recommend to integrate this inside the compute function.
I know that you might be looking to reduce cpu time and this might increase it, that is why the decision for this change is a compromise of for and against.
The code for this example is: https://gist.github.com/Strernd/87d1b919a5dd51352b05873042a4e7c5
Is it my fault?
Edit: I read it incorrectly twice and it is actually correct.
Hi there,
Nice library.
I'm trying to get a cell's vertices in clockwise or counter-clockwise order. I've tried
var corners = [], i;
for( i = cell.halfedges.length - 1; i > -1; i-- ){
    corners.push(
        cell.halfedges[i].getStartpoint()
    );
}
but it doesn't seem to order them properly ( it creates duplicate ). Is there a way to do this?
It would be cool to allow for Tileable graphs ala
http://brianin3d-demos.appspot.com/static/demos/random/voronoi.xml
and selectively choosing x, y or x/y tiling would be a bonus (with the end goal being to create a map to wrap around a globe.)
Not sure if this is a bug or just an undocumented change, but I'm seeing the returned diagram missing the 4th edge for the middle cell in the following example using the latest version of the lib. Using an older version (can start digging to find out exactly which, but I'm guessing it was aad4ca6 as that was just before I started using the lib) did not have this problem.
var sites = [{x:2, y:5}, {x:5, y:5},{x:8, y:5}],
    bbox = {xl:0, xr:10, yt:0, yb:10};
var voronoi = new Voronoi();
var diagram = voronoi.compute(sites, bbox);
var polyBoundaries = diagram.cells.map(function(cell) {
    return cell.halfedges.map(function(edge) {
        return edge.getStartpoint();
    });
});
console.log(polyBoundaries);
which prints
[
    [
        {"x": 3.5, "y": 10},
        {"x": 3.5, "y": 0},
        {"x": 0, "y": 0},
        {"x": 0, "y": 10}
    ],
    [
        {"x": 3.5, "y": 0},
        {"x": 3.5, "y": 10},
        {"x": 6.5, "y": 10}
    ],
    [
        {"x": 6.5, "y": 0},
        {"x": 6.5, "y": 10},
        {"x": 10, "y": 10},
        {"x": 10, "y": 0}
    ]
]
The output I expect is
[
    [
        {"x": 0, "y": 0},
        {"x": 0, "y": 10},
        {"x": 3.5, "y": 10},
        {"x": 3.5, "y": 0}
    ],
    [
        {"x": 3.5, "y": 0},
        {"x": 3.5, "y": 10},
        {"x": 6.5, "y": 10},
        {"x": 6.5, "y": 0}
    ],
    [
        {"x": 6.5, "y": 0},
        {"x": 6.5, "y": 10},
        {"x": 10, "y": 10},
        {"x": 10, "y": 0}
    ]
]
If I should be using a different method to extract the points defining the boundary of the cells, let me know.
Note that adding another call to this.closeCells(bbox) at line 1687 properly adds the 4th edge, so I presume some corner case just got created or overlooked in a recent commit.
It would be nice to have a function take coordinates as a parameter and return which cell is located in that point. This would greatly improve usability for mapping. (Unsure what to do on corners/edges which could be in 2 or more cells.)
I see you made preparations for your voronoi library to be published to NPM as a module, but it doesn't seem to have happened yet... Are you still planning to do so?
var sites = [ {x: 200, y: 200, specialValue: yes}]
and then that specialValueis now attached in the output of cells when the voronoi is calculated:
diagram.cells[i].site['specialValue']
I have a triangular cell near a corner of a generated diagram, unfortunately it thinks it has 4 edges so the point intersection test does not work correctly
cells[0].halfedges.forEach( he => {
  console.log(
    he.getStartpoint().x,
    he.getStartpoint().y,
    he.getEndpoint().x,
    he.getEndpoint().y,
  )
})

512 0 562.01 0
562.01 63.26 578.06 63.26
578.06 0 578.068 0
512 0 512 0
I fixed to 2dp for clarity here, I havent done anything funky, just fed a list of sites into the generator.
I could prune before running the test but figured that should probably be a core function, and I'm not sure if just pruning zero length edges is going to break something else.
The following input results in a blank canvas:
100,100
200,200.0001
300,300
However, note that three exactly collinear points produce the expected result:
100,100
200,200
300,300
I noticed that all vertices on the bounding box (except the four corners) are duplicated (once for each cell sharing the vertex, I suppose).
Is that a bug or a necessity due to the algorithm used? I couldn't find a previous issue on this, so I thought I'd ask.
If it's a necessity, are the coordinates of duplicates always guaranteed to be numerically identical or could they differ due to some floating-point foo?
My implementation works sometimes but since I want to do Lloyd's relaxation, I really need the compute method to work all the time. I copied the code in the demo and I was expecting to have good results. But no matter how hard I try or the input, I still get this error Cannot read property 'rbRed' of null. Sometimes it's Cannot read property 'rbLeft' of null.
I'm using random numbers to generate the sites. And it seems the more sites I have, the less likely I am to have a working diagram. Can you please tell me if there's a fix? I already tried replacing the sibling var with sibling?: that way I'm checking if the var is null before referencing a property. But I got another error.
Many thanks.
EDIT: this bug doesn't happen when I use the code with Node. It only happens when I generate the map in a browser
Hi.
Sites are characterized by points. And each point is (allow redundance) a Point which has id, xand y fileds. Point public object is then different from (documented) Vertex public object in that the latter doesn't have an id property/field.
Isn't that a case?
Isn't this the case?
Thank you.
It might be good to add a statement to the readme pointing out that this code employs a coordinate system in which Y axis values decrease from bottom to top. Thus, it will choke (silently) in conventional geomapping applications using lat/lon coordinates (because latitude increases from bottom to top of a north-at-top map).
Short of wading into the code to patch that, users can quickly and easily transform their sites and bbox latitudes via this function so that they will work with this library. Just use this function to transform your latitudes:
y2 = min + max - y1
where y1 = latitude, y2 = transformed latitude, min = minimum latitude (of the sites or bbox) and max = maximum latitude (of the sites or bbox). What this function does, in essence, is to flip your map vertically, so that the transformed map's y axis direction corresponds to the coordinate system the code expects. Then, after calculating the voronoi cells, transform their vertices' y coordinates back to map latitudes using the same function (i.e., flip the voronoi cells vertically, to conform to 'north up').
Note that no transformation of longitudes is required; this code's coordinate system expects x values to increase from left to right, which is what longitude does too, and the code handles negative longitudes just fine as is. But I have not looked into what happens if your map spans the equator or the prime meridian, nor have I checked whether it handles negative latitudes (okay, okay: I'm obviously U.S.-centric).
I know I would have found a sentence in the readme to this effect to be a real time-saver. But that said, thanks so much for this great code.
Stuff which should go in "more":
So a site has its own cell. How would one detect if a given (x,y) coordinate lies within that cell?
A declarative, efficient, and flexible JavaScript library for building user interfaces.
🖖 Vue.js is a progressive, incrementally-adoptable JavaScript framework for building UI on the web.
TypeScript is a superset of JavaScript that compiles to clean JavaScript output.
An Open Source Machine Learning Framework for Everyone
The Web framework for perfectionists with deadlines.
A PHP framework for web artisans
Bring data to life with SVG, Canvas and HTML. 📊📈🎉
JavaScript (JS) is a lightweight interpreted programming language with first-class functions.
Some thing interesting about web. New door for the world.
A server is a program made to process requests and deliver data to clients.
Machine learning is a way of modeling and interpreting data that allows a piece of software to respond intelligently.
Some thing interesting about visualization, use data art
Some thing interesting about game, make everyone happy.
We are working to build community through open source technology. NB: members must have two-factor auth.
Open source projects and samples from Microsoft.
Google ❤️ Open Source for everyone.
Alibaba Open Source for everyone
Data-Driven Documents codes.
China tencent open source team.