gphat / chart-clicker Goto Github PK
View Code? Open in Web Editor NEWExtensible, Beautiful Charts for Perl
Home Page: http://gphat.github.com/chart-clicker/
Extensible, Beautiful Charts for Perl
Home Page: http://gphat.github.com/chart-clicker/


This is perl 5, version 32, subversion 1 (v5.32.1) built for x86_64-linux-thread-multi-quadmath
t/axis-division-rounded.t ....... 1/?
#   Failed test 'Nicely rounded tick values - large scale 3 ticks'
#   at t/axis-division-rounded.t line 70.
#     Structures begin differing at:
#          $got->[1] = '0.0074'
#     $expected->[1] = '0.0073'
# Looks like you failed 1 test of 8.
t/axis-division-rounded.t ....... Dubious, test returned 1 (wstat 256, 0x100)
Failed 1/8 subtests
Hi,
I have experienced the following failure on strawberry perl 5.22.0 (MS Windows)
"D:\strawberry32\perl\bin\perl.exe" "-MExtUtils::Command::MM" "-MTest::Harness" "-e" "undef *Test::Harness::Switches; test_harness(0, 'blib\lib', 'blib\arch')" t/*.t t/series/*.t t/xt/*.t
t/add-data.t .................... ok
t/axis-datetime.t ............... ok
t/axis-division-rounded.t ....... ok
t/axis.t ........................ ok
t/basic.t ....................... ok
t/context.t ..................... ok
t/data-dataset.t ................ ok
t/data-marker.t ................. ok
t/data-range.t .................. ok
Usage: GD::Image::filledRectangle(image, x1, y1, x2, y2, color) at D:/strawberry32/perl/site/lib/Graphics/Primitive/Driver/GD.pm line 451.
# Tests were run but no plan was declared and done_testing() was not seen.
# Looks like your test exited with 255 just after 2.
t/datetime.t ....................
Dubious, test returned 255 (wstat 65280, 0xff00)
All 2 subtests passed
t/decoration-color_allocator.t .. ok
t/decoration-glass.t ............ ok
t/decoration-grid.t ............. ok
t/decoration-legend.t ........... ok
t/decoration-markeroverlay.t .... ok
t/decoration-plot.t ............. ok
t/decoration.t .................. ok
t/drawing-colorallocator.t ...... ok
Usage: GD::Image::filledRectangle(image, x1, y1, x2, y2, color) at D:/strawberry32/perl/site/lib/Graphics/Primitive/Driver/GD.pm line 451.
# Tests were run but no plan was declared and done_testing() was not seen.
# Looks like your test exited with 255 just after 2.
t/example.t .....................
Dubious, test returned 255 (wstat 65280, 0xff00)
All 2 subtests passed
t/invisible.t ................... ok
t/release-pod-syntax.t .......... skipped: these tests are for release candidate testing
t/release-synopsis.t ............ skipped: these tests are for release candidate testing
t/renderer-area.t ............... ok
t/renderer-bar.t ................ ok
t/renderer-base.t ............... ok
t/renderer-bubble.t ............. ok
t/renderer-candlestick.t ........ ok
t/renderer-line.t ............... ok
t/renderer-pie.t ................ ok
t/renderer-point.t .............. ok
t/same-axes-ctx.t ............... ok
t/series/highlow.t .............. ok
t/series/series.t ............... ok
t/series/size.t ................. ok
t/simple-ctx.t .................. ok
t/xt/pod.t ...................... ok

Test Summary Report
-------------------
t/datetime.t                  (Wstat: 65280 Tests: 2 Failed: 0)
  Non-zero exit status: 255
  Parse errors: No plan found in TAP output
t/example.t                   (Wstat: 65280 Tests: 2 Failed: 0)
  Non-zero exit status: 255
  Parse errors: No plan found in TAP output
Files=36, Tests=338, 36 wallclock secs ( 0.19 usr +  0.05 sys =  0.23 CPU)
Result: FAIL
Hi,
I have created a graphing module using Chart::Clicker in ubuntu it works fine but the same code if i use in centos the image that is created has not graph in it that is it is just an empty file in centos having cairo-1.8.8-3. Can you please tell me what might be the root cause?
I'm seeing the same problem which aavang and HemanthKumarR mentioned in a previous post.
I have many data points, and occasionally all points have the same value.
The code croaks with "This axis has a span of 0, that's fatal!"
As a workaround for this corner case, I subtract a small amount from my first value, but that's ugly.
I'm using 5.8.8
Hi,
Recently I started to use this component to draw my charts it seems that there is an issue while drawing legend where there is bigger amount of series.
I'm using latest strawberry perl 5.18.2.1 on windows 7
On picture below you can see that picture is cut in the half of the data series.
Even when I set up Layout manager manually it doesn't work correctly.
my $lm = Layout::Manager::Flow->new(
anchor => 'west',
wrap => 1,
);
$cc->legend->layout_manager($lm);
$cc->legend->visible(1);
When I disable the legend, graph is plotted correctly like here:
I tried with series names without space in name and result is same.
I modified lines example I just added multiple series and executed add_data on chart.
Can any one suggest me a workaround ? I used Tabular Legend but those take a lot of space and there is no way to plot for example 3 columns of series names only.
Y axis vertical label is scrambled - 4 words of the label rendering over each other
I have ...->range_axis->label('Hour of the Day'); and the 4 words appear to be rendered with H,o,t and D all starting at the same location so the words appear to over-writing each other. ...->domain_axis->label('Date when maximum occurred'); for the X axis works AOK.
Using Chart::Clicker 2.86 from CPAN on Ubuntu 13.04 with all fixes applied.
I have rebuilt all components of Chart Clicker as recommended by a Stack Overflow reply to another Chart Clicker problem reported by another user - rebuild did not help
marelli
Currently axis with of the type Chart::Clicker::Axis::DateTime have ticks divided evenly via Chart::Clicker::Axis::DivisionType::Exact.
This results in tick positioning that logically is sensible but is strange for people.
For the case of DataTime data, a far more helpful division would be to have ticks placed on hour/day/week boundaries.
Perhaps called Chart::Clicker::Axis::DivisionType::DateTime or something to that effect.
There is a mismatch between the height of the bars an the grid. In the stacked-bar.pl example the second value of the violet bars is 5. In the diagramm it is significantly below the 5 grid line.
http://gphat.github.io/chart-clicker/static/images/examples/stacked-bar.png
By default Chart::Clicker chooses non-optimal values for tick marks (such as 0.30, 1.40, 2.50, 3.60, 4.70, 5.80).
I created a subroutine getrange() which creates tick marks to produce a chart which is easier to read.
In the example above, if getrange() is given a min of 0.30 and a max of 5.80, the tick marks returned will be [0, 1, 2, 3, 4, 5, 6]
my $Yrange = getrange( $min, $max, { integer => 1 } );
$ctx->range_axis->tick_values($Yrange);

sub getrange {
    my ( $min, $max, $options ) = @_;
    # $min and $max are the minimum and maximum values of the input data
    return if not defined $min or not defined $max;
    my $span = $max - $min;
    my $n = substr( sprintf( "%.6e", $span ), 0, 8 );     # First few number 1.000000 to 9.999999
    my $e = substr( sprintf( "%.6e", $span ), 9, 11 );    # exponent with sign such as +01
    my $step;
    if ( $n > 5 ) {
        $step = 1 * 10**($e);                            # 5.01 to 9.99
    } elsif ( $n > 2 ) {
        $step = 5 * 10**( $e - 1 );                      # 2.01 to 3.00
    } else {
        $step = 2 * 10**( $e - 1 );                      # 1.00 to 2.00
    }
    if ( $options->{integer} ) {
        # This forces steps to be integers.  If max is 2.2, then step is 1 (not 0.5)
        use POSIX;
        $step = ceil($step);
    }
    my $range;
    if ( $max/$step == int($max/$step) ) {
        $range = [ map { $_ * $step }  int( $min / $step ) .. int( $max / $step ) ];
    } else {
        $range = [ map { $_ * $step }  int( $min / $step ) .. int( $max / $step ) + 1 ];
    }
    return $range;
}
sub test_getrange {
    my @minmax = ( 0.30, 5.80,  0, 0.85,  0, 1.1,  0, 2.2,  0, 5.8,  0, 8,  0, 15,  0, 28,  0, 44,  0, 58,  0, 88,  0, 100,  0, 102,  0, 1020,  -7, 21,  18, 45,  18, 49 );
    while (@minmax) {
        my $min = shift @minmax;
        my $max = shift @minmax;
        my $range = getrange( $min, $max, { integer => 1 } );
        say "\n$min  $max\n    " . join ' ', @{$range};
    }
    exit 0;
}
All of the charts produced with Chart::Clicker have blurry lines and text.
The Cairo FAQ has an entry describing the problem and workarounds for it.
https://www.cairographics.org/FAQ/#sharp_lines
"Either way, you can avoid the issue by using an even-integer line width, (note that the default line width in cairo is 2.0). A line drawn this way will still affect just as many pixels, but they will be affected at full intensity.
Otherwise, if you really want to light up a single row of pixels at full intensity, you can do that by adjusting the endpoints by 0.5 in the appropriate direction. "
Is there a way to add a label to the pie slice in
"use Chart::Clicker::Renderer::Pie"
I would expect to see the label and number (percentage/count) for each slice next to the slice instead of in the legend..
Also, Is there a way to define the color for each slice (red, white, yellow, etc)?
Here's my code
use Chart::Clicker;
use Chart::Clicker::Renderer::Pie;
use Graphics::Color::RGB;
my $cc = new Chart::Clicker();
my @work = (7000);
my @serv = (1200);
$cc->add_data('Workstations', @work);
$cc->add_data('Servers', @serv);
$cc->title->text('Pie');
$cc->title->padding->bottom(1);
$cc->plot->grid->visible(0);
my $ren = new Chart::Clicker::Renderer::Pie();
$ren->brush(Graphics::Primitive::Brush->new({width => 2}));
$ren->border_color(Graphics::Color::RGB->new(red => 1, green => 1, blue => 1));
$ren->gradient_reverse(1);
$ren->gradient_color(Graphics::Color::RGB->new(red => 1, green => 1, alpha => .3));
my $context = $cc->get_context('default');
$context->renderer($ren);
$context->domain_axis->hidden(1);
$context->range_axis->hidden(1);
$cc->draw;
$cc->write("$0.png");
This is a great simple graphing program.
Thanks for creating it..
Joe
Hi,
I'm using Strawberry Perl 5.12.1 with Chart::Clicker 2.81 and Cairo 1.090 and I've tried running a couple of the example charts, as well as writing my own, but the values for the x and y axis aren't being rendered. I tried both line and bar graphs. For example, line-shapes.pl renders fine but no values are present on the axis. I've tried both png and pdf output.
Is this a bug in Chart::Clicker?
Hi,
I use Chart::Clicker V2.86 with ActiveState Perl V5.14.2 on Windows 7 32 bit (win32).
First I had the same results reported above.
After inserting a line in Graphics::Primitive::Driver::Cairo.pm the output was almost similar to the example-files:
foreach my $line (@{ $comp->layout->lines }) {
    my $text = $line->{text};
    my $tbox = $line->{box};

     next if not(defined($text)) || ($text eq '');   # <- This is the new added line
The only restriction is, that I can use just one font type, regardless the font type I choose.
Font size could be adjusted.
I think that the source of the problem is somewhere in a module in
Graphics::Primitive
or
Graphics::Primitive::Driver::Cairo::TextLayout
which has a different behaviour under Windows than under Linux.
It seems not to be a Cairo driver problem.
This is the example plot file from this server:
This is my generated output after inserting the line described above:
The second modification is just to set the ticks number from 5 to 6
Hi,
I have developed a graphing module using Chart::Clicker, can anybody tell how do i improve my graph visuals. Also How do i export the graph data? there is an option to write as pdf but it writes image in the pdf file but i need only data that is passed to graph
Also axis span has o error is due to the values having same value, for example has 5 values and each has 0,0,0,0,0 or 10,10,10,10,10 then this error occurs how do i overcome this because i need to plot the graph even for these values
Can you please help by responding immediately
Hi,
I got no sample to work with current perl modules.
Using line.pl results in this:

Any ideas how to fix it?
The following Chart::Clicker test always fails (with the same results) if I try to install with cpanm. It always passes if I build manually (perl Makefile.PL && make && make test).
t/axis-datetime.t ............... ok

#   Failed test 'Nicely rounded tick values - medium scale'
#   at t/axis-division-rounded.t line 22.
#     Structures begin differing at:
#          $got->[0] = '20'
#     $expected->[0] = '25'

#   Failed test 'Nicely rounded tick values - large scale 5 ticks'
#   at t/axis-division-rounded.t line 35.
#     Structures begin differing at:
#          $got->[1] = '100000000'
#     $expected->[1] = '200000000'

#   Failed test 'Nicely rounded tick values - large scale 3 ticks'
#   at t/axis-division-rounded.t line 53.
#     Structures begin differing at:
#          $got->[1] = '250000000'
#     $expected->[1] = '400000000'

#   Failed test 'Nicely rounded tick values - large scale 3 ticks'
#   at t/axis-division-rounded.t line 67.
#     Structures begin differing at:
#          $got->[0] = '0.0072'
#     $expected->[0] = '0.00725'

#   Failed test 'Nicely rounded tick values - large scale 3 ticks'
#   at t/axis-division-rounded.t line 81.
#     Structures begin differing at:
#          $got->[1] = '1.5673'
#     $expected->[1] = '1.5674'
Tested on perl 5.16.2 without threads
Hi,
I'm having some issues. I've running Centos 6.5 with Chart::Clicker v2.88 from cpan. When I add a label to the default context range axis, it heavily pads it out as below and compresses the rest of the layout up. Changing the font does not help. Adding a title or a domain axis label does not have this effect.
Is there something obvious I've missed?
Thanks,
Phil.
my $defctx = $cc->get_context('default');
$defctx->range_axis->label('test');

$defctx->range_axis->fudge_amount(.05);
$defctx->domain_axis->fudge_amount(.05);

$cc->draw;
$cc->write_output('foo.png');

On FreeBSD 10 systems with perl compiled with -Duselongdouble the t/axis-division-rounded.t test fails:
#   Failed test 'Nicely rounded tick values - large scale 3 ticks'
#   at t/axis-division-rounded.t line 70.
#     Structures begin differing at:
#          $got->[0] = '0.00720000000000000035'
#     $expected->[0] = '0.0072'

#   Failed test 'Nicely rounded tick values - large scale 3 ticks'
#   at t/axis-division-rounded.t line 85.
#     Structures begin differing at:
#          $got->[0] = '1.56720000000000008'
#     $expected->[0] = '1.5672'
# Looks like you failed 2 tests of 8.
t/axis-division-rounded.t .......
Dubious, test returned 2 (wstat 512, 0x200)
Failed 2/8 subtests
This does not happen on other systems using -Duselongdouble (e.g. Linux).
Greetings Cory,
During an install I found that this module is shipping two files that are identical ...
jotamjr@quantum:~/sandbox/pkg-perl/libchart-clicker-perl$ diff -s example/simple.pl example/very-simple.pl Files example/simple.pl and example/very-simple.pl are identicalI didn't find any cross reference were any of those files were required, so I think they are the same thing but I can be wrong though.
Kind Regards!
Jotam
It would be very extremely convenient to have a single option for an Axis to change the graphing from left -> right, to right -> left
Hence, this feature request.
The link to your talk on http://gphat.github.io/chart-clicker/ is broken. (goes to a defunct squarespace site)
Not hundred-precent sure but I don't find how to create custom labels or annotations on chart with Chart::Clicker. And I saw page 18 of http://www.slideshare.net/dwm042/chart-clicker-presentation mentioned Image::Magick for doing the labellings...
Require Graphics::Primitive::Driver::GD on Windows instead of Graphics::Primitive::Driver::Cairo
Chart::Clicker is great.
I couldn't find a way to make semilog plot. Is this possible? Is there an example?
Thank you,
Greg
Hi Cory.
Chart::Clicker would render twice as fast without the excessive (4x expected) number of set-font-options and select-font-face calls, as listed by cairo-trace on CentOS 7.
There appears to be:
# yum install cairo-tools
# CAIRO_TRACE_LINE_INFO=1 cairo-trace perl graph.cgi

%!CairoScript - perl
dict
  /width 500 set
  /height 250 set
  /format //ARGB32 set
  /content //COLOR_ALPHA set
  image dup /s0 exch def
context % c0
n << >> set-font-options
(Sans) //SLANT_NORMAL //WEIGHT_NORMAL select-font-face
12 set-font-size
n << >> set-font-options
(Sans) //SLANT_NORMAL //WEIGHT_NORMAL select-font-face
12 set-font-size
n << >> set-font-options
n << >> set-font-options
n << >> set-font-options
(Sans) //SLANT_NORMAL //WEIGHT_NORMAL select-font-face
12 set-font-size
n << >> set-font-options
(Sans) //SLANT_NORMAL //WEIGHT_NORMAL select-font-face
[.. deleted 1,000 more lines, mostly font calls ..]
Hi,
There is a bug when plotting a graph with range_axis label that contain spaces.
If used like that - all of the text is plotted on each other like on screen shot
my $cc = Chart::Clicker->new(width => 500, height => 250);
my $defctx = $cc->get_context('default');
$defctx->range_axis->label('Time taken by Request');
Replacing space with '_' char seems to be a workaround.
It would be useful to be able to generate charts with a Y axis like this:
10000 -
 1000 -
  100 -
   10 -
    1 -
Axes like that are useful for charts where there are a handful of extreme peaks, but lots of interesting low-level activity.
For example
t/add-data.t .................... Passing a list of values to enum is deprecated. Enum values should be wrapped in an arrayref. at /usr/lib64/perl5/vendor_perl/Moose/Util/TypeConstraints.pm line 437.
        Moose::Util::TypeConstraints::enum("LineCap", "butt", "round", "square") called at /usr/share/perl5/vendor_perl/Graphics/Primitive/Brush.pm line 9
        require Graphics/Primitive/Brush.pm called at /usr/share/perl5/vendor_perl/Graphics/Primitive/Border.pm line 9
        Graphics::Primitive::Border::BEGIN() called at /usr/share/perl5/vendor_perl/Graphics/Primitive/Brush.pm line 0
        eval {...} called at /usr/share/perl5/vendor_perl/Graphics/Primitive/Brush.pm line 0
        require Graphics/Primitive/Border.pm called at /home/eda/git_working/fedora-packages/SOURCES/perl-Chart-Clicker/Chart-Clicker-2.88/blib/lib/Chart/Clicker.pm line 14
        Chart::Clicker::BEGIN() called at /usr/share/perl5/vendor_perl/Graphics/Primitive/Brush.pm line 0
        eval {...} called at /usr/share/perl5/vendor_perl/Graphics/Primitive/Brush.pm line 0
        require Chart/Clicker.pm called at t/add-data.t line 4
        main::BEGIN() called at /usr/share/perl5/vendor_perl/Graphics/Primitive/Brush.pm line 0
        eval {...} called at /usr/share/perl5/vendor_perl/Graphics/Primitive/Brush.pm line 0
If you call it too early then the rendered_data method returns an empty string. It should instead die with an informative message.
Passing a list of values to enum is deprecated. Enum values should be wrapped in an arrayref. at /usr/lib/perl5/Moose/Util/TypeConstraints.pm line 441.
    Moose::Util::TypeConstraints::enum('Layout::Manager::Flow::Anchors', 'north', 'south', 'east', 'west') called at /usr/share/perl5/Layout/Manager/Flow.pm line 8
    require Layout/Manager/Flow.pm called at /usr/share/perl5/Chart/Clicker/Decoration/Legend.pm line 14
    Chart::Clicker::Decoration::Legend::BEGIN() called at /usr/share/perl5/Layout/Manager/Flow.pm line 0
    eval {...} called at /usr/share/perl5/Layout/Manager/Flow.pm line 0
    require Chart/Clicker/Decoration/Legend.pm called at /usr/share/perl5/Chart/Clicker.pm line 22
    Chart::Clicker::BEGIN() called at /usr/share/perl5/Layout/Manager/Flow.pm line 0
    eval {...} called at /usr/share/perl5/Layout/Manager/Flow.pm line 0
    require Chart/Clicker.pm called at /home/dean/cvs/repos/dimps/Dimps/script/../lib/Dimps/Controller/Graph/Dimps.pm line 6
    Dimps::Controller::Graph::Dimps::BEGIN() called at /usr/share/perl5/Layout/Manager/Flow.pm line 0
    eval {...} called at /usr/share/perl5/Layout/Manager/Flow.pm line 0
    require Dimps/Controller/Graph/Dimps.pm called at /usr/share/perl5/Catalyst/Utils.pm line 308
    eval {...} called at /usr/share/perl5/Catalyst/Utils.pm line 308
    Catalyst::Utils::ensure_class_loaded('Dimps::Controller::Graph::Dimps', 'HASH(0x3e537e0)') called at /usr/share/perl5/Catalyst.pm line 2575
    Catalyst::setup_components('Dimps') called at /usr/share/perl5/Catalyst.pm line 1174
    Catalyst::setup('Dimps') called at /home/dean/cvs/repos/dimps/Dimps/script/../lib/Dimps.pm line 107
    require Dimps.pm called at /usr/share/perl5/Module/Runtime.pm line 317
    Module::Runtime::require_module('Dimps') called at /usr/share/perl5/Class/Load.pm line 179
    Class::Load::try {...} () called at /usr/share/perl5/Try/Tiny.pm line 76
    eval {...} called at /usr/share/perl5/Try/Tiny.pm line 72
    Try::Tiny::try('CODE(0x27daae8)', 'Try::Tiny::Catch=REF(0x27dab48)') called at /usr/share/perl5/Class/Load.pm line 185
    Class::Load::try_load_class('Dimps', undef) called at /usr/share/perl5/Class/Load.pm line 40
    Class::Load::load_class('Dimps') called at /usr/share/perl5/Catalyst/ScriptRole.pm line 91
    Catalyst::ScriptRole::_run_application('Catalyst::Script::Server=HASH(0x1f307f8)') called at /usr/share/perl5/Catalyst/Script/Server.pm line 238
    Catalyst::Script::Server::run('Catalyst::Script::Server=HASH(0x1f307f8)') called at /usr/share/perl5/Catalyst/ScriptRunner.pm line 50
    Catalyst::ScriptRunner::run('Catalyst::ScriptRunner', 'Dimps', 'Server') called at script/dimps_server.pl line 8
or it can be replicated as such...
perl -e 'use Chart::Clicker'
Passing a list of values to enum is deprecated. Enum values should be wrapped in an arrayref. at /usr/lib/perl5/Moose/Util/TypeConstraints.pm line 441.
    Moose::Util::TypeConstraints::enum('Layout::Manager::Flow::Anchors', 'north', 'south', 'east', 'west') called at /usr/share/perl5/Layout/Manager/Flow.pm line 8
    require Layout/Manager/Flow.pm called at /usr/share/perl5/Chart/Clicker/Decoration/Legend.pm line 14
    Chart::Clicker::Decoration::Legend::BEGIN() called at /usr/share/perl5/Layout/Manager/Flow.pm line 0
    eval {...} called at /usr/share/perl5/Layout/Manager/Flow.pm line 0
    require Chart/Clicker/Decoration/Legend.pm called at /usr/share/perl5/Chart/Clicker.pm line 22
    Chart::Clicker::BEGIN() called at /usr/share/perl5/Layout/Manager/Flow.pm line 0
    eval {...} called at /usr/share/perl5/Layout/Manager/Flow.pm line 0
    require Chart/Clicker.pm called at -e line 1
    main::BEGIN() called at /usr/share/perl5/Layout/Manager/Flow.pm line 0
    eval {...} called at /usr/share/perl5/Layout/Manager/Flow.pm line 0
some details...
perl -v

This is perl 5, version 18, subversion 2 (v5.18.2) built for x86_64-linux-gnu-thread-multi
(with 40 registered patches, see perl -V for more detail)
and
perl -e 'use Chart::Clicker; print $Chart::Cer::VERSION' 2> /dev/null
2.87
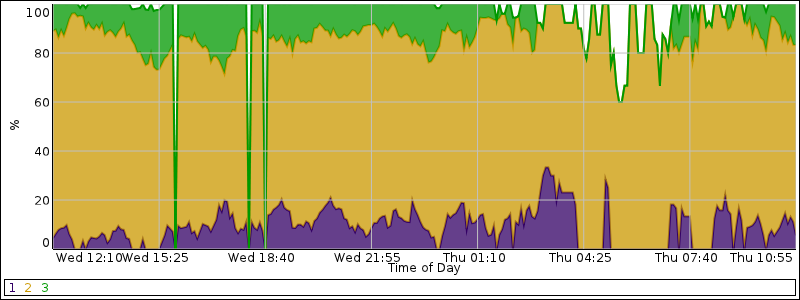
Hi,
I'm using Chart::Clicker for a project and it's so far proved a pleasure to work with. However, I've hit a bit of a blocker and I can't figure out a way round.
I'm using Chart::Clicker::Renderer::StackedArea to render a chart with three series of percentages, in such a way that creates a 100% stacked view of the data (by setting the x-axis with a range of 0-100). This works really well, until I have a series that has data points of 0. At these points in the chart, the other two series (with, say, values of 25 and 75) are rendered with the wrong scale, and there is a large white gap at the top of the chart at that those points.
You can see an example here on the right-hand side of the chart (the blips on the left-hand side are all series having values of 0, which is fine) : http://www.70cities.net/test_stacked.png
Any ideas on how to fix or work around this?
A
diff --git a/lib/Chart/Clicker/Data/Marker.pm b/lib/Chart/Clicker/Data/Marker.pm
index d7e4bbb..4867660 100644
--- a/lib/Chart/Clicker/Data/Marker.pm
+++ b/lib/Chart/Clicker/Data/Marker.pm
@@ -105,7 +105,7 @@ Set/Get the value for this marker. This represents a point on the range.
has 'value' => ( is => 'rw', isa => 'Num' );
-=head2 value2
+=attr value2
Set/Get the value2 for this marker. This represents a second point on the
range and is used to specify a range.
https://ibb.co/dLPc6H
Ticks are centered. Biggest value isnt on top of chart. This happening on 0.0000x and smaller values.
After rendering a CC object, there are lots of circular references (see via Data::Dumper)
There is some discussion on perlmonks about this -> http://www.perlmonks.org/?node_id=1075642
I have come up with this little incantateon which, accoding to CatalystX::LeakChecker, gives perl the freedom to clear the CC object.
    # hack away at circular references!

    $chart->{component_list}->{components} = undef;
    $chart->{contexts}{default}{range_axis}{parent}{component_list}{components} = undef;
    $chart->{legend}->{component_list}->{components} = undef;
    $chart->{plot} = undef;
    $chart->{contexts}->{default} = undef;
    $chart->{legend}->{clicker} = undef;
    $chart->{marker_overlay}->{clicker} = undef;
    $chart->{title}->{layout}->{component} = undef;
I don't know if this is something accidental because of Moose - or an excess of convenient cross references. Some use of DESTROY may be needed etc
Currently I'm showing the legend for a stacked barchart on the right of the chart.
Unfortunately, the bars appear drawn from bottom to top, but the legend is top to bottom, so the labels appear "backwards."
I looked at the source code and couldn't come up with a simple change to reverse the label drawing.
Is it possible to add an option to reverse the legend labelling?
On creating Bar Graph resulting .PNG is simply a white rectangle with one thin horizontal line running along the bottom.
It looks like Chart::Clicker fairly consistently uses warn()/die() rather than carp()/croak() to signal failure. This makes Perl emit a location for the error from Chart::Clicker's perspective, rather that from the caller's perspective, which makes debugging much harder.
Hi,
would be great if the user could adjust the padding between the axis tick_labels and the label. At the moment they are clued directly together and this looks bads when you have man ticks. Looked into source and there is no hidden method to adjust the margin or padding of one of them.
I can set a padding on whole axis but this only moves the already clued tick_labels and ticks.
Regards Martin
Hi,
Chart::Clicker fails to install because Cairo won't install using cpan. I tried installing Cairo by itself and as expected that fails as well:
cpan[7]> install Graphics::Primitive::Driver::Cairo
Running install for module 'Graphics::Primitive::Driver::Cairo'
Running make for G/GP/GPHAT/Graphics-Primitive-Driver-Cairo-0.46.tar.gz
Has already been unwrapped into directory /root/.cpan/build/Graphics-Primitive-Driver-Cairo-0.46-TIFBYc
---- Unsatisfied dependencies detected during ----
---- GPHAT/Graphics-Primitive-Driver-Cairo-0.46.tar.gz ----
Cairo [requires]
Running make test
Delayed until after prerequisites
Running make install
make test had returned bad status, won't install without force
Delayed until after prerequisites
Running install for module 'Cairo'
Running make for X/XA/XAOC/Cairo-1.104.tar.gz
Has already been unwrapped into directory /root/.cpan/build/Cairo-1.104-LJJXSO
No 'Makefile' created
, won't make
Running make test
Make had some problems, won't test
Running make install
Make had some problems, won't install
Running make for G/GP/GPHAT/Graphics-Primitive-Driver-Cairo-0.46.tar.gz
Has already been unwrapped into directory /root/.cpan/build/Graphics-Primitive-Driver-Cairo-0.46-TIFBYc
Warning: Prerequisite 'Cairo => 0' for 'GPHAT/Graphics-Primitive-Driver-Cairo-0.46.tar.gz' failed when processing 'XAOC/Cairo-1.104.tar.gz' with 'writemakefile => NO -- No 'Makefile' created
'. Continuing, but chances to succeed are limited.
Has already been made
Running make test
PERL_DL_NONLAZY=1 /usr/bin/perl "-MExtUtils::Command::MM" "-e" "test_harness(0, 'blib/lib', 'blib/arch')" t/.t t/author/.t
t/author/pod.t .......... skipped: Test::Pod 1.22 required for testing POD
t/layout.t .............. Can't locate Cairo.pm in @inc (@inc contains: /root/.cpan/build/Graphics-Primitive-Driver-Cairo-0.46-TIFBYc/blib/lib /root/.cpan/build/Graphics-Primitive-Driver-Cairo-0.46-TIFBYc/blib/arch /etc/perl /usr/local/lib/perl/5.14.2 /usr/local/share/perl/5.14.2 /usr/lib/perl5 /usr/share/perl5 /usr/lib/perl/5.14 /usr/share/perl/5.14 /usr/local/lib/site_perl .) at /root/.cpan/build/Graphics-Primitive-Driver-Cairo-0.46-TIFBYc/blib/lib/Graphics/Primitive/Driver/Cairo.pm line 8.
BEGIN failed--compilation aborted at /root/.cpan/build/Graphics-Primitive-Driver-Cairo-0.46-TIFBYc/blib/lib/Graphics/Primitive/Driver/Cairo.pm line 8.
Compilation failed in require at t/layout.t line 7.
BEGIN failed--compilation aborted at t/layout.t line 7.
t/layout.t .............. Dubious, test returned 2 (wstat 512, 0x200)
No subtests run
t/load.t ................ 1/?
t/load.t ................ Dubious, test returned 1 (wstat 256, 0x100)
Failed 1/1 subtests
t/release-pod-syntax.t .. skipped: these tests are for release candidate testing
t/release-synopsis.t .... skipped: these tests are for release candidate testing
t/layout.t (Wstat: 512 Tests: 0 Failed: 0)
Non-zero exit status: 2
Parse errors: No plan found in TAP output
t/load.t (Wstat: 256 Tests: 1 Failed: 1)
Failed test: 1
Non-zero exit status: 1
Files=5, Tests=1, 1 wallclock secs ( 0.03 usr 0.00 sys + 0.93 cusr 0.06 csys = 1.02 CPU)
Result: FAIL
Failed 2/5 test programs. 1/1 subtests failed.
make: *** [test_dynamic] Error 255
GPHAT/Graphics-Primitive-Driver-Cairo-0.46.tar.gz
one dependency not OK (Cairo); additionally test harness failed
/usr/bin/make test -- NOT OK
//hint// to see the cpan-testers results for installing this module, try:
reports GPHAT/Graphics-Primitive-Driver-Cairo-0.46.tar.gz
Running make install
make test had returned bad status, won't install without force
Failed during this command:
GPHAT/Graphics-Primitive-Driver-Cairo-0.46.tar.gz: make_test NO one dependency not OK (Cairo); additionally test harness failed
root@qaweb:~# perl -v
This is perl 5, version 14, subversion 2 (v5.14.2) built for x86_64-linux-gnu-thread-multi
(with 88 registered patches, see perl -V for more detail)
root@qaweb:# uname -a#
Linux qaweb 3.2.0-3-amd64 #1 SMP Mon Jul 23 02:45:17 UTC 2012 x86_64 GNU/Linux
root@qaweb:
My goal is to use Chart::Clicker to generate charts on the fly for a Perl::CGI based web site.
Fixes or workarounds appreciated!
Thanks,
Sander
Please update your required modules list, I had to install these modules first on Kubuntu 18 to get Chart::Clicker to install.
sudo cpan install Cpanel::JSON::XS
sudo cpan install JSON::Any
sudo cpan install Geometry::Primitive::Circle
[Chart::Clicker 2.79 off CPAN]
When given a Data::Series that only contains a single data point, C::C::Axis croaks with the message:
This axis has a span of 0, that's fatal! at […]/Chart/Clicker/Axis.pm line 186
Code to reproduce (modulo some boilerplate pre- and post-), based on the bar.pl example but tested with both Bar and Line renderers:
  Chart::Clicker::Data::DataSet->new(series => [
    Chart::Clicker::Data::Series->new(
      keys    => [1],
      values  => [5.8],
    )
  ])
);
Adding one extra data point (key and value) avoids it. Off-by-one somewhere perhaps? Just looking quickly at the relevant if() it looks like the range of the axis doesn't get calculated properly (i.e. it's 0) when there's just one data point.
A declarative, efficient, and flexible JavaScript library for building user interfaces.
🖖 Vue.js is a progressive, incrementally-adoptable JavaScript framework for building UI on the web.
TypeScript is a superset of JavaScript that compiles to clean JavaScript output.
An Open Source Machine Learning Framework for Everyone
The Web framework for perfectionists with deadlines.
A PHP framework for web artisans
Bring data to life with SVG, Canvas and HTML. 📊📈🎉
JavaScript (JS) is a lightweight interpreted programming language with first-class functions.
Some thing interesting about web. New door for the world.
A server is a program made to process requests and deliver data to clients.
Machine learning is a way of modeling and interpreting data that allows a piece of software to respond intelligently.
Some thing interesting about visualization, use data art
Some thing interesting about game, make everyone happy.
We are working to build community through open source technology. NB: members must have two-factor auth.
Open source projects and samples from Microsoft.
Google ❤️ Open Source for everyone.
Alibaba Open Source for everyone
Data-Driven Documents codes.
China tencent open source team.


