Giter Site home page Giter Site logo

hrbrmstr / streamgraph Goto Github PK

View Code? Open in Web Editor NEW
147.0 15.0 49.0 2.21 MB

:wavy_dash: htmlwidget for creating streamgraph visualizations in R

Home Page: http://hrbrmstr.github.io/streamgraph/

License: Other

R 1.12% CSS 2.14% JavaScript 1.03% HTML 95.72%
r rstats streamgraph htmlwidgets data-visualization data-visualisation

streamgraph's Introduction

streamgraph

streamgraph is an htmlwidget for making, well, streamgraphs.

example

Sample Rmd

A streamgraph (or "stream graph") is a type of stacked area graph which is displaced around a central axis, resulting in a flowing, organic shape. Streamgraphs were developed by Lee Byron and popularized by their use in a February 2008 New York Times article on movie box office revenues. (Wikipedia)

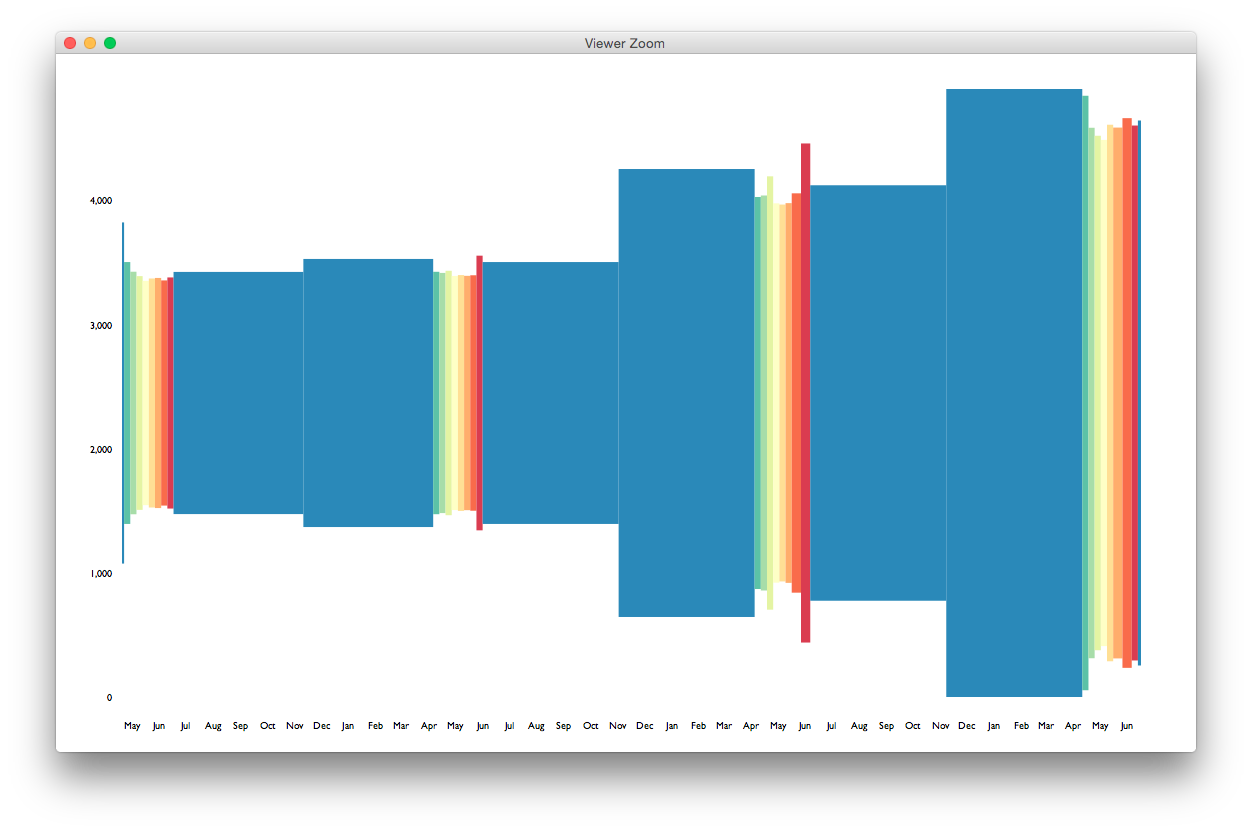
The x axis values can be continous or dates.

TODO

  • Support is planned for xts objects, but not for a bit.
  • Support for categorical/discrete x axis

The following functions are implemented:

  • streamgraph : Create a new streamgraph
  • sg_axis_x : Modify streamgraph x axis formatting
  • sg_axis_y : Modify streamgraph y axis formatting
  • sg_colors : Modify streamgraph axis text, legend popup label text and tooltip text colors (NOTE: no longer modifies fill colors, use sg_fill_* for fill colors)
  • sg_legend : Add select menu "legend" to interactive streamgraphs
  • sg_fill_brewer : Specify a ColorBrewer palette to use for the stream fills
  • sg_fill_manual : Specify a manual color palette to use for the stream fills
  • sg_fill_tableau : Specify a Tableau color palette to use for the stream flls
  • sg_add_marker : Annotate streamgraph with vertical line and label
  • sg_annotate : Annotate streamgraph with a label

News

  • Version 0.8.1 released - ggplot2 movies fix; corrected numerous notes from CRAN check
  • Version 0.8 released - support for negative Y axis numbers and upgrade to latest D3
  • Version 0.7.5 released - key, value and date can be either bare or quoted
  • Version 0.7 released - New sg_add_marker and sg_annotation to enable annotation of streamgraphs
  • Version 0.6 released - New scale parameter to streamgraph lets you choose between continuous or date scales.
  • Version 0.5.1 released - sg_colors now has nothing to do with the stream fills but does set the axis text, legend popup label text and tooltip text.
  • Version 0.5 released - deprecated use of sg_colors. Its functionality will change soon and is replaced by three sg_fill_* functions (brewer, manual and tableau) which makes more sense, is aligned to the ggplot2 way of specifying fill aesthetics and now makes it easier to highly customize the streamgraph appearance.
  • Versioin 0.4.2 released - fixed bug (thanks to teammate @bhaskarvk) that causes inconsistent color rendering for each area component (noticeable on resize of flexible width/height graphs)
  • Version 0.4.1 released - removed warning message when supplying POSIXct values (remember, POSIXct still only works for granularities >= 1 day)
  • Version 0.4 released - select menu "legend" (interactive only)
  • Version 0.3.1 released - bug fix to fix error with d3.stack; streamgraph will now see if the date input is a year and automatically convert it to the necessary format (no need to use as.Date)
  • Version 0.3 released - folks can have some fun with new offset and interpolate parameters to streamgraph
  • Version 0.2.2 relased - rly rly rly fixed tooltips now, also assed ability to format y axis text
  • Version 0.2.1 released - ok, working tool tips for realz now
  • Version 0.2 released - working SVG tooltips; general code cleanup
  • Version 0.1 released

Installation

devtools::install_github("hrbrmstr/streamgraph")

Usage

library(streamgraph)

# current verison
packageVersion("streamgraph")

library(dplyr)

ggplot2movies::movies %>%
  select(year, Action, Animation, Comedy, Drama, Documentary, Romance, Short) %>%
  tidyr::gather(genre, value, -year) %>%
  group_by(year, genre) %>%
  tally(wt=value) -> dat

streamgraph(dat, "genre", "n", "year", interactive=TRUE) %>%
  sg_axis_x(20, "year", "%Y") %>%
  sg_fill_brewer("PuOr")

Please note that this project is released with a Contributor Code of Conduct. By participating in this project you agree to abide by its terms.

streamgraph's People

Contributors

hrbrmstr avatar shrektan avatar

Stargazers

 avatar  avatar  avatar  avatar  avatar  avatar  avatar  avatar  avatar  avatar  avatar  avatar  avatar  avatar  avatar  avatar  avatar  avatar  avatar  avatar  avatar  avatar  avatar  avatar  avatar  avatar  avatar  avatar  avatar  avatar  avatar  avatar  avatar  avatar  avatar  avatar  avatar  avatar  avatar  avatar  avatar  avatar  avatar  avatar  avatar  avatar  avatar  avatar  avatar  avatar  avatar  avatar  avatar  avatar  avatar  avatar  avatar  avatar  avatar  avatar  avatar  avatar  avatar  avatar  avatar  avatar  avatar  avatar  avatar  avatar  avatar  avatar  avatar  avatar  avatar  avatar  avatar  avatar  avatar  avatar  avatar  avatar  avatar  avatar  avatar  avatar  avatar  avatar  avatar  avatar  avatar  avatar  avatar  avatar  avatar  avatar  avatar  avatar  avatar  avatar

Watchers

 avatar  avatar  avatar  avatar  avatar  avatar  avatar  avatar  avatar  avatar  avatar  avatar  avatar  avatar  avatar

streamgraph's Issues

Setting Background Color (esp. to Black)

We love streamgraph! But our immediate use requires a black blackground; we can't find a way to do this.

Thought we might find it under sg_colors() but no...

Thanks!

Okay, I was wrong

We do use arpa for things. Good news: the thing we use it for, asio has. So let's use that.

drilldown options

can I added drill down options to the package, I started testing locally but wanted to see if you have a better idea?

Licensing?

Hello @hrbrmstr,
Thank you for your package. It produces very pleasing plots, and I am for sure using it and also modifying it to fit my needs. I do need to ask you, because your license file only lists your copyright notice, if there could be a way to integrate it with my modifications in GPL/MIT or otherwise open source licensed software. In sum, I wanted to ask you if you think you can or want to release it with an open source license file.

Thank you for your time. I'm pretty sure you are a very busy guy.

Error in value[[3L]](cond) : cannot change working directory

Hello, I'm trying to reproduce one of your examples in SAP Cloud Analytics (SAC). The example works fine in Studio outside of SAC, but it throws the following error when executing it:

Warning in dir.create(www_dir) : cannot create dir '(null).1003.1003/viewhtml2286683e12f', reason 'No such file or directory'
Error in value[3L] : cannot change working directory

The script is:
library(dplyr)
library(babynames)
library(streamgraph)
library(magrittr)

babynames %>%
filter(grepl("^Kr", name)) %>%
group_by(year, name) %>%
tally(wt=n) %>%
streamgraph("name", "nn", "year")

Any idea how to approach this problem?

Thanks,
MJ

streamgraphs and rCharts

First I want to congratulate you on the excellent package. Second I have a problem of an apparently interaction with rCharts package. In a shiny streamgraphs does not show the x axis values. I hope it is clear by the following example.

library(shiny)
library(dplyr)
library(rCharts)
library(babynames)
library(streamgraph)

server <- function(input, output) {
  output$chartDepo <- renderChart2({
    hair_eye = as.data.frame(HairEyeColor)
  p2 <- nPlot(Freq ~ Hair, group = 'Eye',
              data = subset(hair_eye, Sex == "Female"),
              type = 'multiBarChart'
  )
  p2$chart(color = c('brown', 'blue', '#594c26', 'green'))
  return(p2)
})

  stgr1 <- babynames %>%
    filter(grepl("^Kr", name)) %>%
    group_by(year, name) %>%
    tally(wt=n) %>%
    streamgraph("name", "n", "year")
  output$stgr1 <- renderStreamgraph(stgr1)
}

ui <- fluidPage(
  sidebarLayout(
    sidebarPanel(
      ),
    mainPanel(              showOutput("chartDepo", "nvd3"),
      streamgraphOutput('stgr1')

              )
  )
)

shinyApp(ui = ui, server = server)

Regards,

Daniel Merino

Could not find function arrange

FYI:

> streamgraph(dat, key = "key", value = "value", date = "date")
Error in function_list[[k]](value) : could not find function "arrange"

so I loaded plyr and it fixed it

library(plyr)

ggplot2::movies now is its own CRAN pkg: need update in streamgraph vignette

Really enjoy your work. Playing with your vignette last night and found a dependency change

This is from Data Expectations section of vignette; needs a sligth update in sourcing movie data from ggplot2:

ggplot2::movies %>%      # change this line
  select(year, Action, Animation, Comedy, Drama, Documentary, Romance, Short) %>%
  tidyr::gather(genre, value, -year) %>%
  group_by(year, genre) %>%
  tally(wt=value) %>%
  ungroup %>%
  streamgraph("genre", "n", "year") %>%
  sg_axis_x(20) %>%
  sg_fill_brewer("PuOr") %>%
  sg_legend(show=TRUE, label="Genres: ")

it now should be

install.packages("ggplot2movies")

ggplot2movies::movies %>%      
  select(year, Action, Animation, Comedy, Drama, Documentary, Romance, Short) %>%
  tidyr::gather(genre, value, -year) %>%
  group_by(year, genre) %>%
  tally(wt=value) %>%
  ungroup %>%
  streamgraph("genre", "n", "year") %>%
  sg_axis_x(20) %>%
  sg_fill_brewer("PuOr") %>%
  sg_legend(show=TRUE, label="Genres: ")

y-axis labels?

Is it possible to add a y-axis label to a stream graph? I did not see any labels in the examples or code to add one.

Issue installing package

I'm having an issue adding the streamgraph package to RStudio 1.0.153 running R 3.4.1.

Console dump is below. The issue is clearly that there is a space in the "Program Files" folder name, but I'm not sure what to do about that. Thanks.

> devtools::install_github("hrbrmstr/streamgraph")
Downloading GitHub repo hrbrmstr/streamgraph@master
from URL https://api.github.com/repos/hrbrmstr/streamgraph/zipball/master
Installing streamgraph
"D:/Program Files/R/R-3.4.1/bin/x64/R" --no-site-file --no-environ --no-save --no-restore --quiet CMD INSTALL  \
  "C:/Users/Julien/AppData/Local/Temp/Rtmpuw4ku3/devtools255855ea2a61/hrbrmstr-streamgraph-16aee37"  \
  --library="D:/Program Files/R/R-3.4.1/library" --install-tests 

'D:\Program' is not recognized as an internal or external command,
operable program or batch file.
Installation failed: Command failed (1)

function missing

i can find the function sg_add_marker() in the help pages but it seems missing.
no errors while installing the latest package version 0.8.1 on R.3.4.2

> g%>%  sg_add_marker(x=2010,"ahoi")
Error in sg_add_marker(., x = 2010, "ahoi") : 
  could not find function "sg_add_marker"
> ls("package:streamgraph")
 [1] "%>%"               "renderStreamgraph" "sg_annotate"       "sg_axis_x"         "sg_axis_y"        
 [6] "sg_colors"         "sg_fill_brewer"    "sg_fill_manual"    "sg_fill_tableau"   "sg_legend"        
[11] "sg_title"          "streamgraph"       "streamgraphOutput" "widgetThumbnail"

keep up the good work.
cheers!

Stop x-axis ticks at start of month or year

With the following formatting:
sg_axis_x(sg, tick_interval = "day", tick_units = 10)

I get tick marks every 10 days and at the beginning of every month.
Similarly for tick_interval = "month" there is a tick at the start of every year as well as ticks at the required interval.

Is there any way to stop these extra tick appearing?
Thanks

Warning if supplied date is of class POSIXct

In if (class(data$date) %in% c("numeric", "character", "integer")) { :
the condition has length > 1 and only the first element will be used

Since the plotting works fine with a date variable of class POSIXct, I think there shouldn't be a warning in this case.

Add tick marks on both axes?

This is a great package - and it produces excellent visualisations. I can only add axis labels (years, for example) but haven't been able to add tick marks.
Something like this from the d3 library:
.axis path,
.axis line {
fill: none;
stroke: black;
shape-rendering: crispEdges;
}
@hrbrmstr

R version 3.3.2

Hey there - I'm dying to use this package, but I had to update to newest R version (3.3.2) to get rid of an Rcpp error, and now it tells me your package is not available on 3.3.2 :-(

Shiny

Does this library currently support shiny?

FR: Manually specifiy colors provided to sg_colors

Consider the example data:

ggplot2::movies %>%
  select(year, Action, Animation, Comedy, Drama, Documentary, Romance, Short) %>%
  tidyr::gather(genre, value, -year) %>%
  group_by(year, genre) %>%
  tally(wt=value) %>% head

  year       genre n
1 1893      Action 0
2 1893   Animation 0
3 1893      Comedy 0
4 1893       Drama 0
5 1893 Documentary 0
6 1893     Romance 0

I would like to manually specifiy the colour for each value of genre instead of relying on a predefined palette.
A named vector would suffice, such as:

c(Action = "black", Animation = "grey", Comedy = "blue", …)

This would allow greater customizability of the output, and also be more intuitive for people like me, who are used to ggplot2 and it's scale specifications.

Error in installation

Hi,

I couldn't install this package, and the problem is as followng:

Downloading GitHub repo hrbrmstr/streamgraph@master
from URL https://api.github.com/repos/hrbrmstr/streamgraph/zipball/master
Installing streamgraph
"D:/PROGRA1/R-331.1/bin/x64/R" --no-site-file --no-environ --no-save --no-restore --quiet CMD
INSTALL
"C:/Users/dell/AppData/Local/Temp/RtmpOITlnh/devtools217072476372/hrbrmstr-streamgraph-16aee37"
--library="D:/Program File/R-3.3.1/library" --install-tests

  • installing source package 'streamgraph' ...
    ** R
    ** inst
    ** tests
    ** preparing package for lazy loading
    Error in loadNamespace(j <- i[[1L]], c(lib.loc, .libPaths()), versionCheck = vI[[j]]) :
    there is no package called 'zoo'
    ERROR: lazy loading failed for package 'streamgraph'
  • removing 'D:/Program File/R-3.3.1/library/streamgraph'
    Error: Command failed (1)

I'd really appreciate if anyone can help me with it. Thanks a lot!

CRAN?

Hi @hrbrmstr ,

This is an excellent, well written package that is one of the better examples of how to use D3 in HTMLWidgets. I tried making a d3-htmlwidget at some point and got bogged down on a few things that you've figured out nicely - interactivity, select boxes, etc). In any event, I just nominated this for inclusion on HTMLWidgets.org but was told that the package needs to be on CRAN. Just wanted to voice support for a release on CRAN and inclusion in HTML widgets.

zach cp

Do not install

I'm using R 3.6.1.
devtools::install_github("hrbrmstr/streamgraph")

error:
Error: Failed to install 'streamgraph' from GitHub:
(converted from warning) cannot remove prior installation of package ‘digest’

Problem to stack some factors in the graphic

Hi, first i want to thank you for create this widget.

I have trouble to create a graphic with step interpolation and offset zero for 19 variables in a period of 365 days. Look at the result here http://bibliolabs.cc/visualizaciones/FlujoUsuarios1/

I took the expand part from the streamgraph function and seem that for each category with the problem the result length after the expansion is different. I get lengths of 365 for some categories anothers of 366 and one of 369. I suspect that the issue is there. ¿Did you see something similar before? ¿Any clue?

Thanks

FR: Use numeric, non-date variables as x-var

I was wondering if I could use non-date variables on the x axis for data that is inherently sequential, but not necessarily timestamped.

Take for example trakt.tv episode data (sorry for plugging my own package):

devtools::install_github("jemus42/tRakt")
library(tRakt); library(dplyr) 
get_trakt_credentials(client.id = "12fc1de7671c7f2fb4a8ac08ba7c9f45b447f4d5bad5e11e3490823d629afdf2")

got <- trakt.getEpisodeData(target = "game-of-thrones", season_nums = c(1, 2, 3, 4))

got %>% select(epnum, rating, votes, season, episode) %>% head
  epnum  rating votes season episode
1     1 8.71855  2750      1       1
2     2 8.69493  2111      1       2
3     3 8.60256  1955      1       3
4     4 8.67887  1884      1       4 
5     5 8.71903  1808      1       5
6     6 8.95666  1846      1       6

I was hoping to generate a stream of episodes, but since a variable that can be coerced to a date is expected, this

got %>%
  streamgraph("episode", "votes", "epnum", offset = "zero", interpolate = "step") 

fails with

Error in as.Date.numeric(c(1L, 2L, 3L, 4L, 5L, 6L, 7L, 8L, 9L, 10L, 11L, : 'origin' must be supplied

I did try to use the episode airdates instead of the absolute episode number, but the result seems… weird.
Example:

got %>% streamgraph("episode", "votes", "firstaired.posix", interpolate = "step")

Produces unevenly sized bars because of the irregularities in the airdates

unevenly sized bars

I'm not sure if what I'm asking is even possible or meant to be possible within this package, but since I'm very happy about the possibilities this package presents, I thought this might be a low hanging fruit.

Plot not appearing in RStudio

First stab with 0.3. and I'm getting a problem trying to use some babynames data
With your example

     str(dat)
    Classes ‘tbl_df’, ‘tbl’ and 'data.frame':   791 obs. of  3 variables:
     $ year : Date, format: "1893-01-01" "1893-01-01" ...
     $ genre: Factor w/ 7 levels "Action","Animation",..: 1 2 3 4 5 6 7 1 2 3 ...
     $ n    : int  0 0 0 0 0 0 1 0 0 0 ...

streamgraph(dat, "genre", "n", "year", interactive=TRUE)

No problemo

My data is very similar (I even named the columns the same)

       str(namesDat)
        Classes ‘tbl_df’, ‘tbl’ and 'data.frame':   1135 obs. of  3 variables:
         $ year : Date, format: "1880-01-01" "1880-01-01" ...
         $ genre: Factor w/ 9 levels "Charles","George",..: 5 9 4 1 2 3 8 7 5 9 ...
         $ n    : int  9655 9532 5927 5348 5126 404 103 22 8769 8524 ...


         streamgraph(namesDat, "genre", "n", "year", interactive=TRUE)

No error in console but blank RStudio viewer and browser

Probably overlooking something obvious

Continuous variables on x-axis not supported yet?

Hi,

Was just checking some already resolved issues, and one mentioned that the latest package will have support for continuous variables on the x-axis.

I was checking with toy data and unfortunately could not produce a streamgraph with continuous x-axis variables.

library(streamgraph)
library(dplyr)

df1 <- read.table(text = '
Sector  Month   Sales
IT  Jan 20
Health  Jan 30
Govt    Jan 40
Space   Jan 20
Tourism Jan 10
IT  Feb 30
Health  Feb 20
Govt    Feb 400
Space   Feb 700
Tourism Feb 300
IT  Mar 30
Health  Mar 20
Govt    Mar 40
Space   Mar 20
Tourism Mar 300
', header = TRUE)

df1$Month <- factor(df1$Month, levels = c('Jan', 'Feb', 'Mar'), ordered = TRUE)
df1$Sector <- factor(df1$Sector)
df1$monOrder <- as.numeric(df1$Month)

df1 %>% streamgraph('Sector', 'Sales', 'monOrder')
#Error: 'origin' must be supplied

I have streamgraph_0.7 currently loaded.

Error when trying out the reproducible example

I've just installed the latest version of streamgraph (0.7) and get the following error.

ggplot2::movies %>%
select(year, Action, Animation, Comedy, Drama, Documentary, Romance, Short) %>%
tidyr::gather(genre, value, -year) %>%
group_by(year, genre) %>%
tally(wt=value) %>%
ungroup %>%
mutate(year=as.Date(sprintf("%d-01-01", year))) -> dat 

streamgraph(dat, "genre", "n", "year")

Error in expand_(data, dots) : object '.' not found

sessionInfo()
R version 3.1.0 (2014-04-10)
Platform: x86_64-unknown-linux-gnu (64-bit)

locale:
[1] LC_CTYPE=en_US.UTF-8       LC_NUMERIC=C               LC_TIME=en_US.UTF-8        LC_COLLATE=en_US.UTF-8     LC_MONETARY=en_US.UTF-8   
[6] LC_MESSAGES=en_US.UTF-8    LC_PAPER=en_US.UTF-8       LC_NAME=C                  LC_ADDRESS=C               LC_TELEPHONE=C            
[11] LC_MEASUREMENT=en_US.UTF-8 LC_IDENTIFICATION=C       

attached base packages:
[1] stats     graphics  grDevices utils     datasets  methods   base     

other attached packages:
[1] streamgraph_0.7   htmltools_0.2.6   htmlwidgets_0.3.2 dplyr_0.4.0      

loaded via a namespace (and not attached):
[1] assertthat_0.1     colorspace_1.2-4   DBI_0.3.1          dichromat_2.0-0    digest_0.6.4       ggplot2_1.0.0      grid_3.1.0         gtable_0.1.2      
 [9] labeling_0.2       lattice_0.20-29    lazyeval_0.1.10    magrittr_1.0.1     MASS_7.3-31        munsell_0.4.2      parallel_3.1.0     plyr_1.8.1        
[17] proto_0.3-10       RColorBrewer_1.0-5 Rcpp_0.11.3        reshape2_1.2.2     RJSONIO_1.0-3      scales_0.2.3       stringr_0.6.2      tidyr_0.2.0       
[25] tools_3.1.0        xts_0.9-7          zoo_1.7-10 

Streamgraph not showing with other htmlwidget output in Shiny app

First, I would like to thank youto provide us this excellent package. While using this plot function along with ggiraph, I figured out that I can not visualize the streamgraph plot in Shiny App, although I could see both the plots on RStudio. Also, I do not see any error message only the output plot area is blank, nothing rendered! When commenting out (#ggiraphOutput('Bubble')) I can again see the streampgraph output. Has any one encounter similar experience and how to solve the issue?
For your reference, here is the code one can try in Shiny.
Thanks a lot for your help.

library(shiny)
library(dplyr)
library(babynames)
library(streamgraph)
library(packcircles)
library(ggplot2)
library(viridis)
library(ggiraph)

ui <- shinyUI(
  mainPanel(
    streamgraphOutput("streamPlot"),
    ggiraphOutput('Bubble')
    
  )
)

server <- shinyServer(function(input, output) {
  
  bn <- babynames %>%
    filter(grepl("^Kr", name)) %>%
    group_by(year, name) %>%
    tally(wt=n)
  
  output$streamPlot <- renderStreamgraph({
    browser()
    streamgraph(bn, "name", "nn", "year", interactive=FALSE) 
  })
  
  output$Bubble <- renderggiraph({
    # Create data
    browser()
    data=data.frame(group=paste("Group_", sample(letters, 70, replace=T), sample(letters, 70, replace=T), sample(letters, 70, replace=T), sep="" ), value=sample(seq(1,70),70)) 
    
    # Add a column with the text you want to display for each bubble:
    data$text=paste("name: ",data$group, "\n", "value:", data$value, "\n", "You can add a story here!")
    
    # Generate the layout
    packing <- circleProgressiveLayout(data$value, sizetype='area')
    data = cbind(data, packing)
    dat.gg <- circleLayoutVertices(packing, npoints=50)
    
    # Make the plot with a few differences compared to the static version:
    p=ggplot() + 
      geom_polygon_interactive(data = dat.gg, aes(x, y, group = id, fill=id, tooltip = data$text[id], data_id = id), colour = "black", alpha = 0.6) +
      scale_fill_viridis() +
      geom_text(data = data, aes(x, y, label = gsub("Group_", "", group)), size=2, color="black") +
      theme_void() + 
      theme(legend.position="none", plot.margin=unit(c(0,0,0,0),"cm") ) + 
      coord_equal()
    
    ggiraph(ggobj = p, width_svg = 7, height_svg = 7)
    
  })
  
})

shinyApp(ui, server)

Tooltips not working fully

Tooltips appear not be returning the keyed values but other than this BEAUTIFUL new package.

Here is my example:

packages <-
  c('dplyr','magrittr','tidyr','streamgraph')
lapply(packages,library, character.only = T)
df <-
  'http://asbcllc.com/blog/2015/february/cre_stream_graph_test/data/cre_transaction-data.csv' %>%
  read.csv() %>%
  data.frame() %>%
  tbl_df

data_wide <-
  df[,c(1:3,5,7,9,11,13)]

names(data_wide) <-
  c('year','all','office','industrial','retail','multifamily','hotel','land')
data_long <-
  data %>% tidyr::gather(asset_class,volume_billions,-year)

dat_cre <-
  data_long %>%
  filter(year >= 2005) %>%
  filter(!asset_class == 'all') %>%
  mutate(year = sprintf("%d-12-31", year) %>%
          as.Date() #add the date
  )

dat_cre %>%
  streamgraph("asset_class", "volume_billions", "year",
              interactive=TRUE) %>%
  sg_axis_x(1, "year", "%m-%Y") %>% #1 year increments
  sg_axis_y(75) %>% 
  sg_colors("PuOr")

Continous data gives problems with sg_title, sg_annotate, and sg_add_marker

When using the continuous data option, it runs into the following problems:

  • The sg_title() function does not seem to work, and actually adjusts the plot size.
  • The sg_annotate() function does not work.

Also, my package cannot find the sg_add_marker() function, although it is mentioned as being functional.

Here is my code for replication:

temp <- data.frame("type"= letters[1:10], "id"= 1:10, "data"= 1:10)

streamgraph(temp, "type", "data", "id",
            interpolate="cardinal", scale = "continuous", width="800px") %>% 
  sg_legend(show=TRUE, label="Collection ID: ") %>% 
  sg_fill_brewer("RdPu") %>% 
  sg_title("test") %>% # does not work
  sg_annotate("test",2,2) # %>% sg_add_marker("test", x=7) # both do not work

EDIT:
Scratch that, the annotate works, I was just not passing in x and y correctly. However, It will draw if I pass in "[number]px" to x and y, but changing the number does not change the position in the graph.

controlling order in streamgraph

This is a fantastic widget, thank you for developing it. I had a question regarding order of the categories. Currently, it is controlled by the ordering of the factor levels, as far as I can see. Is it possible to control the order using an order= option, like in ggplot?

get interactive within Shiny

I saw your code to display the streamgraph within Shiny (Closed issue #6).
I would like to catch events like getting coordinates from mouse click or getting the clicked elements back to Shiny server so I could use it to update other graphics, add or remove lines in the streamgraph... Is there ways to do that?
Thanks a lot

Set a fixed y-axis

I was wondering if it was possible to set a fixed y-axis for a plot. It seems as though the axis is calculated from the maximum data point, but for my purposes I need multiple datasets to have the same axis to be interpretable.

Would appreciate any help on this!

Recommend Projects

  • React photo React

    A declarative, efficient, and flexible JavaScript library for building user interfaces.

  • Vue.js photo Vue.js

    🖖 Vue.js is a progressive, incrementally-adoptable JavaScript framework for building UI on the web.

  • Typescript photo Typescript

    TypeScript is a superset of JavaScript that compiles to clean JavaScript output.

  • TensorFlow photo TensorFlow

    An Open Source Machine Learning Framework for Everyone

  • Django photo Django

    The Web framework for perfectionists with deadlines.

  • D3 photo D3

    Bring data to life with SVG, Canvas and HTML. 📊📈🎉

Recommend Topics

  • javascript

    JavaScript (JS) is a lightweight interpreted programming language with first-class functions.

  • web

    Some thing interesting about web. New door for the world.

  • server

    A server is a program made to process requests and deliver data to clients.

  • Machine learning

    Machine learning is a way of modeling and interpreting data that allows a piece of software to respond intelligently.

  • Game

    Some thing interesting about game, make everyone happy.

Recommend Org

  • Facebook photo Facebook

    We are working to build community through open source technology. NB: members must have two-factor auth.

  • Microsoft photo Microsoft

    Open source projects and samples from Microsoft.

  • Google photo Google

    Google ❤️ Open Source for everyone.

  • D3 photo D3

    Data-Driven Documents codes.