Giter Site home page Giter Site logo

javierhonduco / rbperf Goto Github PK

View Code? Open in Web Editor NEW
116.0 10.0 5.0 1.95 MB

Low-overhead sampling profiler and tracer for Ruby for Linux

License: MIT License

Shell 2.54% C 16.29% Ruby 1.18% Rust 77.25% Just 0.97% Nix 1.76%
ruby bpf performance profilers flamegraph tracer

rbperf's Introduction

rbperf

rbperf is a low-overhead sampling profiler and tracer for Ruby (CRuby) which runs in BPF

Features

The main goals for rbperf are

  • On-CPU profiling support
  • Low overhead
  • Profiled processes don't have to be restarted or modified in any way
  • Support for tracing low level events, such as system calls

Installation

The latest release of is available here.

Usage

CPU sampling

$ sudo rbperf record --pid `pidof ruby` cpu

System call tracing

The available system calls to trace can be found with:

$ sudo rbperf record --pid `pidof ruby` syscall --list
$ sudo rbperf record --pid `pidof ruby` syscall enter_writev

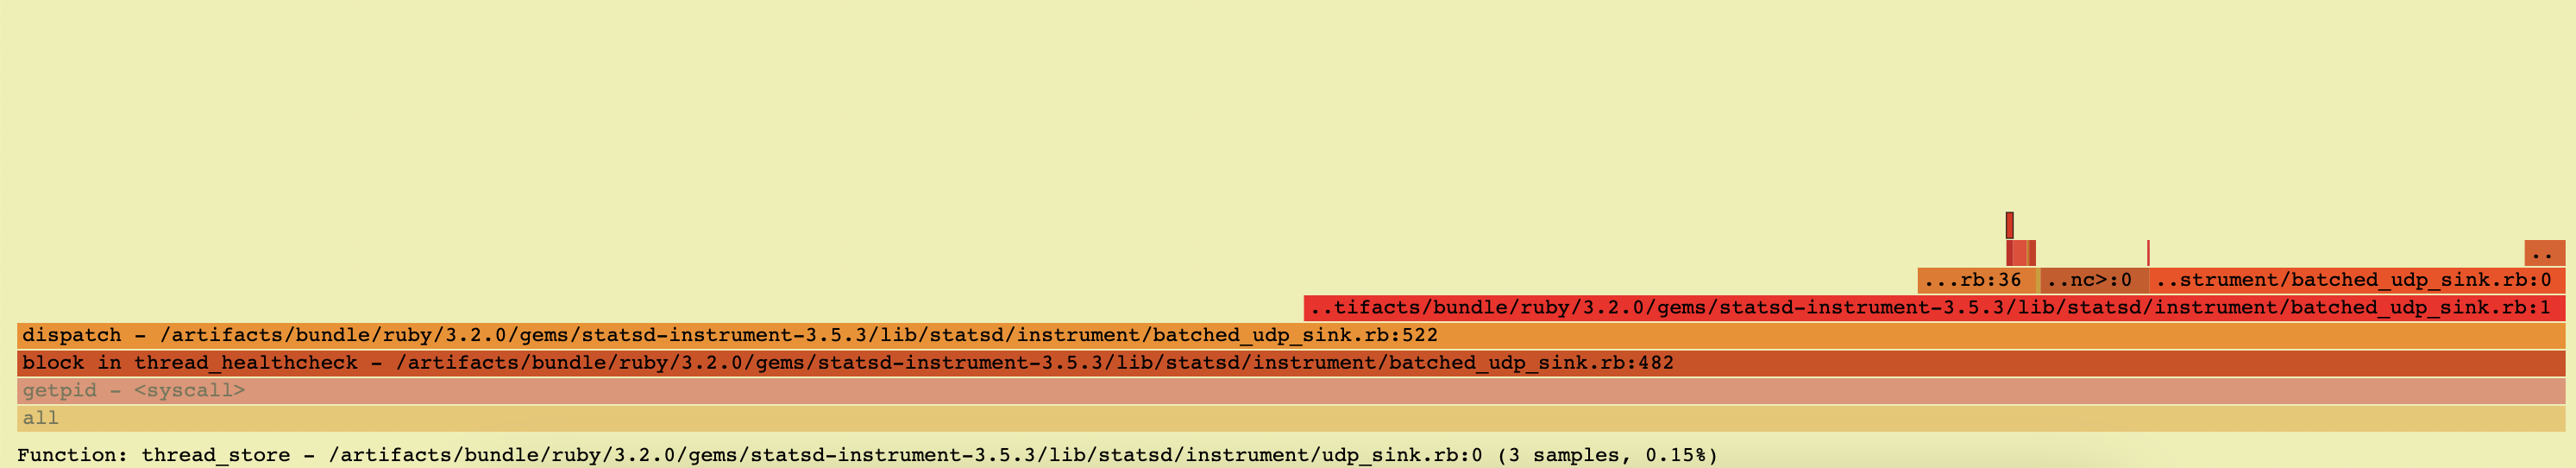
Some debug information will be printed, and a flamegraph called rbperf_flame_$date will be written to disk ๐ŸŽ‰

Supported Ruby versions

The currently supported Ruby versions:

  • 2.6: 2.6.0, 2.6.3
  • 2.7: 2.7.1, 2.7.4, 2.7.6
  • 3.x: 3.0.0, 3.0.4, 3.1.2, 3.1.3, 3.2.0, 3.2.1

Supported kernels

Linux kernel 4.18 is the minimum required version but 5.x and greater is recommended.

Building

To build rbperf you would need a modern Linux machine with:

  • The Rust toolchain
  • clang to compile the BPF code
  • elfutils and zlib installed
  • make and pkg-config to build libbpf

Once the dependencies are installed:

# As we are statically linking elfutils and zlib, we have to tell Rustc
# where are they located. On my Ubuntu system they are under
$ export RUSTFLAGS='-L /usr/lib/x86_64-linux-gnu'
$ cargo build [--release]

The built binary can be found under target/(debug|release)/rbperf.

Developing and troubleshooting

Debug logs can be enabled with RUST_LOG=debug. The info subcommand, rbperf info shows the supported BPF features as well as other supported details.

Stability

rbperf is in active development and the CLI and APIs might change any time

Bugs

If you encounter any bugs, feel free to open an issue on rbperf's repo

Acknowledgements

rbperf wouldn't be possible without all the open source projects that we benefit from, such as Rust and all the superb crates we use in this project, Ruby and its GDB file, the BPF ecosystem, and many others!

License

Licensed under the MIT license

rbperf's People

Contributors

ivoanjo avatar javierhonduco avatar manuelfelipe avatar noxiouz avatar shaver avatar singhaditya28 avatar

Stargazers

 avatar  avatar  avatar  avatar  avatar  avatar  avatar  avatar  avatar  avatar  avatar  avatar  avatar  avatar  avatar  avatar  avatar  avatar  avatar  avatar  avatar  avatar  avatar  avatar  avatar  avatar  avatar  avatar  avatar  avatar  avatar  avatar  avatar  avatar  avatar  avatar  avatar  avatar  avatar  avatar  avatar  avatar  avatar  avatar  avatar  avatar  avatar  avatar  avatar  avatar  avatar  avatar  avatar  avatar  avatar  avatar  avatar  avatar  avatar  avatar  avatar  avatar  avatar  avatar  avatar  avatar  avatar  avatar  avatar  avatar  avatar  avatar  avatar  avatar  avatar  avatar  avatar  avatar  avatar  avatar  avatar  avatar  avatar  avatar  avatar  avatar  avatar  avatar  avatar  avatar  avatar  avatar  avatar  avatar  avatar  avatar  avatar  avatar  avatar  avatar

Watchers

 avatar  avatar  avatar  avatar  avatar  avatar  avatar  avatar  avatar  avatar

rbperf's Issues

Add a mode to run a ruby process directly

Summary

This is a feature that several people have brought up. The idea would be to spawn a Ruby process directly and start profiling it. So instead of having to do this

# in one terminal or in the background
$ bundler run my_ruby_app
$ rbperf record --pid `pidof my_ruby_app` cpu

We could do

$ rbperf record --exec 'bundler run my_ruby_app' cpu

Possible implementation

This feature needs to control the execution of another process so the ptrace(2) system call is a good fit.

Something that this implementation might have to handle is the race condition between the moment when the process is executed and when all the libraries have been mapped in memory as there's a window when libruby, in the case of dynamically compiled CRuby, might not be mapped into memory yet, and we would have to fail to find the global data that rbperf needs to read

rbperf/src/process.rs

Lines 73 to 76 in 48ce25b

let ruby_version = ruby_version(&bin_path).unwrap();
debug!("Binary {:?}", bin_path);
let symbol = ruby_current_vm_address(&bin_path, &ruby_version)?;

syscall tracing: Show system call names

We could generate a 'synthetic' frame with the system call name. Having this information will be very useful in general, but especially when chrome tracing support is added

[feat] Bypass need for PMU with itimer?

Currently we cannot use rbspy in many cases because we don't broadly have PMU access in GCP.

It looks like this is what fails:

rbperf/src/events.rs

Lines 49 to 50 in a6aac37

type_: sys::bindings::PERF_TYPE_HARDWARE,
config: sys::bindings::PERF_COUNT_SW_CPU_CLOCK as u64,

I notice that we are still able to run async-profiler for JVM profiling, because they add the option to support itimer as the clock source rather than perf:

https://github.com/async-profiler/async-profiler/blob/cdb87041561e0cf8b0597c3263eb3c09a3d49b5c/src/profiler.cpp#L882

I wonder if the same thing can be done with rbperf?

It looks like syscall profiling should still work without this and would be useful, but because of #61 I can't give that a go either

perf: Measure overhead of running rbperf

rbperf has two components that ought to be analysed, the BPF stack walker, and all the userspace facilities to process the events sent by the BPF program that will be used to build the profiles.

The overhead of the userspace part can be measured with perf or with higher-level tools such as top or htop. Understanding the performance of the BPF program would be very interesting, but unfortunately, the readily available metrics aren't representative.

For example, bpftool can show the avg runtime for BPF programs as well as how many times they've run. As the Ruby stack walker has a very fast path when the program running isn't profiled and a slower path, when it has to walk the stack, having only average biases the result and doesn't give us the complete picture

[javierhonduco@fedora rbperf]$ sudo sysctl -w kernel.bpf_stats_enabled=1
kernel.bpf_stats_enabled = 1
[javierhonduco@fedora rbperf]$ sudo bpftool prog  show id 763
763: perf_event  name on_event  tag 97fe3cd3a6716fe2  gpl run_time_ns 61692489 run_cnt 54968
        loaded_at 2022-10-30T19:05:51+0000  uid 0
        xlated 1520B  jited 1009B  memlock 4096B  map_ids 1021,1025,1018,1017,1019
        btf_id 844
        pids rbperf(532862)

Having the distribution of the run time of the BPF program would be ideal. I am planning to work on a tool to get this data to get a more accurate understanding of the actual performance impact of running rbperf

Do not use random numbers as IDs for the frames

Perhaps generate monotonically IDs for the frames rather than relying on the random number generator. This will avoid a number of problems but mostly:

  • will be faster, we'll have to run less code;
  • will reduce the chance of collisions;

This was on the back burner for a little while but now because a real problem for @manuelfelipe

setup_perf_event fails with ENODEV (`perf` works)

Hi there,

When I run the suggested steps in tests/programs/Dockerfile.server, rbperf errors out with

pid: 38686
libruby: /usr/local/lib/libruby.so.3.0.0 @ 0x7f54251d7000
ruby main thread address: 0x7f5425598138
process base address: 0x55b26e96f000
ruby version: "3.0.0"

Error: setup_perf_event failed with errno No such device

According to the perf_event_open(2) docs, this indicates that my CPU is missing a feature, but standard Linux perf can sample from that ruby process without problem.

My cpuinfo is attached in case it's helpful (AMD 5800X3D): cpuinfo.txt

I'm running kernel Linux CRAGNOR 6.0.9-arch1-1 #1 SMP PREEMPT_DYNAMIC Wed, 16 Nov 2022 17:01:17 +0000 x86_64 GNU/Linux

I'm not sure if it's a configuration issue (in which case I'll submit a PR for README.md) or some limitation of the way that rbperf is configuring the perf events.

Improve error handling when reading maps

The current error handling is too extreme, we should just ignore samples that fail reading values due to small maps, etc. Let's keep account of how often these errors happen to notify of this and perhaps redimension the maps

Add integration test for garbled stacktraces

if method_name.is_err() {

p ((struct RString)(*((rb_control_frame_t*) (ruby_current_vm_ptr->ractor->main_thread->ec->vm_stack + ruby_current_vm_ptr->ractor->main_thread->ec->vm_stack_size) - 2).iseq.body.location.label)).as.heap.ptr
set *(0x7fd016296c42+2) = 0xf
set {char [10]} 0x7fd016296c42 = 0xf

[feat] Ruby 3.2.0 structs

Howdy @javierhonduco ! Have been kicking the tires on this and would love to try out some of the features in production.

Unfortunately, as we are perennially on the newest ruby, it is difficult to keep up with the struct offsets / version compatibility concerns.

I notice that it looks like this project pulls the struct info from rbspy.

Perhaps if you could add some documentation / a general explanation on your process for how to bump the struct offsets, I or someone on my team could take a crack at bumping the ruby structs? It would be very instructive to give it a go either way.

Mismatched frame count issues

I see a lot of:

[2023-02-22T19:00:24Z ERROR rbperf::rbperf] mismatched expected=148 and received=129 frame count
[2023-02-22T19:00:24Z ERROR rbperf::rbperf] mismatched expected=145 and received=132 frame count
[2023-02-22T19:00:24Z ERROR rbperf::rbperf] mismatched expected=145 and received=132 frame count
[2023-02-22T19:00:24Z ERROR rbperf::rbperf] mismatched expected=145 and received=132 frame count
[2023-02-22T19:00:24Z ERROR rbperf::rbperf] mismatched expected=145 and received=132 frame count
[2023-02-22T19:00:24Z ERROR rbperf::rbperf] mismatched expected=145 and received=132 frame count
[2023-02-22T19:00:24Z ERROR rbperf::rbperf] mismatched expected=148 and received=129 frame count
[2023-02-22T19:00:24Z ERROR rbperf::rbperf] mismatched expected=148 and received=129 frame count
[2023-02-22T19:00:24Z ERROR rbperf::rbperf] mismatched expected=148 and received=129 frame count
[2023-02-22T19:00:24Z ERROR rbperf::rbperf] mismatched expected=176 and received=173 frame count
[2023-02-22T19:00:24Z ERROR rbperf::rbperf] mismatched expected=176 and received=170 frame count
[2023-02-22T19:00:24Z ERROR rbperf::rbperf] mismatched expected=184 and received=183 frame count
[2023-02-22T19:00:24Z ERROR rbperf::rbperf] mismatched expected=185 and received=184 frame count
[2023-02-22T19:00:24Z ERROR rbperf::rbperf] mismatched expected=185 and received=184 frame count
[2023-02-22T19:00:24Z ERROR rbperf::rbperf] mismatched expected=185 and received=184 frame count
[2023-02-22T19:00:24Z ERROR rbperf::rbperf] mismatched expected=224 and received=222 frame count
[2023-02-22T19:00:24Z ERROR rbperf::rbperf] mismatched expected=224 and received=222 frame count
[2023-02-22T19:00:24Z ERROR rbperf::rbperf] mismatched expected=224 and received=222 frame count
[2023-02-22T19:00:24Z ERROR rbperf::rbperf] mismatched expected=224 and received=222 frame count
[2023-02-22T19:00:24Z ERROR rbperf::rbperf] mismatched expected=234 and received=232 frame count
[2023-02-22T19:00:24Z ERROR rbperf::rbperf] mismatched expected=235 and received=233 frame count
[2023-02-22T19:00:24Z ERROR rbperf::rbperf] mismatched expected=234 and received=233 frame count
[2023-02-22T19:00:24Z ERROR rbperf::rbperf] mismatched expected=234 and received=233 frame count

I got a flame graph, but it is basically invalid because far more samples errored than were successful:

Got 10616 samples and 869805 errors

Originally posted by @dalehamel in #62 (comment)

Roadmap of potential features and fixes

Some of the things I have planned:

  • UX
    • Better error handling (e.g. when providing a wrong syscall tracepoint name, we don't handle that nicely and the UX is bad) (2abb8c0)
    • Allow running tests and whatnot with cargo (7c14cd0)
    • Add info subcommand to show environmental details that might affect rbperf to aid debugging (e81748a)
  • Quality
  • BPF
    • Logging is enabled by default in the BPF program. This has high overhead and it is not needed most of the time (422c5ca)
    • Evaluate using ring buffers
      • Add it as opt-in (8a1e048)
      • Run some tests to see how it behaviour compares to perf buffers
  • Docs
    • Add a document on architecture, as well as in-depth comments in the BPF code
    • How to debug issues
    • How to add support for Ruby versions

  • New features
    • Binary disk format
    • More output formats (folded stacks, chrome tracing, raw?)
    • Ensure it works in arm64
    • C function tracing, both from cruby or the libraries it dynamically links to (uprobes)

  • Experimental ideas
    • Allocation tracing (w/ mem leak detection)
    • Request-specific data

  • Other
    • Ensure we work with YJIT (asked in https://github.com/Shopify/yjit/. It works so far, but this might change)
    • Add git revision to the future info subcommand and in the BPF's metadata section

  • Release
    • Publish x86_64 binaries

Simplify execution context fetching:

(gdb) p/x ruby_current_vm_ptr->ractor->main_thread->ec
$1 = 0x20729b0
(gdb) p/x ruby_current_ec
$2 = 0x20729b0

[bug?] Stacks for syscall traces don't seem to make sense

I was hoping to use rbperf to figure out where our remaining calls to getpid are coming from (ref rails/rails#47418)

With the latest patches etc from #61 we are able to get some stack traces, but I don't think they are accurate:

Screenshot 2023-02-22 at 12 24 53 PM

This is from an open source repo, so we can look at the code and see that it doesn't look like Process.pid is being called from anywhere here:

https://github.com/Shopify/statsd-instrument/blob/master/lib/statsd/instrument/udp_sink.rb#L69

Also one of the wide bars here says it is in dispatch on line 522, but this file doesn't have 522 lines https://github.com/Shopify/statsd-instrument/blob/v3.5.3/lib/statsd/instrument/batched_udp_sink.rb (it has 183 lines).

I wonder if how rbperf collects stacks on syscalls is actually accurate?

I assume it is connecting a BPF probe to a tracepoint for entering/exiting the syscall, then it goes and grabs the ruby stack.

Could it be that it is grabbing the wrong thread somehow?

This is for a Unicorn worker, not Puma, but there are still some background threads happening. This batched udp sink is one of our top background threads, so I wonder if it is somehow being charged for another stack's getpid usage, just because it happens to be on CPU when the sample is taken?

syscall tracing: Add list subcommand

Rather than having to list them with sudo ls /sys/kernel/debug/tracing/events/syscalls/, a subcommand would be nice, something like:

$ rbperf record syscalls --list

or

$ rbperf list syscalls

Recommend Projects

  • React photo React

    A declarative, efficient, and flexible JavaScript library for building user interfaces.

  • Vue.js photo Vue.js

    ๐Ÿ–– Vue.js is a progressive, incrementally-adoptable JavaScript framework for building UI on the web.

  • Typescript photo Typescript

    TypeScript is a superset of JavaScript that compiles to clean JavaScript output.

  • TensorFlow photo TensorFlow

    An Open Source Machine Learning Framework for Everyone

  • Django photo Django

    The Web framework for perfectionists with deadlines.

  • D3 photo D3

    Bring data to life with SVG, Canvas and HTML. ๐Ÿ“Š๐Ÿ“ˆ๐ŸŽ‰

Recommend Topics

  • javascript

    JavaScript (JS) is a lightweight interpreted programming language with first-class functions.

  • web

    Some thing interesting about web. New door for the world.

  • server

    A server is a program made to process requests and deliver data to clients.

  • Machine learning

    Machine learning is a way of modeling and interpreting data that allows a piece of software to respond intelligently.

  • Game

    Some thing interesting about game, make everyone happy.

Recommend Org

  • Facebook photo Facebook

    We are working to build community through open source technology. NB: members must have two-factor auth.

  • Microsoft photo Microsoft

    Open source projects and samples from Microsoft.

  • Google photo Google

    Google โค๏ธ Open Source for everyone.

  • D3 photo D3

    Data-Driven Documents codes.