 |
 |
 |
 |
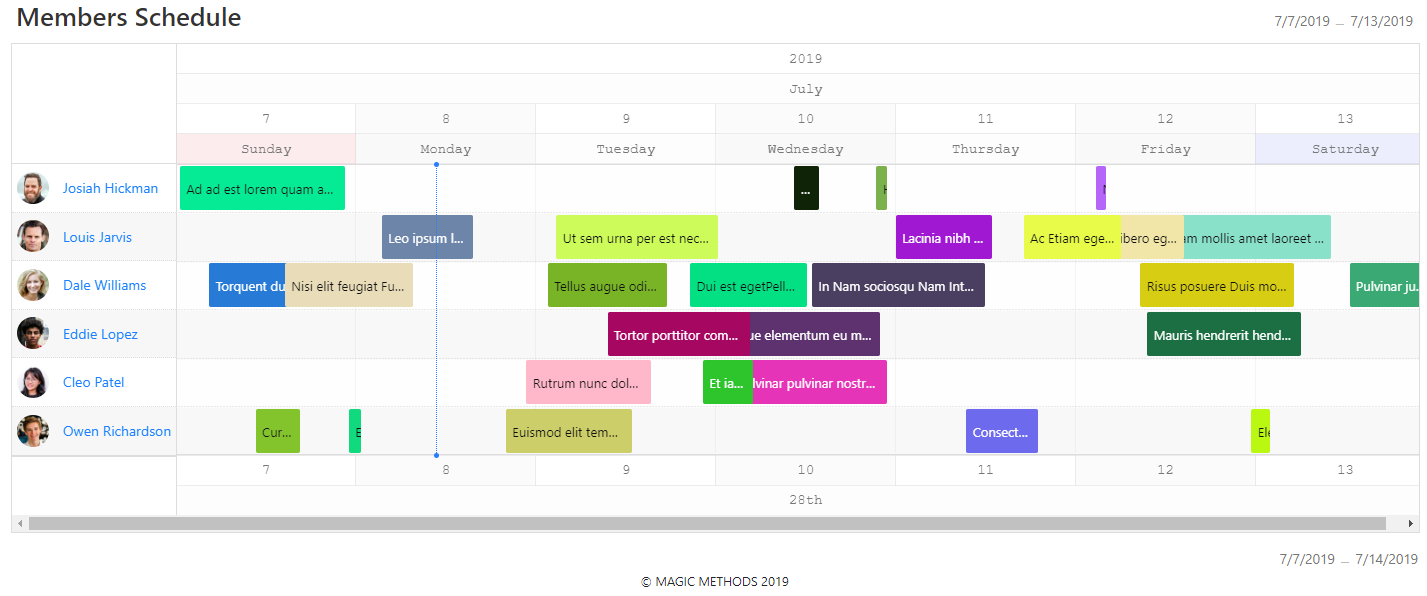
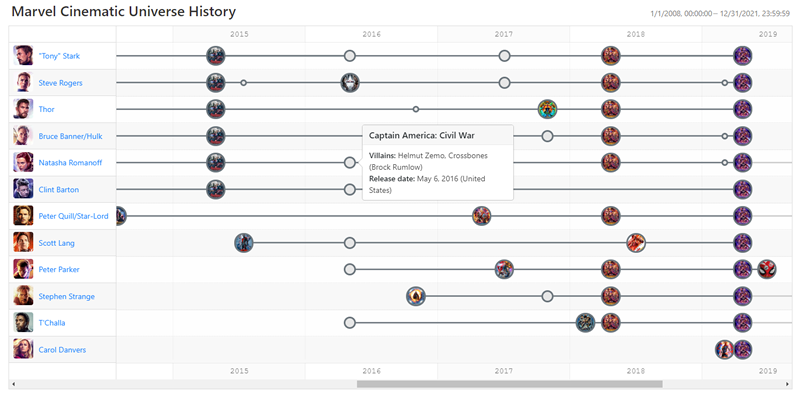
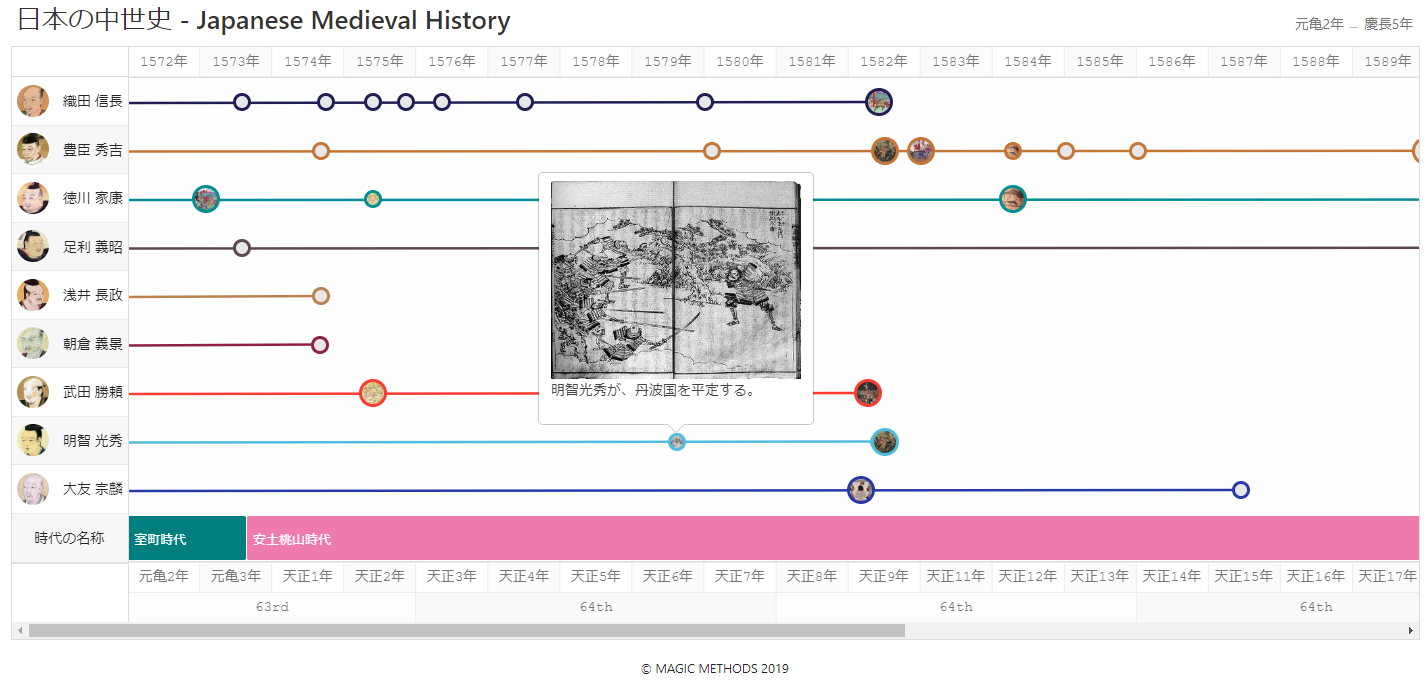
You are able to easily create two types of horizontal timeline with this jQuery plugin.
Report bug
·
Request feature
·
Blog


- Quick start
- What's included
- Usage
- Supported browsers
- Tutorials
- Documentation
- Example as demonstration
- Contributions
- Creators
- Copyright and license
Several quick start options are available:
- npm:
npm i jq-timeline - bower:
bower install jq-timeline - Download the latest release.
- Clone the repository:
git clone https://github.com/ka215/jquery.timeline.git - Load via CDN:
<link href="https://cdn.jsdelivr.net/gh/ka215/jquery.timeline@main/dist/jquery.timeline.min.css" rel="stylesheet">
<script src="https://cdn.jsdelivr.net/gh/ka215/jquery.timeline@main/dist/jquery.timeline.min.js"></script>Within the download you'll find the following directories and files, logically grouping common assets and providing compiled and minified variations. You'll see something like this:
jquery.timeline/
└── dist/
    ├── jquery.timeline.min.css
    └── jquery.timeline.min.js
We provide compiled and minified CSS and JS (jquery.timeline.min.*).
When deployed by using task for develop, generated source maps (jquery.timeline.*.map) are available for use with certain browsers' developer tools.
Include the installed files into your html:
<link rel="stylesheet" src="/path/to/jquery.timeline.min.css">

<script src="/path/to/jquery.timeline.min.js"></script>
Note: You should include the jquery core script before including this plugin javascript file. Also we recommend that would like to add defer attribute into script tag.
Bind this plugin in the scope had imported the jQuery:
$('#myTimeline').Timeline()jQuery.Timeline version 2.x supports the following browsers:
| PC | Mobile | ||||||
|---|---|---|---|---|---|---|---|
| Ok | Ok | Ok | Non-compliant | Ok | Ok | Ok | Ok |
Unfortunately as for the Internet Explorer etc., several methods of this plugin does not work because JavaScript implementation of browser is too immature. Please note that we are not go to support for these legacy browsers in the future.
The tutorial as a detailed usage of jQuery.Timeline is released here.
jQuery.Timeline's documentation, included in this repository in the root directory, is built with ESDoc and publicly hosted on GitHub Pages at https://ka215.github.io/jquery.timeline/. The docs may also be run locally.
- For v2.x: https://ka2.org/jquery-timeline/
- For v2.x(ESDoc): https://ka215.github.io/jquery.timeline/
- For v1.0.x: https://raw.githubusercontent.com/ka215/jquery.timeline/v1/README.md
- For v1.0.x (Japanese): https://ka2.org/jquery-timeline-v1/
- CRUD System for jQuery.Timeline
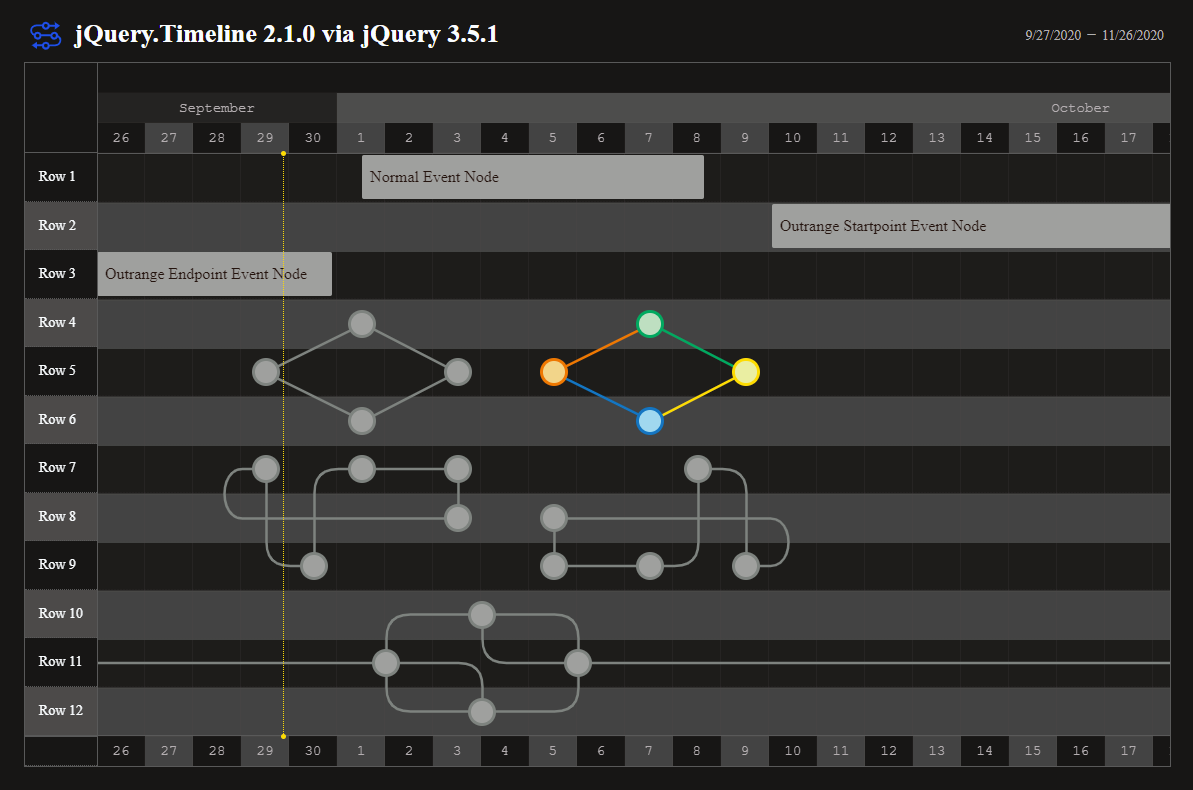
- jQuery.Timeline 2.1.0 via jQuery 3.5.1
- jQuery.Timeline Tester
- Version 2.x Point Type Timeline DEMO
- Version 1.x demo
Your donations for plugin development will help us.
Donate URL: https://ka215.github.io/jquery.timeline/donation.html
ka2 (Katsuhiko Maeno)
- Guillaume Bonnaire www.gbonnaire.fr
Code and documentation copyright 2011-2020 the ka2. Code released under the MIT License.


