Giter Site home page Giter Site logo

maluen / backbone-debugger Goto Github PK

View Code? Open in Web Editor NEW
704.0 27.0 44.0 2.19 MB

Chrome Developer Tools extension for debugging Backbone.js applications

License: Mozilla Public License 2.0

CSS 2.09% HTML 0.80% JavaScript 97.10%
backbonejs debugger chrome-extension devtools

backbone-debugger's Introduction

Backbone Debugger

Chrome Developer Tools extension for debugging Backbone.js applications.

Features

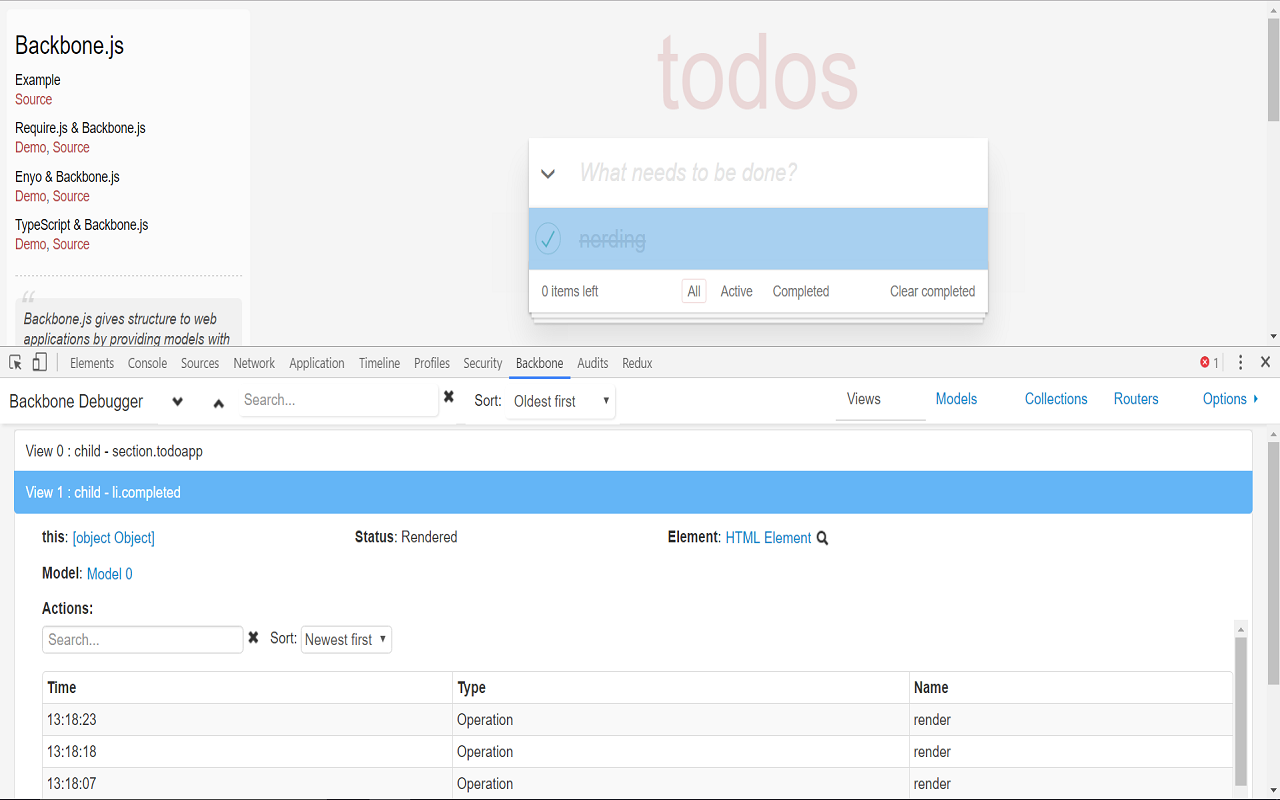
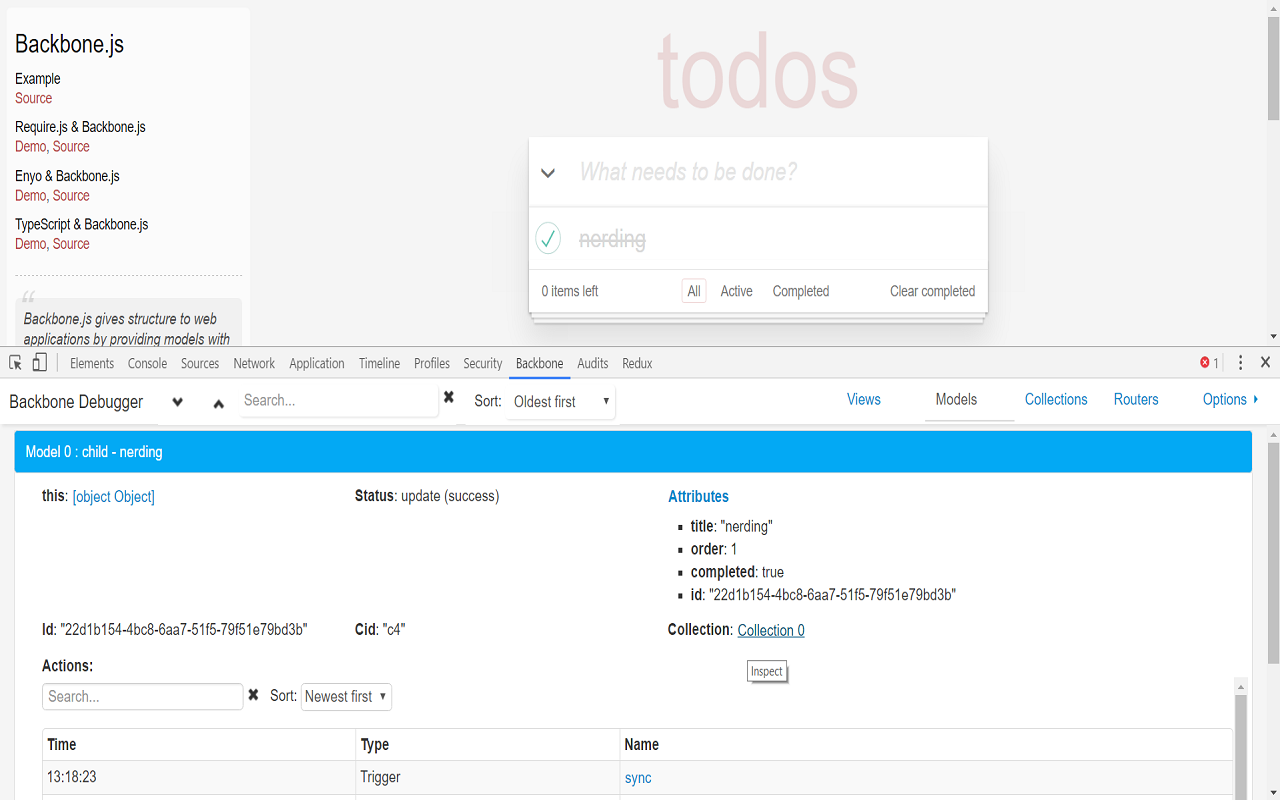
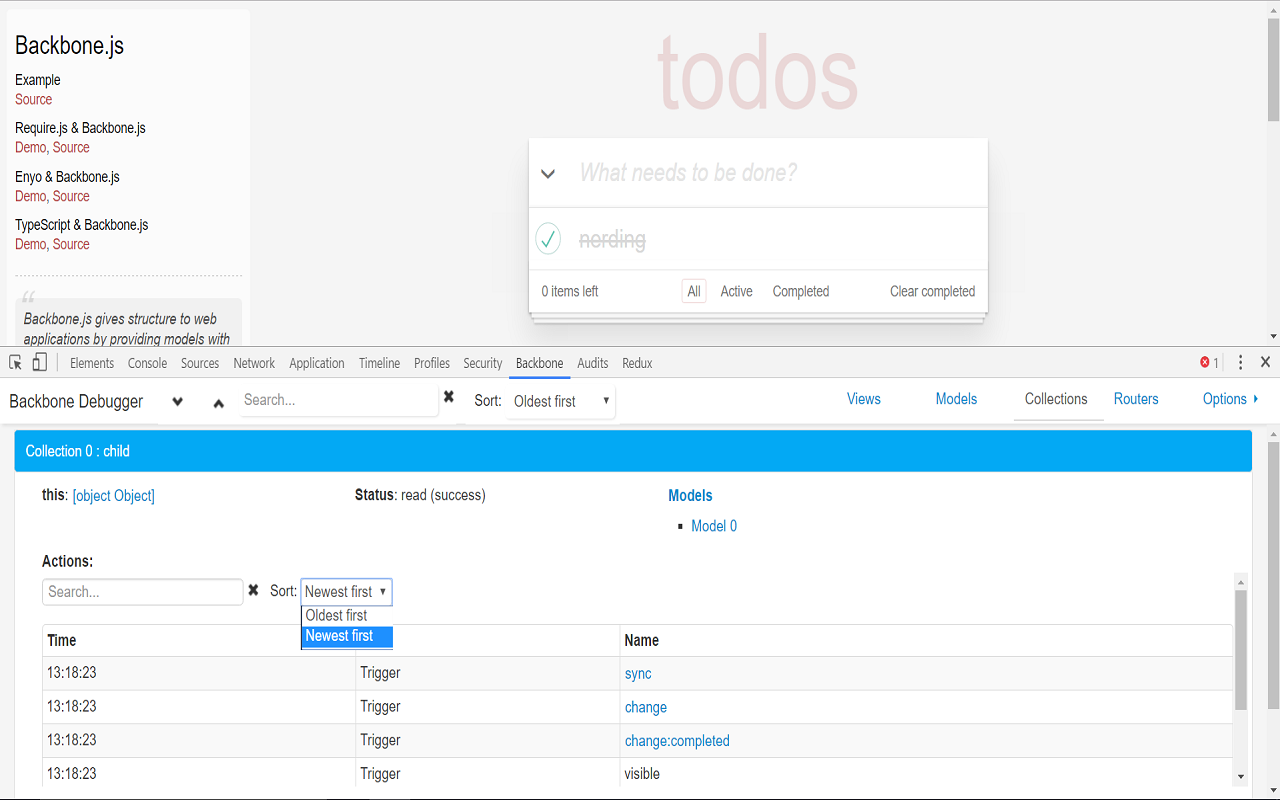
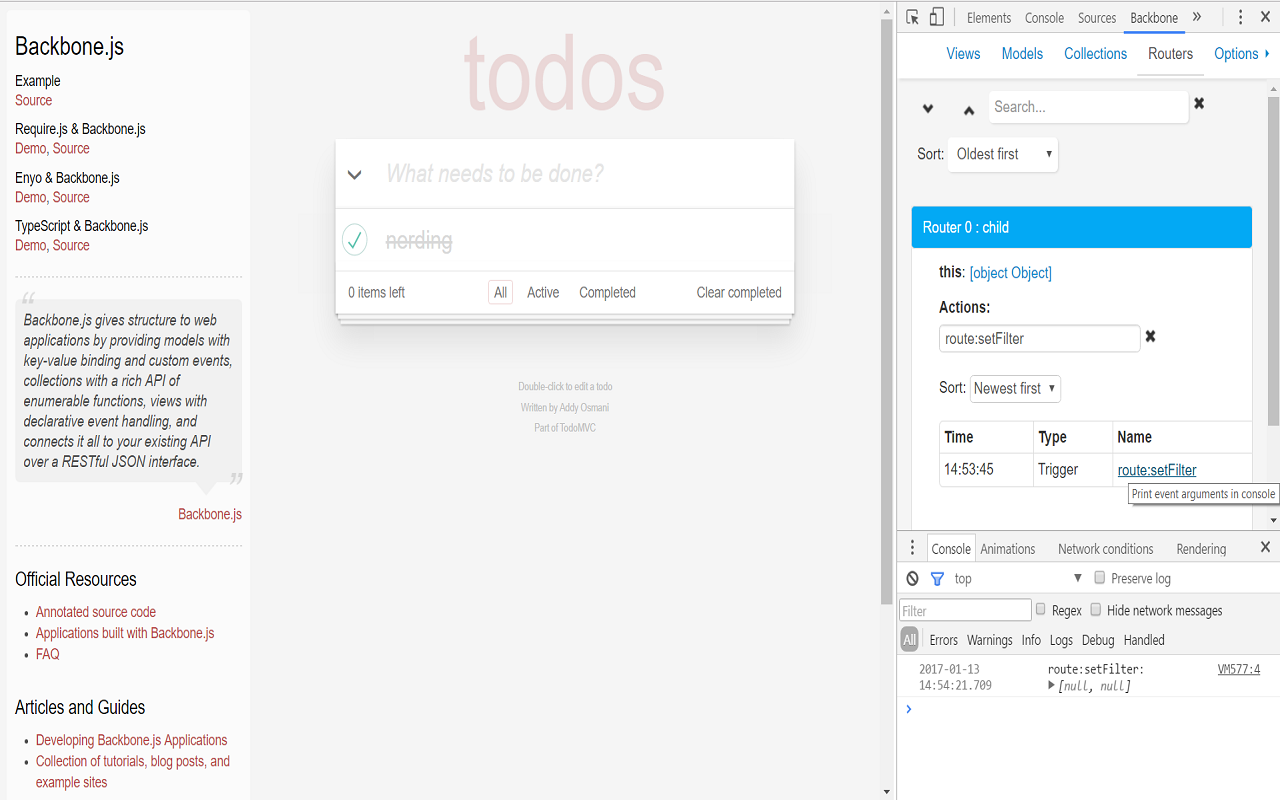
  • Adds a panel under the Chrome Developer Tools that displays in real-time all your application views, models, collections and routers. Data displayed includes:
    • Views: rendering status, html element, associated model and/or collection, handled page events, events triggered
    • Models: last sync status, attributes, id, cid, url, associated collection, events triggered, sync actions
    • Collections: last sync status, models, url, events triggered, sync actions
    • Routers: events triggered (include routes)
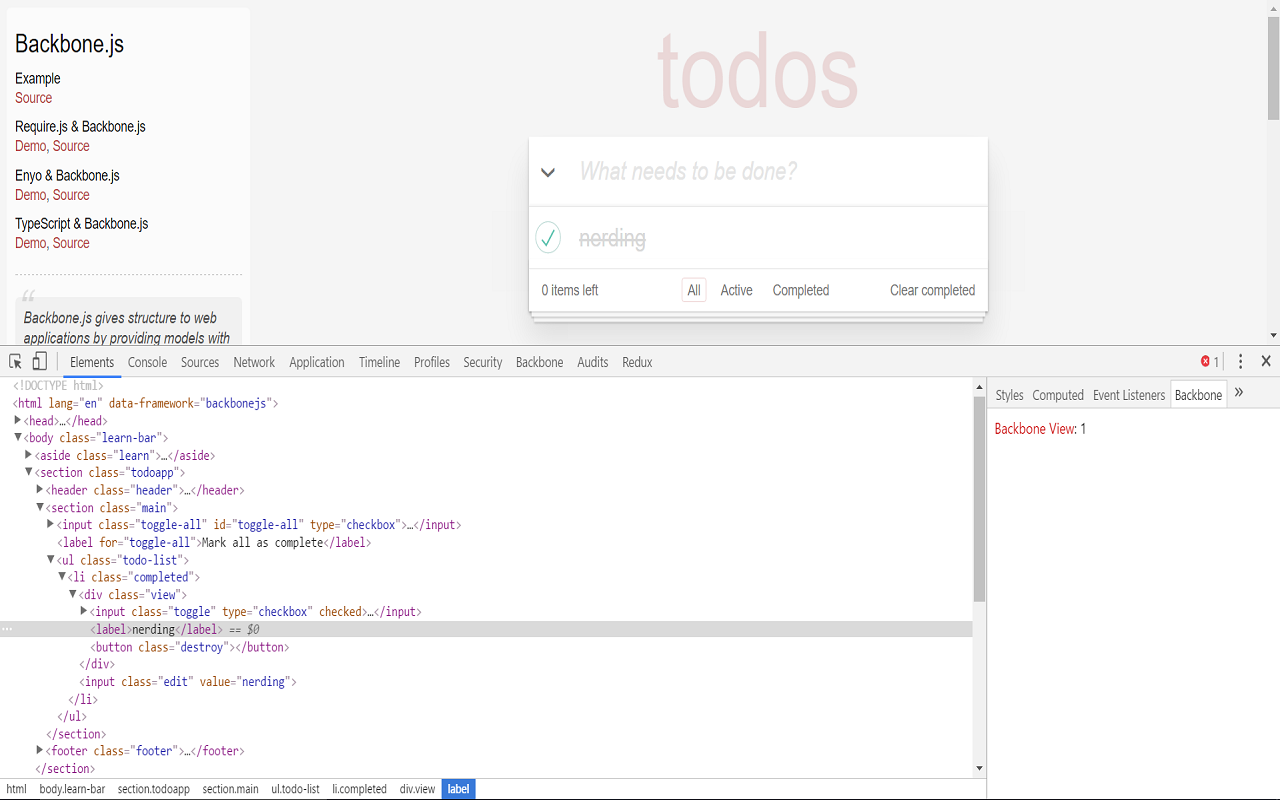
  • Extends the sidebar of the developer tools "Elements" panel to display the Backbone View of the inspected html element.

Install from source

Using Google Chrome:

  • Download the project archive and extract it somewhere.
  • Click on Tools -> Settings -> Extensions.
  • Select "Enable developer mode" in the upper right of the window.
  • Click on "Load unpacked extension".
  • Select the extracted folder.
  • Restart the browser.
  • Enjoy!

Install from Chrome Web Store

Follow this method if you want the latest stable release, it will also update automatically.

  • Go to the extension page and follow the instructions. Leave a review if you can!
  • Restart the browser.

Backbone detection

If you get the message "Waiting for Backbone" indefinitely, then Backbone can't be found, currently the only supported automatic detection is via window.Backbone or via AMD with window.define.

To send the Backbone object to the debugger manually, use the following code just after requiring it in the main file, before creating any application component, like views or models:

var Backbone = require('backbone'); // example: backbone is imported
// Add this!
if (window.__backboneAgent) {
  window.__backboneAgent.handleBackbone(Backbone);
}

In case this isn't enough, please open an issue.

Known Limitations

Support for apps that modify the standard Backbone behavior, e.g. apps that patch core methods like extend or delegateEvents, or that replace part of Backbone functions with custom code, is uncertain. However, constant efforts are taken in this direction to address the most possible use cases, so even if your application falls into this category you may still give it a try, open an issue or wait for newer versions.

Contribute

Want to contribute? You can report bugs, suggest features, write code and write documentation!

Looking for other ways? You can also support this project via Flattr or Gittip

Screenshots

Views:

Views

Models:

Models

Collections:

Collections

Routers:

Routers

Elements sidebar extension:

Elements sidebar extension

backbone-debugger's People

Contributors

amuino avatar fosterdill avatar htulipe avatar jakejarrett avatar jbreeden avatar maluen avatar michaelcarter avatar segheysens avatar

Stargazers

 avatar  avatar  avatar  avatar  avatar  avatar  avatar  avatar  avatar  avatar  avatar  avatar  avatar  avatar  avatar  avatar  avatar  avatar  avatar  avatar  avatar  avatar  avatar  avatar  avatar  avatar  avatar  avatar  avatar  avatar  avatar  avatar  avatar  avatar  avatar  avatar  avatar  avatar  avatar  avatar  avatar  avatar  avatar  avatar  avatar  avatar  avatar  avatar  avatar  avatar  avatar  avatar  avatar  avatar  avatar  avatar  avatar  avatar  avatar  avatar  avatar  avatar  avatar  avatar  avatar  avatar  avatar  avatar  avatar  avatar  avatar  avatar  avatar  avatar  avatar  avatar  avatar  avatar  avatar  avatar  avatar  avatar  avatar  avatar  avatar  avatar  avatar  avatar  avatar  avatar  avatar  avatar  avatar  avatar  avatar  avatar  avatar  avatar  avatar  avatar

Watchers

 avatar  avatar  avatar  avatar  avatar  avatar  avatar  avatar  avatar  avatar  avatar  avatar  avatar  avatar  avatar  avatar  avatar  avatar  avatar  avatar  avatar  avatar  avatar  avatar  avatar  avatar  avatar

backbone-debugger's Issues

Hanging at "Waiting for Backbone..."

I tried to use the Backbone Debugger on prose.io but reloading the app in debug mode leads to a "Waiting for Backbone..." message hanging there indefinitely.

What are the conditions that the debugger waits for? I'm not familiar with Backbone but I'd like to give a shot at making Prose behave well with the debugger.

Array values in models mutate the model attributes when the being debugged

Here is a file that demonstrates the issue. It appears that the debugger replaces slice() in a way that mutates attributes. If you stop debugging, the problem goes away:

<html>
<head>
  <title>Broken array values</title>
  <script src="https://cdnjs.cloudflare.com/ajax/libs/jquery/2.1.3/jquery.js" type="application/javascript"></script>
  <script src="https://cdnjs.cloudflare.com/ajax/libs/underscore.js/1.8.2/underscore.js"
          type="application/javascript"></script>
  <script src="https://cdnjs.cloudflare.com/ajax/libs/backbone.js/1.1.2/backbone.js"
          type="application/javascript"></script>
  <script type="application/javascript">
    (function() {
      var MyModel = Backbone.Model.extend();
      var myModel = new MyModel({foo: []});

      var foo1 = getFoo('foo1');
      foo1.push('bar');
      myModel.set('foo', foo1);

      var foo2 = getFoo('foo2');
      foo2.push('baz');
      myModel.set('foo', foo2);

      var foo3 = getFoo('foo3');
      foo3.splice(0, 1);
      myModel.set('foo', foo3);

      console.log('Fails:', Object.keys(myModel.toJSON()));
      // Prints: Fails: ["foo", "", "bar", "bar,baz"]

      function getFoo(name) {
        var foo = myModel.get('foo');
        checkArray(name, foo);
        foo = foo.slice(0);
        checkArray(name + ' after slice', foo);
        return foo;
      }

      function checkArray(name, val) {
        if (!Array.isArray(val)) {
          console.log(name + ' is not an array', val);
          return;
        }
        if (Array.prototype.slice !== val.slice) {
          console.log(name + ' has a different slice method', val);
        }
      }
    })();
  </script>
  <script type="application/javascript">
    (function() {
      var MyModel = Backbone.Model.extend();
      var myModel = new MyModel({foo: []});

      var foo1 = getFoo('foo1');
      foo1.push('bar');
      myModel.set('foo', foo1);

      var foo2 = getFoo('foo2');
      foo2.push('baz');
      myModel.set('foo', foo2);

      var foo3 = getFoo('foo3');
      foo3.splice(0, 1);
      myModel.set('foo', foo3);

      console.log('Works:', Object.keys(myModel.toJSON()));
      // Prints: Works: ["foo"]

      function getFoo(name) {
        var foo = myModel.get('foo');
        checkArray(name, foo);
        foo = Array.prototype.slice.call(foo);
        checkArray(name + ' after slice', foo);
        return foo;
      }

      function checkArray(name, val) {
        if (!Array.isArray(val)) {
          console.log(name + ' is not an array', val);
          return;
        }
        if (Array.prototype.slice !== val.slice) {
          console.log(name + ' has a different slice method', val);
        }
      }
    })();
  </script>
</head>
<body>
</body>
</html>

Debugger "Waiting for Backbone..." indefinitely

Hi all,

The debugger doesn't seem to start properly on a backbone site I work on. I've found an error occurring in the console when inspecting the debugger itself, but before I spend hours trying to figure out what's wrong I figured I'd post it here unless someone else has solved a similar issue before.

The site I'm trying to debug a search site for airport hotels and parking, an example product search is: https://v2.holidayextras.co.uk/?agent=WEB1&ppcmsg=#carpark?arrive=&customer_ref=&depart=LGW&flight=TBC&in=2015-03-08&out=2015-03-01&park_from=07%3A00&park_to=07%3A00&term=&terminal=

It's very backbone heavy, but doesn't seem to big that it should cause the debugger to break - I've had it working before intermittently.

The error I'm getting when loading the debugger is:
screen shot 2015-01-05 at 09 04 27

This issue manifests itself as the debugger "Waiting for Backbone..." indefinitely. If there's a simple fix I might be able to get a pull request worked up this week during work hours, otherwise it'll have to be something I do in my own time.

Uncaught TypeError: Cannot read property 'length' of undefined when adding a model to a collection after initialization

i have the following issue :
i populate a collection with models, then add another model via collection.add()

backbone debugger throw :
Uncaught TypeError: Cannot read property 'length' of undefined

it only happens when precising index with {at: 0}

another index integer works fine.

Also this issue was introduced in commit : 27736bb

versions before dont have this issue.

here is the reduced test case

    var myCollection = new Backbone.Collection;

    myCollection.reset([{ name: 'first model'}])

    setTimeout(function () {
      myCollection.add({ name: 'test model'}, { at: 0 });
    }, 500);

tabId undefined in background.js:29

I'm doing research on how to automatically detect possible race conditions in chrome extensions and spent some time reviewing your background.js. By coincidence I got stuck on line 29 of background.js. I believe tabId is undefined at this position which might cause trouble? Or possibly I'm just missing something.

Deleting collections

Hi Manuel,

I am using your plugin since a week. And I'm impressed, that it show me in real time what happen with my objects!

I have one question. When plugin mark that Backbone.Collection is removed?
I was trying deleted it many approaches, but in negative way.

My place to testing Backbone-Debugger: http://test-backbone-debugger.jsninja.pl/
If you try to use, that you should see that views and models are removed.
Only Backbone.Collection not.

Appropriate naming

In the Screenshots section, under 'Views', were do the names (View 0, View 1, etc.) come from? Is there a way to appropriately identify which specific views each are?

Brainstorm New UI

Any idea on an ultimate UI? We need something that is scalable, where we can add new features effortlessy, the current one is quite limited in such respect.

I still have nothing clear, but I was thinking maybe on an eclipse-like tab-based approach.

For exampe we have a main page, a sort of "command and control", where you have all the general information about the application, and from where you can open new tabs for displaying specific features.

E.g. we could have tabs for listing the components, a tab for showing the view tree, a tab for showing actions, and so on.

This could also be mixed, by having main sections as vertical tabs and for each section, having the ability of opening "horizontal" tabs with features limited to the current section.

Horizontal tabs could be arranged, closed, etc.

Just an idea to elaborate more, could also end up being weird

On Collection sync, Models are added, not updated

Whenever I fetch, update, or otherwise refresh my collections, the Models tab only adds the new instances without removing the old ones.

In this image I am debugging my personal site. I only have 3 projects in my database, and the site is only displaying 3 projects, yet the debugger shows 9.

image

Document how to use component names functionality

Hi,

I'm having trouble figuring how to use the new component names functionality--in particular I can't figure out how to set the name property of the constructor. Would you be able to provide an example? My best guess is something like this but it doesn't seem to work:

TestView = Backbone.View.extend({
  initialize: function () {
  }, {
    name: "TestView"
  }
})

Thanks for the great extension!

No __backboneAgent value present on window

Doesn't seem to work for me at all. No 'waiting for backbone' message anywhere. I tried to send backbone to debugger manually but window.__backboneAgent doesn't exist. I have it installed and see the icon in the upper right of the page, but it's grey.

Restart in Debug Mode causes exception

After installing this extension and opening the Web Inspector to the Backbone panel I see a link labelled Restart app in debug mode. Clicking the link reloads the current page, which crashes trying to run main.js, on the second line in the following code fragment, reporting an error that domReady is an object:

require(["domReady"], function(domReady) {
  domReady(function () {
  ...

Loader.js file has a console warning

Synchronous XMLHttpRequest on the main thread is deprecated because of its detrimental effects to the end user's experience. For more help, check http://xhr.spec.whatwg.org/.

Line 11 (last line here) in loader.js
//@ sourceURL=chrome-extension://bhljhndlimiafopmmhjlgfpnnchjjbhd/js/backboneAgent/loader.js
// retrieve the extension url from the data passed in the inject process
var extensionUrl = injectionData["extensionUrl"];

// Configuration
var basePath = extensionUrl+"js/backboneAgent/";

var load = function(modulePath) {
    var xmlhttp = new XMLHttpRequest();
    var sourceUrl = basePath+modulePath+".js";
    xmlhttp.open("GET", sourceUrl, false); // synchronous

Uncaught EvalError

I'm getting this error after trying the extension:

Uncaught EvalError: Refused to evaluate a string as JavaScript because 'unsafe-eval' is not an allowed source of script in the following Content Security Policy directive: "script-src 'self' chrome-extension-resource:".

Infinite loop in watch.js:64

I appear to be running into a similar issue to #14 , however I'm unsure how I can get more info for debugging to find the cause and possible solution. It appears to be related to views where I have a collection and have a model that stores pagination information, but beyond that I'm not sure what action in my code is causing it Backbone-Debugger to enter an infinite loop in watch.js:64. It doesn't seem I can open watch.js in Chrome dev tools to dig in further. Any tips on debugging Backbone-Debugger?

Uncaught TypeError: Cannot read property 'perpage' of undefined watch.js:64

Panel user interface slows down when the app has many components

When the application has several hundreds or thousands of components, the panel user interface becomes very slow, especially on startup when it can also freeze for several seconds.
Check for example http://tzigla.com/boards/1 models.

Should be smoothed:

  • Startup, or more generally, the showing of many new components
  • Tab change, especially when the components on the target tab are all opened
  • Open all / Close all actions

Add View Tree

The Marionette Inspector's view tree, which shows nested views, is one of the most appreciated features of the inspector. It serves two purposes: 1) makes it easy to find a view on the page, 2) offers context for how the app is built.

While Backbone doesn't have a native idea of regions, which lend themselves to layouts and lists, we could infer the view tree pretty easily by looking at the attached views and comparing their elements. A basic algorithm would go like this: given two views a and b, is A contained by B or vice versa, does A precede B or vice versa... Anyways, while it's more work to reverse engineer the view tree only given dom elements, I think it's absolutely possible for the motivated person.

View Tree

[feature request] clear cache

We have a bigger backbone application where we would like to use this debugger sometimes. Sadly after switching views a few times the page gets so slow that we can't use it anymore.

I think with a "clear cache" feature we could speed it up again. Just drop all data we have from the debugger view could be enough. Mostly we are not interested in all the startup view/models/collections but more in the changes after we start to interact with the page.

What do you think?

Group and filter app components

The user should be able to group and filter app components of each category by using predefined or custom criteria.

Details:
In each component tab add a form under the "openAll/closeAll" buttons with:

  • Label "Group by: " followed by a select with the group criteria (e.g. "Sync status").
  • Label "Filter by: " followed by a select with the filter criteria (e.g. "Sync status") followed by an input text with the filter term (e.g. "read (success)")

Grouped components are displayed by using a list for each existent group, e.g. if the group criteria for models is "Sync status" and there are 5 models with status "read (success)" and 3 with status "update (failure)", there will be two list: "read (success)" and "update (failure"), each displaying the models with the respective sync status.

Filtered components (in each group) are visible if and only if they pass the current filter.

The user can combine grouping and filtering by setting both, for example by grouping collections by type and by adding a filter to show only successfully saved collections.
Obviously, setting the same group and filter criteria will make visible only the components that belong to the filter term group.

Add View Info Panel

The Marionette Inspector provides tons of metadata about view properties in the info panel.

Some properties that the inspector has which could easily be added to the debugger are:

  • events (dom events)
  • listeners (bb _events)
  • ui (subset of view properties that are dom properties)
  • class properties (view properties organized by prototype chain class properties, parent class, ..., BB.View properteis)

Info Panel

Inspector serialize function

serializeView.js

this.serializeView = function(view) {
  var data = {};
  // debug.log('serializeView', view)

  if (!_.isObject(view)) {
    return {};
  }


  data.cid = view.cid;
  data.isLoading = false; // set when a view is registered, but not serialized

  data.options = this.serializeObject(view.options);
  data.el = this.serializeElement(view.el, 'el', false);
  data.events = serializeEventsHash(view.events);
  data._events = this.serializeEvents(view._events);
  data.properties = this.serializeObjectProperties(view);
  data.ancestorInfo = this.ancestorInfo(view);
  data._requirePath = view._requirePath;
  data._className = this.serializeClassName(view);
  data.parentClass = this.isKnownType(view) ? this.knownType(view).name : '';
  data.inspect = this.inspectValue(view);

  if (view.model) {
    data.model = {
      cid: view.model.cid
    };
  }

  return data;
}

Backbone objects not showing up

I have a function in my View object that creates a new Model and adds it to a Collection. The function should be called by an event of the View object, but when it is called by the event the Model does not show in the debugger, the Model isn't showing up in the Collection tab and the event isn't registered in the Collection tab. However, if I call the function from the View's Intialize function the Model appears fine in the debugger :-/ Looking in the console I can see that the Model is being created and added to the Collection fine.

I'm using backbone 2.1.1 and Chrome 36.

Shorter title shown in the devtools

What I'm talking about is the string used currently for the extension's tab in the devtools.

[Elements] [Resources] ... [Backbone Debugger]

You should really consider shortening that string because it takes precious space (especially when using the devtools in vertical mode)

this also means there are more chances for it to be hidden

Some suggestions: BB Debug, BB Debugger, Backbone dbg

Using RequireJS, get this error

Hi there:

Looking forward to using this Chrome plugin, but I am getting a simple error. Everything is fine when I load my application as normal.

But if I click "restart the application in dev mode" like so

screenshot 2015-07-13 14 39 56

then get this error

screenshot 2015-07-13 14 37 53

the error says I am missing a source-map, so maybe I should create this file :) is there any information on this? thanks

Fail to switch view with debugger on

I'm trying the debugger on http://codecombat.com, because that's what I intend on using it on. I noticed, when browsing around the website, that some views won't switch when the debugger is on.

Take for example http://codecombat.com/editor/article/ with the debugger on. Click the Article Editor and click any of the articles you see. The url is changed and the view is detected but is not switched to, as opposed to when the debugger is off. The same goes for when you go to a specific article and then reload the page with the debugger on. The article's contents won't load, the loading bar will stay on.

My guess is that it's some incompatibility with Backbone.js Mediator. I know CodeCombat uses it to pass around events and these events are sometimes used as triggers to change to a specific view. For the latter example the following code registers the callback that never gets called when the debugger is on:

@article.once('sync', @onArticleSync)

sync never reaches the code. Any ideas on where this event is intercepted or obstructed?

Backbone Layoutmanager

When I use Backbone Layoutmanager to manage my views, I come to issue where the remove method does not work as expected.

In fact when I remove a layout, the subviews are not deleted and become zombie views.

I'm talking based on what Backbone-Debugger shows:
this is what it shows:
zombies

and this is what it must show:
Deleted

In those screenshots view 3 is the layout and the others are subviews.

I think this issue is mentionned in the section "Known Limitations". I open an issue because I think Backbone Layoutmanager is one of the most importants extensions as it helps to manage views and prevent Backbone views to grow up to be Zombies.

0.2.5 Loading

I haven't been able to use this extension since the upgrade to 0.2.5. The application I'm using has a lot of models and views, and with the extension enabled it slows the application to a crawl. Is there a way I can diagnose this a bit more or get error logs from the extension so I can hopefully provide something more helpful for you?

Difficulty loading iframes with 0.3.0 release

Hello,

I was using Backbone.Debugger pretty successfully before the 0.3.0 release on an embedded widget that I'm developing using Backbone. With 0.3.0 the iframe loads, but no longer seems to respond to postMessage events. I am unable to give a demo page right now because this product is still in an internal beta, but I can tell you that the iframe should load the backbone application after a postMessage is sent to it from the host page.

The sequence of events is:

  1. Widget script is executed in the DOM
  2. An iframe is created and placed into a target container in the DOM
  3. Once the iframe is loaded the script then send some parameters to the iframe, which then loads the application

Once we've released our widget I can point you to a page to debug, but I'm hoping in the meantime this can get the ball rolling on a fix.

This is a great tool btw, and I hope to start using it again soon!

Thanks,
-Eric

[feature request] Statistics

Hi,
If possible some statistics on activity:

  • created views
  • closed views
  • created and closed views in the same activity
  • checkpoints (I am loading a page, I'm marking a checkpoint, I'm doing an action and get a new checkpoint)
    Thanks

Always in debug mode?

Is there possibility to have debug mode all the time? I'm using "Live reload" and it's awkward when "Live reload" reloads the page and you need to reload it again yourself to get the debug mode.

Add Unit Tests

It'd be great to get some test coverage over the debugger. From my experience, this makes it easier to add new functionality without introducing regressions. Also, a lot of the backboneAgent logic is difficult to manually reproduce and a test environment makes the feedback loop much tighter.

The Marionette Inspector has two test hanesses, one for the agent and the other for the inspector panel. We did this to separate out the two flows. I'm considering splitting up the inspector test suite into smaller functional bits, but thats another story. Here's the two test bootstrap files:

Harnesses

Agent harness

With the Agent, the big challenge is to reproduce injecting the script into the window for each test execution. We achieve this by building a small core script that does not include any of the startup logic and then for each run, we reset the main agent state, reload backbone, and re-patch backbone... This is pretty hard to get right and you'll see that a lot of duck tape is used.

The end result though is great, as we've got tests on lots of utilities and the serializing logic.

Inspector Harness

With the panel, the big challenge is to build a sandbox environment that the inspector feels comfortable living in. For the most part, that's just stubbing out the chrome apis and getting the require.js configuration to play nicely. You'll notice that this requires starting up a local server and managing the initial chrome page connection.

The recorder / sandbox environment FTW

So, once these two test environmnets are setup you can do a lot to automate some of the coverage, but that's really for computers and doesn't do too much for humans. Enter the recorder. The recorder records messages tha the panel receives from the agent. The sandbox starts the inspector on it's own page (outside of devtools) and plays back the messages from the agent. The result, is a magical world where the inspector can be started by itself. This is great for UI work, new feature development, and is wonderful for humans who want to get shit done. sandbox.

These three things are better outlined in the
getting started guide

Uncaught TypeError: Failed to execute 'postMessage' on 'Window'

Since updating to Chrome 55.0.2883.95, the extension fails to load, yielding the following error:

VM118:955 Uncaught TypeError: Failed to execute 'postMessage' on 'Window': The 3rd argument is neither an array, nor does it have indexed properties. at Child.connectToExtension (<anonymous>:955:11) at Child.<anonymous> (<anonymous>:937:14) at <anonymous>:502:29

This results in the extension never getting past the 'Waiting for Backbone" point. Anything to do with the latest fix on that piece of code?

`connectToExtension: function() {
window.postMessage({
target: 'page',
timestamp: new Date().getTime(),
name: 'connect'
}, [this.channel.port2], '*');

		this.isConnectedWithExtension = true;
	},`

This is when it breaks down that I realize how much I use and appreciate this extension :-)

Additional info: This seems only to happen to the version distributed through the Chrome Extension store. Installing from the archive seems to be working ok.

Recommend Projects

  • React photo React

    A declarative, efficient, and flexible JavaScript library for building user interfaces.

  • Vue.js photo Vue.js

    ๐Ÿ–– Vue.js is a progressive, incrementally-adoptable JavaScript framework for building UI on the web.

  • Typescript photo Typescript

    TypeScript is a superset of JavaScript that compiles to clean JavaScript output.

  • TensorFlow photo TensorFlow

    An Open Source Machine Learning Framework for Everyone

  • Django photo Django

    The Web framework for perfectionists with deadlines.

  • D3 photo D3

    Bring data to life with SVG, Canvas and HTML. ๐Ÿ“Š๐Ÿ“ˆ๐ŸŽ‰

Recommend Topics

  • javascript

    JavaScript (JS) is a lightweight interpreted programming language with first-class functions.

  • web

    Some thing interesting about web. New door for the world.

  • server

    A server is a program made to process requests and deliver data to clients.

  • Machine learning

    Machine learning is a way of modeling and interpreting data that allows a piece of software to respond intelligently.

  • Game

    Some thing interesting about game, make everyone happy.

Recommend Org

  • Facebook photo Facebook

    We are working to build community through open source technology. NB: members must have two-factor auth.

  • Microsoft photo Microsoft

    Open source projects and samples from Microsoft.

  • Google photo Google

    Google โค๏ธ Open Source for everyone.

  • D3 photo D3

    Data-Driven Documents codes.