Giter Site home page Giter Site logo

mcsorkun / chemplot Goto Github PK

View Code? Open in Web Editor NEW
102.0 4.0 27.0 71.15 MB

A python package for chemical space visualization.

Home Page: https://chemplot.readthedocs.io/en/latest/

License: BSD 3-Clause "New" or "Revised" License

Python 0.77% Jupyter Notebook 99.23%
chemical-space cheminformatics data-visualization dimensionality-reduction

chemplot's Introduction


ChemPlot

Chemplot is a python library for chemical space visualization that allows users to plot the chemical space of their molecular datasets. Chemplot contains both structural and tailored similarity algorithms to plot similar molecules together based on the needs of users. Moreover, it is easy to use even for non-experts.

Current Release Info

Version Downloads License Documentation Testing
Conda Version PyPI version Conda Downloads Downloads PyPI - License Documentation Status Tests Coverage Status

Resources

User Manual

You can find the detailed features and examples in the following link: User Manual.

Web Application

ChemPlot is also available as a web application. You can use it at the following link: Web Application.

Paper

You can find the details for the background on ChemPlot in our paper. You can download our paper at: Paper.

Installation

There are two different options to install ChemPlot:

Option 1: Use conda

To install ChemPlot using conda, run the following from the command line:

conda install -c conda-forge chemplot

Option 2: Use pip

ChemPlot requires RDKit, which cannot be installed using pip. The official RDKit installation documentation can be found here.

After having installed RDKit, ChemPlot can be installed using pip by running:

pip install chemplot

How to use ChemPlot

ChemPlot is a cheminformatics tool whose purpose is to visualize subsets of the chemical space in two dimensions. It uses the RDKit chemistry framework, the scikit-learn API and the umap-learn API.

Getting started

To demonstrate how to use the functions the library offers we use BBBP (blood-brain barrier penetration) [1] molecular dataset. BBBP is a set of molecules encoded as SMILES, which have been assigned a binary label according to their permeability properties. This dataset can be retrieved from the library as a pandas DataFrame object.

import chemplot as cp
data_BBBP = cp.load_data("BBBP")

To visualize the molecules in 2D according to their similarity it is first needed to construct a Plotter object. This is the class containing all the functions ChemPlot uses to produce the desired visualizations. A Plotter object can be constructed using classmethods, which differentiate between the type of input that is feed to the object. In our example we need to use the method from_smiles. We pass three parameters: the list of SMILES from the BBBP dataset, their target values (the binary labels) and the target type (in this case “C”, which stands for “Classification”).

plotter = cp.Plotter.from_smiles(data_BBBP["smiles"], target=data_BBBP["target"], target_type="C")

Plotting the results

When the Plotter object was constructed descriptors for each SMILES were calculated, using the library mordred, and then selected based on the target values. We reduce the number of dimensions for each molecule from the number of descriptors selected to only 2. ChemPlot uses three different algorithms in order to achieve this. In this example we will first use t-SNE [2].

plotter.tsne()

The output will be a dataframe containg the reduced dimensions and the target values.

t-SNE-1 t-SNE-2 target
-41.056122 0.355575 1
-35.535915 21.648867 1
23.771597 -14.438373 1

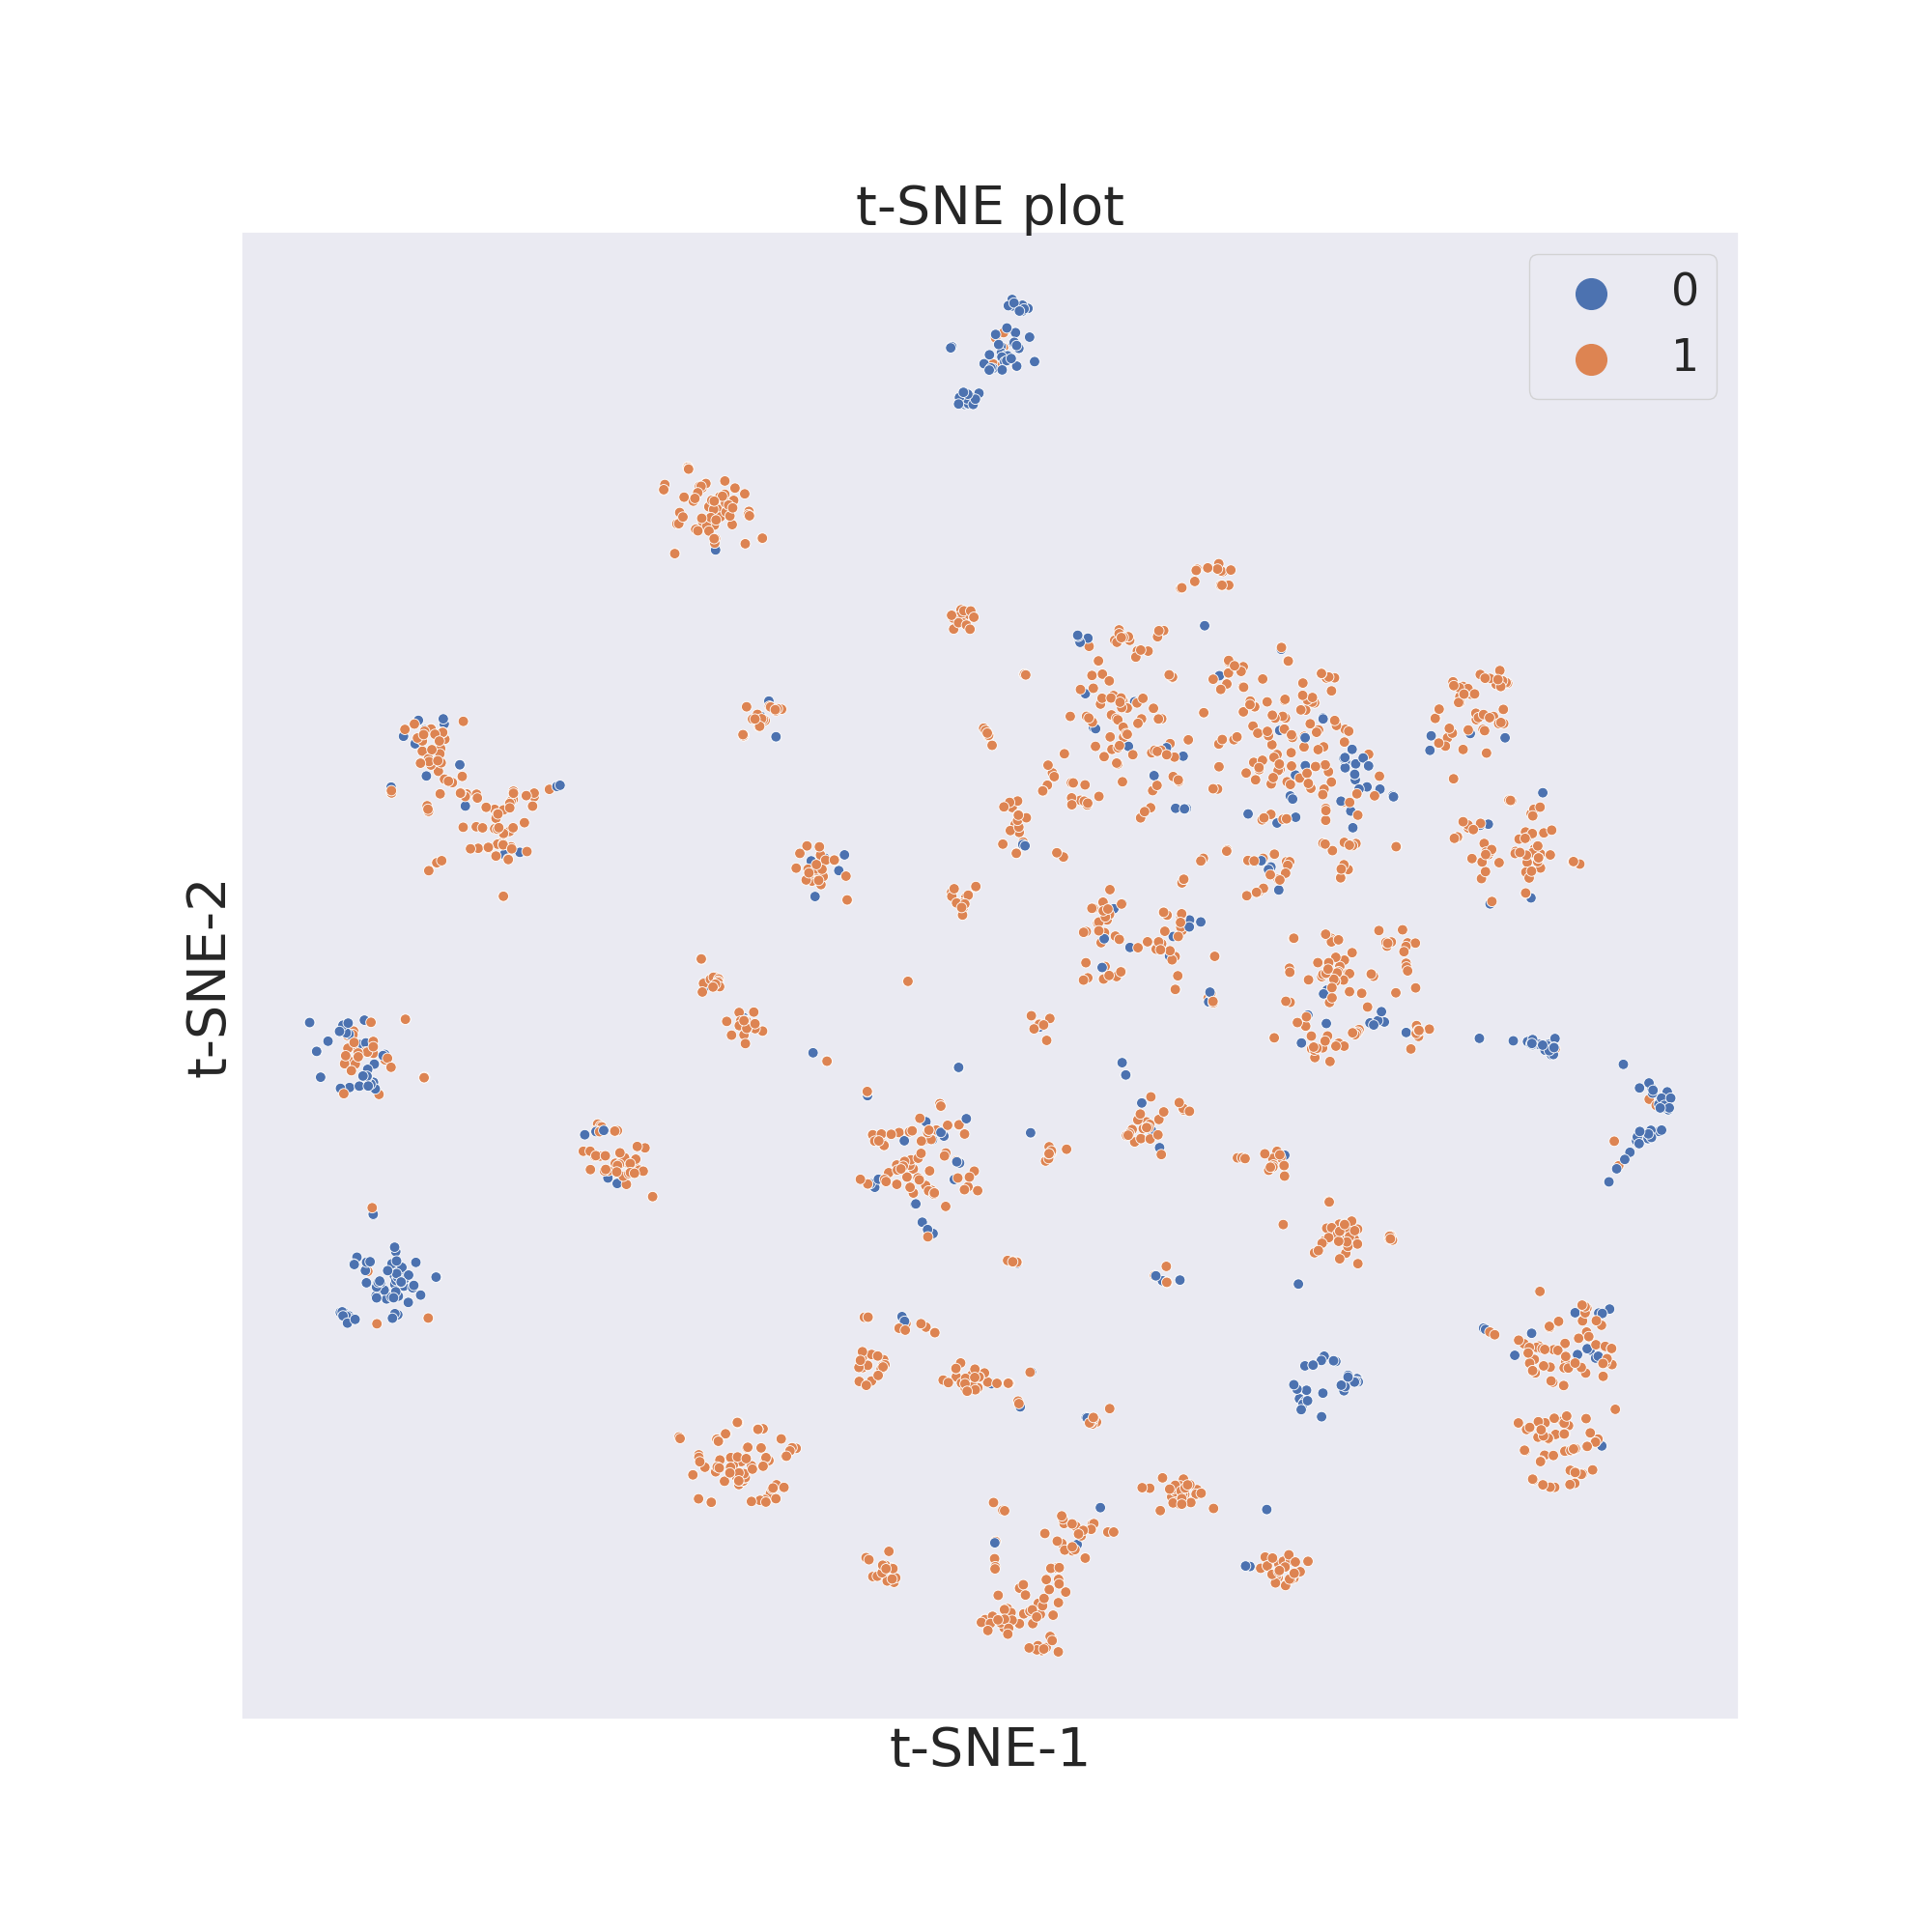
To now visualize the chemical space of the dataset we use visualize_plot().

plotter.visualize_plot()

image

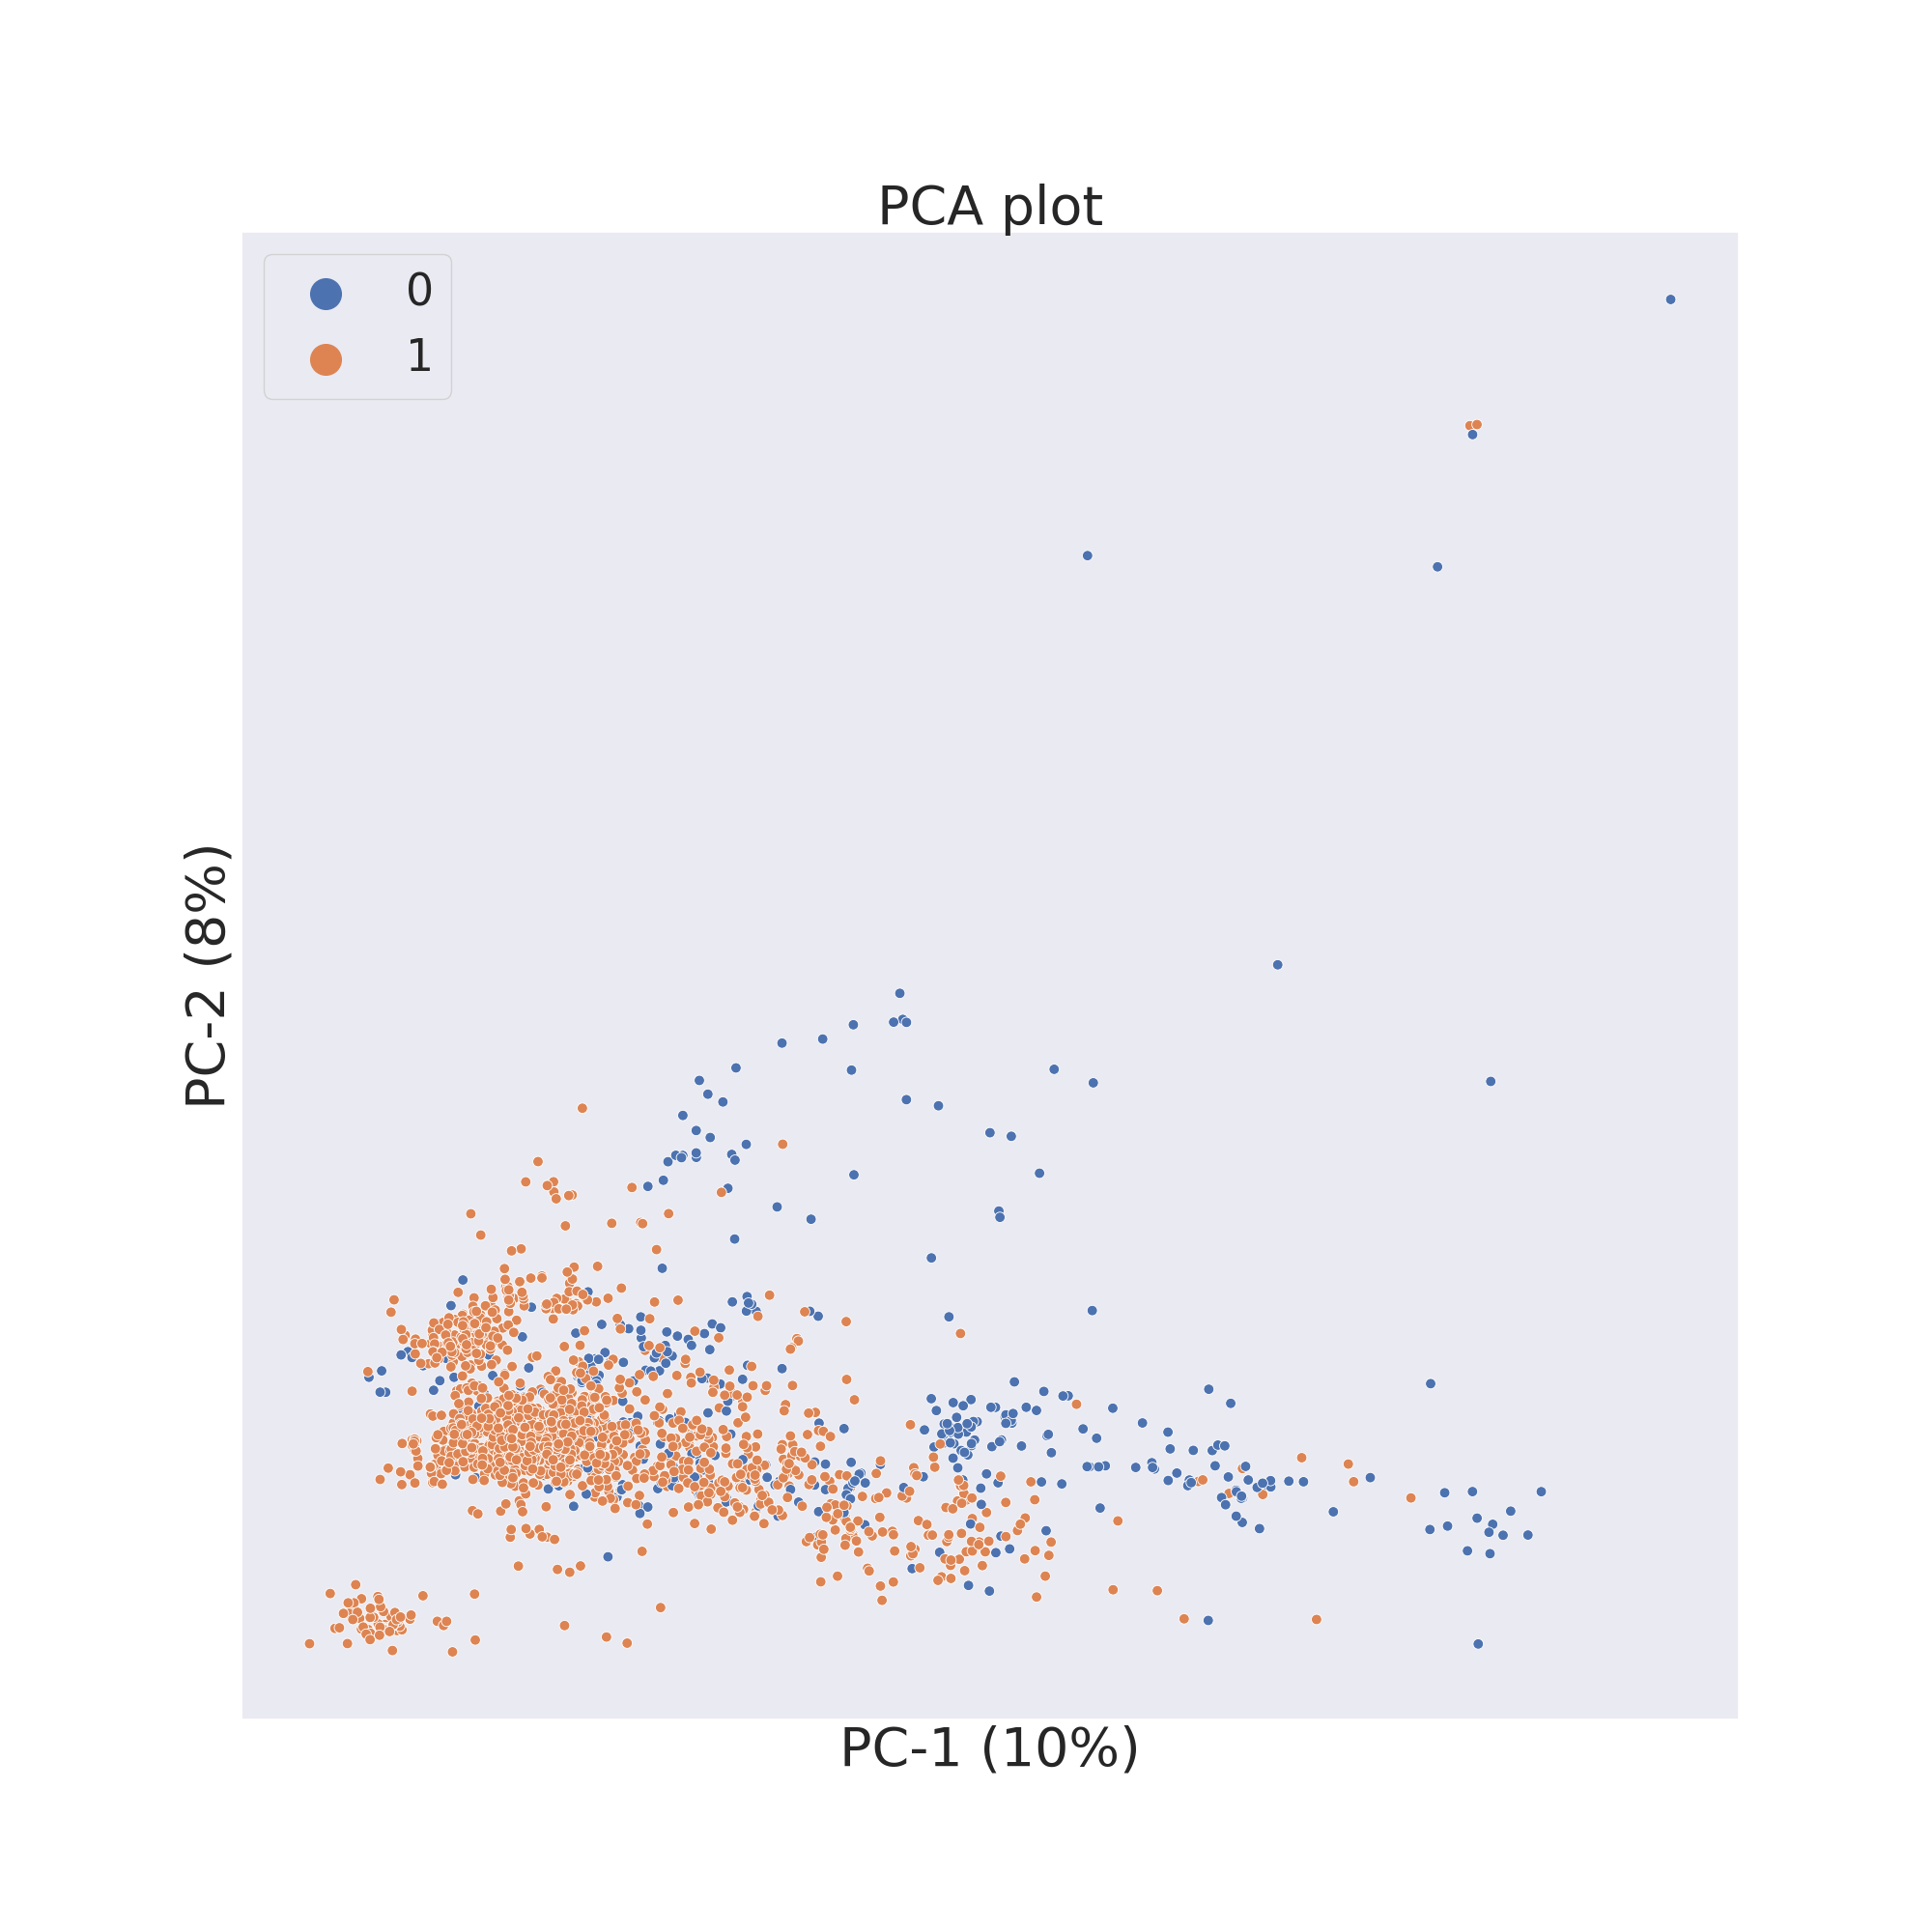
The second figure shows the results obtained by reducing the dimensions of features Principal Component Analysis (PCA) [3].

plotter.pca()
plotter.visualize_plot()

image

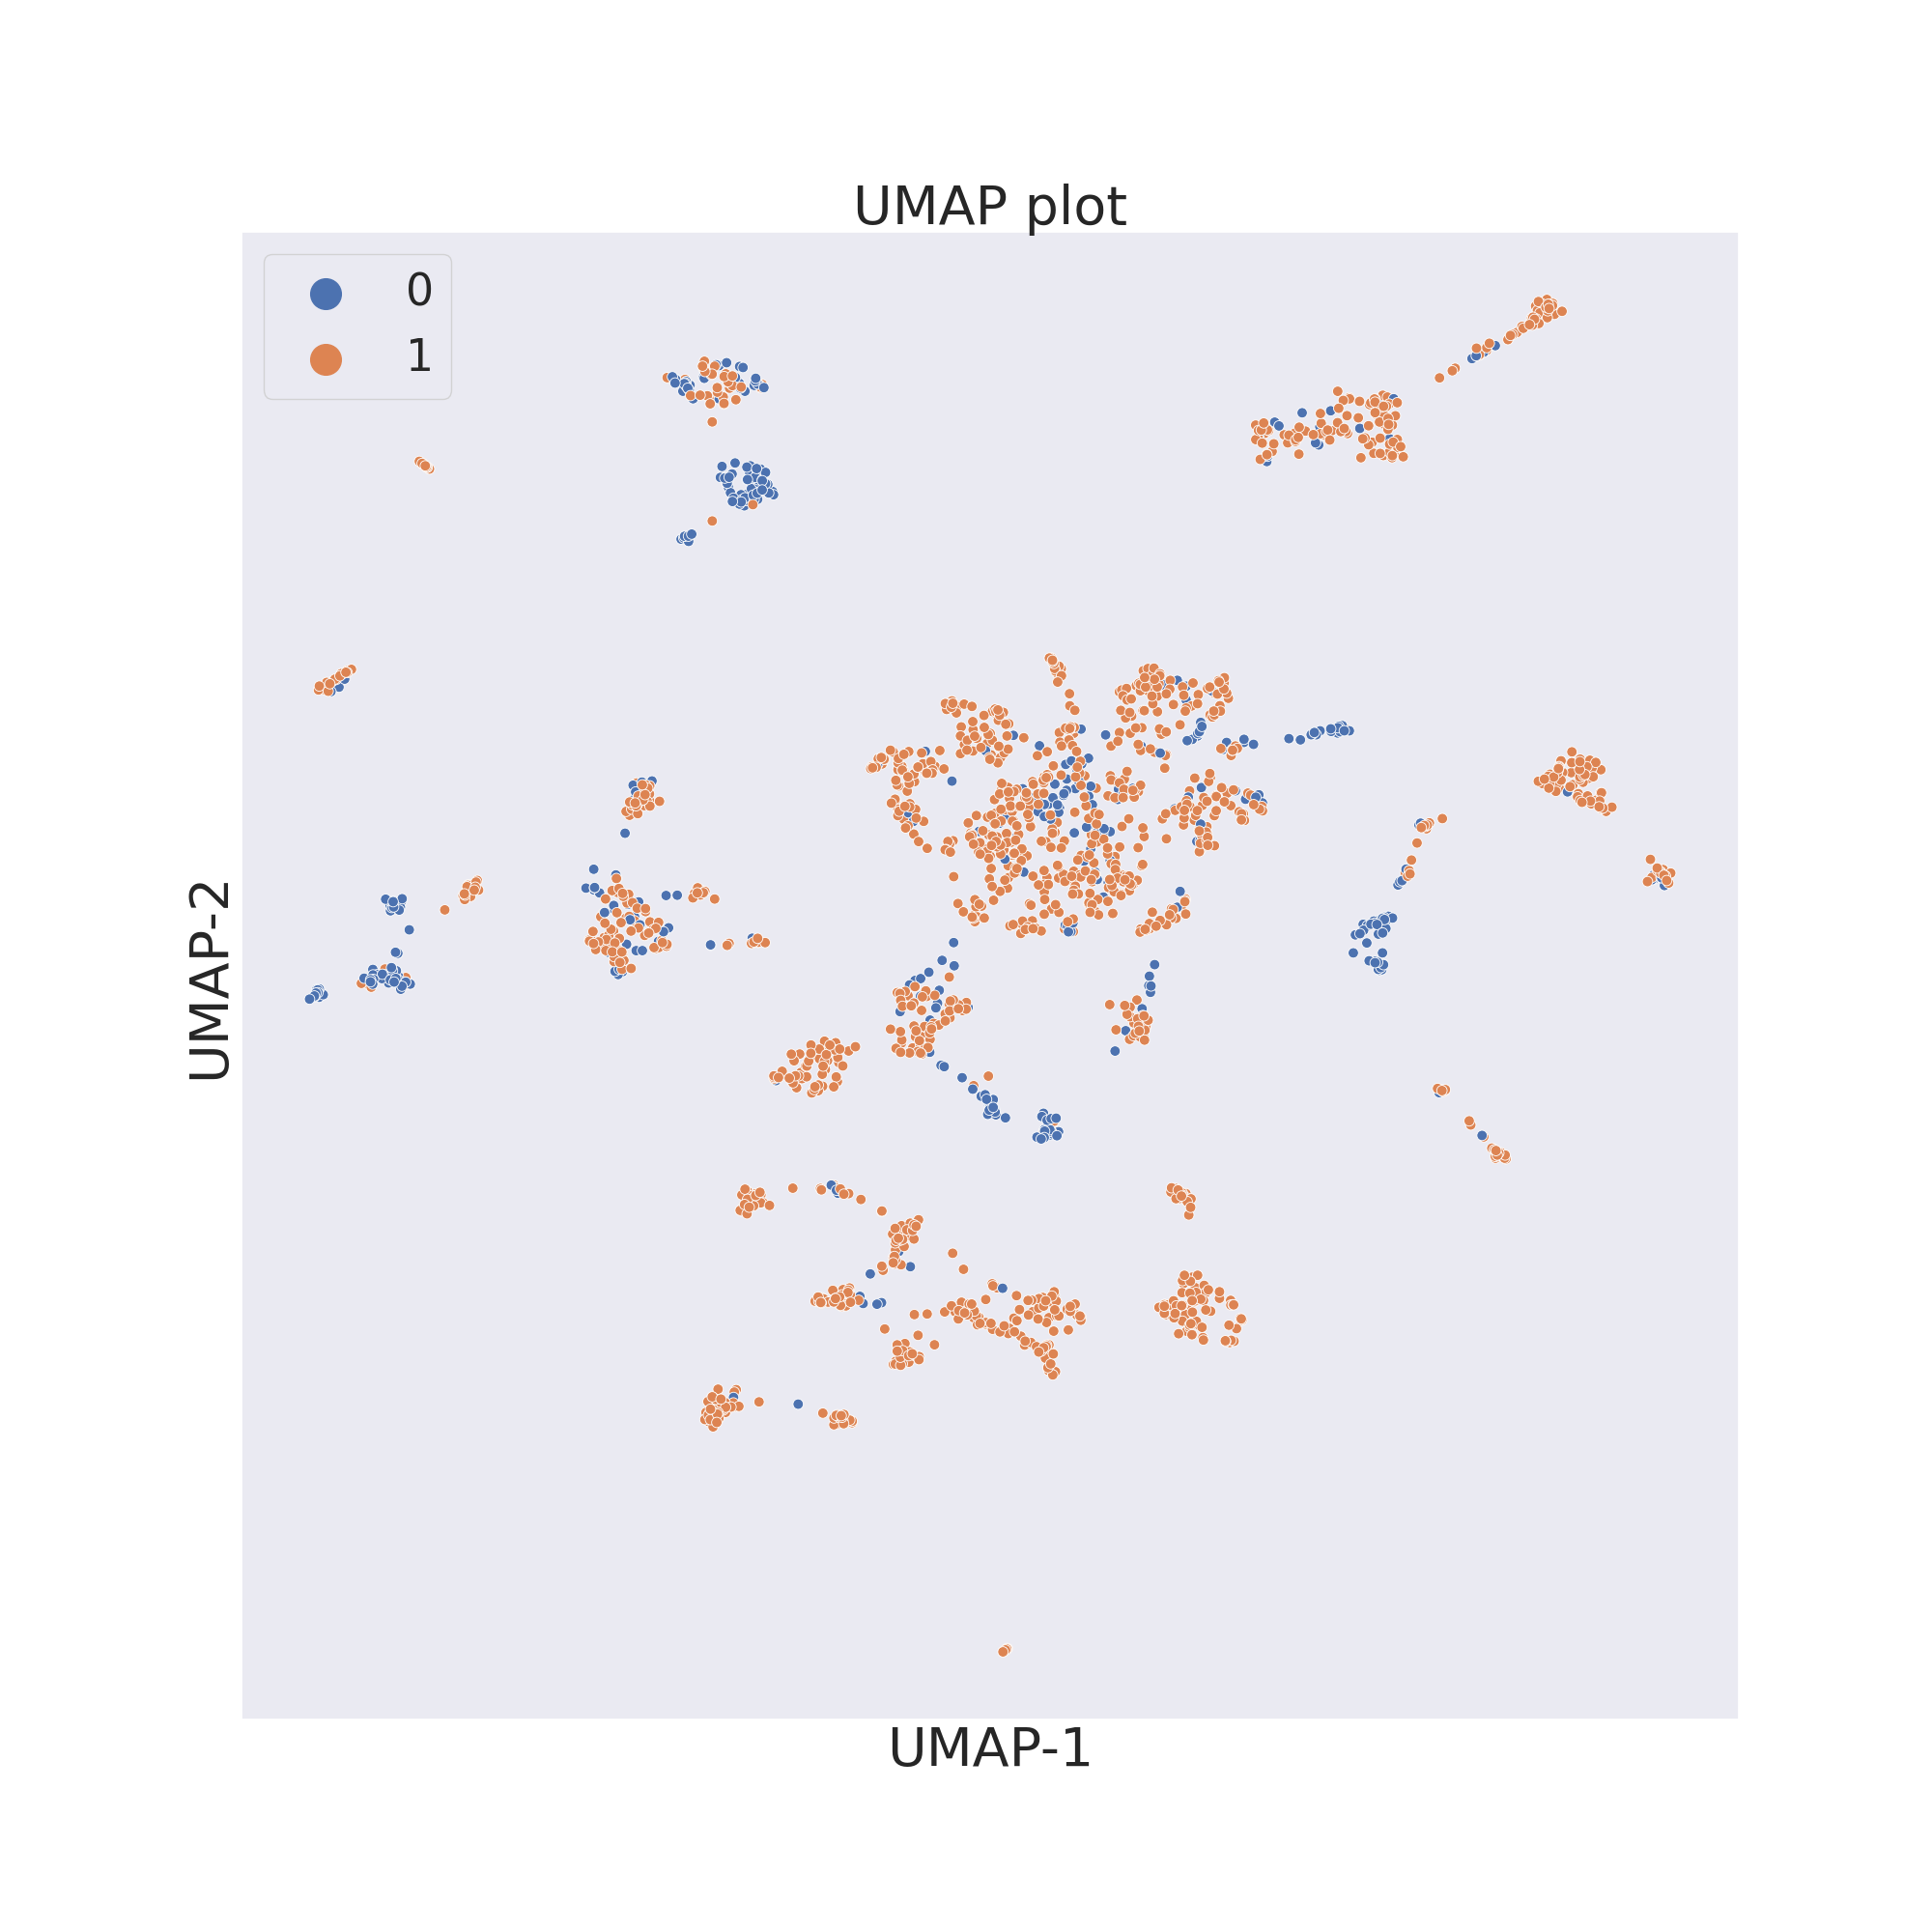
The third figure shows the results obtained by reducing the dimensions of features by UMAP [4].

plotter.umap()
plotter.visualize_plot()

image

In each figure the molecules are coloured by class value.

Citation

If you use ChemPlot for your scientific projects, we would appreciate if you would cite the paper from the Chemestry-Methods journal:

@article{2022ChemPlot,
    author = {Cihan Sorkun, Murat and Mullaj, Dajt and Koelman, J. M. Vianney A. and Er, Süleyman},
    title = {ChemPlot, a Python Library for Chemical Space Visualization},
    journal = {Chemistry–Methods},
    volume = {2},
    number = {7},
    pages = {e202200005},
    keywords = {chemical space visualization, cheminformatics, molecular similarity, Python, tailored similarity},
    doi = {https://doi.org/10.1002/cmtd.202200005},
    url = {https://chemistry-europe.onlinelibrary.wiley.com/doi/abs/10.1002/cmtd.202200005},
    eprint = {https://chemistry-europe.onlinelibrary.wiley.com/doi/pdf/10.1002/cmtd.202200005},
    abstract = {Visualizing chemical spaces streamlines the analysis of molecular datasets by reducing the information 
    to human perception level, hence it forms an integral piece of molecular engineering, including chemical library design, 
    high-throughput screening, diversity analysis, and outlier detection. We present here ChemPlot, which enables users to 
    visualize the chemical space of molecular datasets in both static and interactive ways. ChemPlot features structural and 
    tailored similarity methods, together with three different dimensionality reduction methods: PCA, t-SNE, and UMAP. 
    ChemPlot is the first visualization software that tackles the activity/property cliff problem by incorporating tailored similarity. 
    With tailored similarity, the chemical space is constructed in a supervised manner considering target properties. Additionally, 
    we propose a metric, the Distance Property Relationship score, to quantify the property difference of similar (i. e. close) 
    molecules in the visualized chemical space. ChemPlot can be installed via Conda or PyPI (pip) and a web application is freely 
    accessible at https://www.amdlab.nl/chemplot/.},
    year = {2022}
}

Contact

For any question you can contact us through email:


References:

[1]: Martins, Ines Filipa, et al. (2012). A Bayesian approach to in silico blood-brain barrier penetration modeling. Journal of chemical information and modeling 52.6, 1686-1697

[2]: van der Maaten, Laurens, Hinton, Geoffrey. (2008). Viualizingdata using t-SNE. Journal of Machine Learning Research. 9. 2579-2605.

[3]: Wold, S., Esbensen, K., Geladi, P. (1987). Principal component analysis. Chemometrics and intelligent laboratory systems. 2(1-3). 37-52.

[4]: McInnes, L., Healy, J., Melville, J. (2018). Umap: Uniform manifold approximation and projection for dimension reduction. arXivpreprint arXiv:1802.03426.


chemplot's People

Contributors

dajtmullaj avatar mcsorkun avatar

Stargazers

 avatar  avatar  avatar  avatar  avatar  avatar  avatar  avatar  avatar  avatar  avatar  avatar  avatar  avatar  avatar  avatar  avatar  avatar  avatar  avatar  avatar  avatar  avatar  avatar  avatar  avatar  avatar  avatar  avatar  avatar  avatar  avatar  avatar  avatar  avatar  avatar  avatar  avatar  avatar  avatar  avatar  avatar  avatar  avatar  avatar  avatar  avatar  avatar  avatar  avatar  avatar  avatar  avatar  avatar  avatar  avatar  avatar  avatar  avatar  avatar  avatar  avatar  avatar  avatar  avatar  avatar  avatar  avatar  avatar  avatar  avatar  avatar  avatar  avatar  avatar  avatar  avatar  avatar  avatar  avatar  avatar  avatar  avatar  avatar  avatar  avatar  avatar  avatar  avatar  avatar  avatar  avatar  avatar  avatar  avatar  avatar  avatar  avatar  avatar  avatar

Watchers

 avatar  avatar  avatar  avatar

chemplot's Issues

Using similarity type "structural" throws AttributeError if using t-SNE

When using similarity type 'structural' together with t-SNE, an AttributeError: 'list' object has no attribute 'shape' is thrown. Code to reproduce the error:

from chemplot import Plotter, load_data

data_BBBP = load_data("BBBP")
cp_BBBP = Plotter.from_smiles(data_BBBP["smiles"], target=data_BBBP["target"], target_type="C", sim_type="structural")
cp_BBBP.tsne()

I will be submitting a pull request for a proposed fix shortly.

ImportError: cannot import name 'Panel' from 'bokeh.models'

Hello!

Thanks for uploading the packaged. I'm currently running on an M1 Mac with python 3.10 and I get this error when loading the tutorial dataset file.
Any idea why that might be?
Thanks

>> bokeh info
Python version      :  3.10.9 (main, Jan 11 2023, 09:18:20) [Clang 14.0.6 ]
IPython version     :  8.12.0
Tornado version     :  6.2
Bokeh version       :  3.1.0

unexpected attribute 'plot_width' to figure,

I get this error.
cp_BACE.interactive_plot(show_plot=True)
Any idea what is the problem?

'''python
{
"name": "AttributeError",
"message": "unexpected attribute 'plot_width' to figure, similar attributes are outer_width, width or min_width",
"stack": "---------------------------------------------------------------------------
AttributeError Traceback (most recent call last)
Cell In[7], line 1
----> 1 cp_BACE.interactive_plot(show_plot=True)

File ~/bin/miniconda39/envs/cheminfo/lib/python3.12/site-packages/chemplot/chemplot.py:542, in Plotter.interactive_plot(self, size, kind, remove_outliers, is_colored, clusters, filename, show_plot, title)
540 tabs = None
541 if kind == "scatter":
--> 542 p, tabs = self.__interactive_scatter(x, y, df_data, size, is_colored, clusters, title)
543 else:
544 p = self.__interactive_hex(x, y, df_data, size, title)

File ~/bin/miniconda39/envs/cheminfo/lib/python3.12/site-packages/chemplot/chemplot.py:626, in Plotter.__interactive_scatter(self, x, y, df_data, size, is_colored, clusters, title)
623 TOOLTIPS = parameters.TOOLTIPS_TARGET
625 # Create plot
--> 626 p = figure(title=title, plot_width=size, plot_height=size, tools=tools, tooltips=TOOLTIPS)
628 if len(self.__target) == 0 or not(is_colored):
629 p.circle(x=x, y=y, size=2.5, alpha=0.8, source=df_data)

File ~/bin/miniconda39/envs/cheminfo/lib/python3.12/site-packages/bokeh/plotting/_figure.py:195, in figure.init(self, *arg, **kw)
193 for name in kw.keys():
194 if name not in names:
--> 195 self._raise_attribute_error_with_matches(name, names | opts.properties())
197 super().init(*arg, **kw)
199 self.x_range = get_range(opts.x_range)

File ~/bin/miniconda39/envs/cheminfo/lib/python3.12/site-packages/bokeh/core/has_props.py:375, in HasProps._raise_attribute_error_with_matches(self, name, properties)
372 if not matches:
373 matches, text = sorted(properties), "possible"
--> 375 raise AttributeError(f"unexpected attribute {name!r} to {self.class.name}, {text} attributes are {nice_join(matches)}")

AttributeError: unexpected attribute 'plot_width' to figure, similar attributes are outer_width, width or min_width"
}
'''

Descriptors computed prior to dimensionality reduction

Hello,

is it possible to control the type/number of descriptors calculated for the dataset by Mordor when using the , those that are afterwards used in the dimensionality reduction process?. How is the selection of descriptors managed by ChemPlot?

thanks in advance for the support,

regards

Alfredo

Hide hydrogens when using interactive_plot to render 2D image of molecules

Hi mcsorkun,

Thanks a lot for the great tool.
Just wondering, what would be the best way to hide all the hydrogens when using the interactive_plot?
I tried to preprocess the smiles by rdkit.Chem.rdmolops.RemoveHs, but in the bokeh HTML the 2D images rendered by interactive_plot are still with hydrogens, for example:
image

Would be great to have an option in interactive_plot to do this.

Error when running in web

Hi Experts

I was running here: https://mcsorkun-chemplot-web-web-app-chemplot-jrrecy.streamlitapp.com/

But see the error below when I tried to create visualization:

File "/home/appuser/.conda/lib/python3.7/site-packages/streamlit/runtime/scriptrunner/script_runner.py", line 556, in _run_script
exec(code, module.dict)
File "/app/chemplot-web/web_app_chemplot.py", line 401, in
log_error_info(data_SMILES, data_target, str(error))
File "/app/chemplot-web/web_app_chemplot.py", line 113, in log_error_info
worksheet.update([['SMILES', 'targets']] + values)
File "/home/appuser/.conda/lib/python3.7/site-packages/gspread/utils.py", line 600, in wrapper
return f(*args, **kwargs)
File "/home/appuser/.conda/lib/python3.7/site-packages/gspread/worksheet.py", line 740, in update
{"values": values, "majorDimension": kwargs["major_dimension"]}
File "/home/appuser/.conda/lib/python3.7/site-packages/gspread/spreadsheet.py", line 215, in values_update
r = self.client.request("put", url, params=params, json=body)
File "/home/appuser/.conda/lib/python3.7/site-packages/gspread/client.py", line 65, in request
headers=headers,
File "/home/appuser/.conda/lib/python3.7/site-packages/requests/sessions.py", line 647, in put
return self.request("PUT", url, data=data, **kwargs)
File "/home/appuser/.conda/lib/python3.7/site-packages/google/auth/transport/requests.py", line 486, in request
**kwargs
File "/home/appuser/.conda/lib/python3.7/site-packages/requests/sessions.py", line 573, in request
prep = self.prepare_request(req)
File "/home/appuser/.conda/lib/python3.7/site-packages/requests/sessions.py", line 496, in prepare_request
hooks=merge_hooks(request.hooks, self.hooks),
File "/home/appuser/.conda/lib/python3.7/site-packages/requests/models.py", line 371, in prepare
self.prepare_body(data, files, json)
File "/home/appuser/.conda/lib/python3.7/site-packages/requests/models.py", line 513, in prepare_body
raise InvalidJSONError(ve, request=self)

Could you help please?

Qing

Some problems to run t-SNE in the APP

Hello Chemplot team!.

I write because only can run UMAP and PCA in the APP. Any recomendation for run t-SNE in the APP.

Thank you very much for help me,

3d representation using tailored similarity

Hello,

Very sorry to bother you. I need a 3D representation created using chemplot. How I can do that? I created a umap using tailored similarity. Now I am being asked to create a 3D plot using the same.

cp_BACE = Plotter.from_smiles(data_BACE["smiles"], target=data_BACE["target"], target_type="R", sim_type="tailored")

If chemplot dosen't create 3D plot at the moment, can you guide me how I can get the output with 3 dimensions printed? Would I just print cp_BACE and it's elements? Thanks so much.

Installation issues: matplotlib; sklearn

Hi!

When trying to install with pip, I get errors with the matplotlib and scikit-learn libraries, even though both are installed and up to date.
At the bottom, I paste the fragment of the entire output from the console, where the errors occur. The whole output is attached as a txt file. I have no idea what to do with this problem. I'm using PowerShell with system administrator privileges. RDkit is installed and activated.

chemplot_install_error.txt

 `Extracting freetype-2.6.1.tar.gz
  Building freetype in build\freetype-2.6.1
  msbuild build\freetype-2.6.1\builds\windows\vc2010\freetype.sln /t:Clean;Build /p:Configuration=Release;Platform=x64
  error: command 'msbuild' failed: None
  [end of output]

  note: This error originates from a subprocess, and is likely not a problem with pip.
  ERROR: Failed building wheel for matplotlib`

  error: could not create 'build\bdist.win-amd64\wheel\.\sklearn\datasets\tests\data\openml\292\api-v1-json-data-list-data_name-          
  australian-limit-2-data_version-1-status-deactivated.json.gz': No such file or directory
  INFO:
  ########### EXT COMPILER OPTIMIZATION ###########
  INFO: Platform      :
    Architecture: x64
    Compiler    : msvc

  CPU baseline  :
    Requested   : 'min'
    Enabled     : SSE SSE2 SSE3
    Flags       : none
    Extra checks: none

  CPU dispatch  :
    Requested   : 'max -xop -fma4'
    Enabled     : SSSE3 SSE41 POPCNT SSE42 AVX F16C FMA3 AVX2 AVX512F AVX512CD AVX512_SKX AVX512_CLX AVX512_CNL AVX512_ICL
    Generated   : none
  INFO: CCompilerOpt.cache_flush[857] : write cache to path -> D:\Users\aleniak\AppData\Local\Temp\pip-install-1uih_fd0\scikit-learn_a2e09175a0394b6b907b9332707bf76e\build\temp.win-amd64-cpython-310\Release\ccompiler_opt_cache_ext.py
  INFO:
  ########### CLIB COMPILER OPTIMIZATION ###########
  INFO: Platform      :
    Architecture: x64
    Compiler    : msvc

  CPU baseline  :
    Requested   : 'min'
    Enabled     : SSE SSE2 SSE3
    Flags       : none
    Extra checks: none

  CPU dispatch  :
    Requested   : 'max -xop -fma4'
    Enabled     : SSSE3 SSE41 POPCNT SSE42 AVX F16C FMA3 AVX2 AVX512F AVX512CD AVX512_SKX AVX512_CLX AVX512_CNL AVX512_ICL
    Generated   : none
  INFO: CCompilerOpt.cache_flush[857] : write cache to path -> D:\Users\aleniak\AppData\Local\Temp\pip-install-1uih_fd0\scikit-learn_a2e09175a0394b6b907b9332707bf76e\build\temp.win-amd64-cpython-310\ccompiler_opt_cache_clib.py
  [end of output]

note: This error originates from a subprocess, and is likely not a problem with pip.
ERROR: Failed building wheel for scikit-learn
Failed to build matplotlib scikit-learn
ERROR: Could not build wheels for matplotlib, scikit-learn, which is required to install pyproject.toml-based projects`

Google Colab: Pip Install Error

Installing build dependencies ... done
Getting requirements to build wheel ... done
error: subprocess-exited-with-error

× Preparing metadata (pyproject.toml) did not run successfully.
│ exit code: 1
╰─> See above for output.

note: This error originates from a subprocess, and is likely not a problem with pip.
Preparing metadata (pyproject.toml) ... error
error: metadata-generation-failed

× Encountered error while generating package metadata.
╰─> See above for output.

note: This is an issue with the package mentioned above, not pip.
hint: See above for details.

Tanimoto metric

Hi,

I am slowly learning chemplot. Is it possible to compare the tsne generated from chemplot with tanimoto distance based tsne and use your interactive visualization? Please guide.

thanks,
Jessie

how to load data

Hello,

thanks for this great set of tools. I was going through the tutorials from https://chemplot.readthedocs.io/en/latest/api.html
putting everything in a python script but I couldn't figure out how to load local data sets using something similar to load_data function?
and also do you have any plans to add some other properties like radar charts to this set.

Thanks,
Amir

ImportError: cannot import name 'Panel' from 'bokeh.models'

Hi!

Has anyone had trouble importing "Panel" from bokeh.models (err msg copied below)?

Thnx!

from chemplot import Plotter
Traceback (most recent call last):
File "", line 1, in
File "/data/applic/ChemPlot/chemplot/init.py", line 1, in
from .chemplot import Plotter
File "/data/applic/ChemPlot/chemplot/chemplot.py", line 26, in
from bokeh.models import ColorBar, HoverTool, Panel, Tabs
ImportError: cannot import name 'Panel' from 'bokeh.models' (/data/miniconda3/envs/chemplot_env/lib/python3.9/site-packages/bokeh/models/init.py)

Some problems to run chemplot on google colab

Good day team chemplot!
I write because a have some problems to run chemplot on google colab. I installed the necessary software to run chemplot but the following code did not run.

Do you have any idea what happen?.

Thanks very much for information and help me,

Improving the quality of the figure

Hi,
I am the user of the chemplot, I want to use the figure that come out from the chemplot.

But I have two problems:

  1. I want to remove the color of background, and use a transparent or white background. Can you provide this selection for the users?
  2. The scatter points is small for me, and I wan they are larger than the default one. Can you provide the selection of marker size for the users?
    In this case, the code is nicer to the users. I will thank you vey much if my problems can be solved.

Recommend Projects

  • React photo React

    A declarative, efficient, and flexible JavaScript library for building user interfaces.

  • Vue.js photo Vue.js

    🖖 Vue.js is a progressive, incrementally-adoptable JavaScript framework for building UI on the web.

  • Typescript photo Typescript

    TypeScript is a superset of JavaScript that compiles to clean JavaScript output.

  • TensorFlow photo TensorFlow

    An Open Source Machine Learning Framework for Everyone

  • Django photo Django

    The Web framework for perfectionists with deadlines.

  • D3 photo D3

    Bring data to life with SVG, Canvas and HTML. 📊📈🎉

Recommend Topics

  • javascript

    JavaScript (JS) is a lightweight interpreted programming language with first-class functions.

  • web

    Some thing interesting about web. New door for the world.

  • server

    A server is a program made to process requests and deliver data to clients.

  • Machine learning

    Machine learning is a way of modeling and interpreting data that allows a piece of software to respond intelligently.

  • Game

    Some thing interesting about game, make everyone happy.

Recommend Org

  • Facebook photo Facebook

    We are working to build community through open source technology. NB: members must have two-factor auth.

  • Microsoft photo Microsoft

    Open source projects and samples from Microsoft.

  • Google photo Google

    Google ❤️ Open Source for everyone.

  • D3 photo D3

    Data-Driven Documents codes.