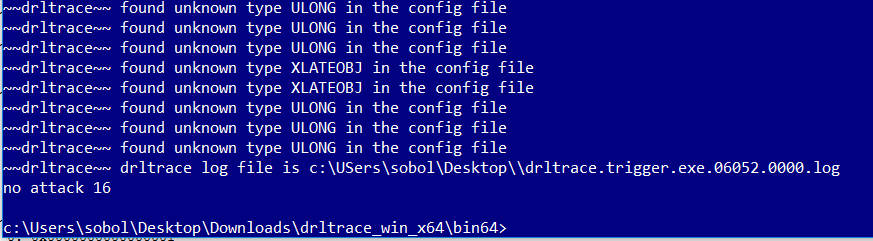
Giter Site home page Giter Site logo

mxmssh / drltrace Goto Github PK

View Code? Open in Web Editor NEW
373.0 28.0 65.0 27.84 MB

Drltrace is a library calls tracer for Windows and Linux applications.

License: BSD 3-Clause "New" or "Revised" License

Python 2.47% HTML 91.35% CMake 1.20% C 2.13% C++ 2.79% PowerShell 0.07%
dbi malware-analysis malware-detection api-trace reverse-engineering

drltrace's Introduction

Drltrace

Windows test build build status

Linux test build Build Status

Drltrace is a dynamic API calls tracer for Windows and Linux applications. Drltrace is built on top of DynamoRIO dynamic binary instrumentation framework. Drltrace was initialy implemented by Derek Bruening and distributed with DynamoRIO and DrMemory frameworks. This repository contains a standalone version of drltrace with additional scripts and materials on how to use it for malware analysis. The release build can be downloaded here.

Usage

The usage of drltrace is very simple. A user needs to specify a log directory and a name of a target process in the following way:

drltrace -logdir . -- calc.exe

That’s all, the tool will inject required DLLs in the target process, starts instrumentation and in parallel will log information about all library calls which are executed in the target process:

~~43600~~ msvcrt.dll!__wgetmainargs
    arg 0: 0x010d2364
    arg 1: 0x010d2368
    and return to module id:0, offset:0x193a
~~43600~~ ntdll.dll!EtwEventRegister
    arg 0: 0x002ff994
    arg 1: 0x010d1490
    and return to module id:0, offset:0x157e
~~43600~~ ntdll.dll!EtwEventSetInformation
    arg 0: 0x007b4b40
    arg 1: 0x00000033
    and return to module id:0, offset:0x15a1
~~43600~~ SHELL32.dll!ShellExecuteW
    arg 0: <null> (type=<unknown>, size=0x0)
    arg 1: <null> (type=wchar_t*, size=0x0)
    arg 2: calculator:// (type=wchar_t*, size=0x0)
    arg 3: <null> (type=wchar_t*, size=0x0)
    arg 4: <null> (type=wchar_t*, size=0x0)
    arg 5: 0x1 (type=int, size=0x4)
    and return to module id:0, offset:0x167d

The format of the output is simple and can be easily parsed by an external script:

~~[thread id]~~ [dll name]![api call name]
arg [arg #]: [value] (type=[Windows type name], size=[size of arg])
and return to module id:[module unique id], offset:[offset in memory]

Parsing with grep can be done when the -grepable argument is used; this prints the function names and arguments all on one line:

~~4824~~ KERNELBASE.dll!CreateFileW {0: C:\Windows\Fonts\staticcache.dat (type=wchar_t*, size=0x0)} {1: 0x80000000 (type=DWORD, size=0x4)} {2: 0x3 (type=DWORD, size=0x4)} {3: 0x005cde8c (type=<unknown>*, size=0x0)} {4: 0x3 (type=DWORD, size=0x4)} {5: 0x80 (type=DWORD, size=0x4)}

The module unique identifiers table is printed at the end of the log file:

Module Table: version 3, count 70
Columns: id, containing_id, start, end, entry, checksum, timestamp, path
  0,   0, 0x010d0000, 0x010da000, 0x010d1b80, 0x0000f752, 0xb5fe3575,  C:\Windows\SysWOW64\calc.exe
  1,   1, 0x6d4c0000, 0x6d621000, 0x6d563940, 0x00136d65, 0x59ce1b0b,  C:\Users\Max\Downloads\drltrace\drltrace\dynamorio\lib32\release\dynamorio.dll
  2,   2, 0x73800000, 0x73975000, 0x7380dbf7, 0x00000000, 0x59ce1b0f,  C:\Users\Max\Downloads\drltrace\drltrace\bin\release/drltracelib.dll
  3,   3, 0x742f0000, 0x742fa000, 0x742f2a00, 0x0000c877, 0x0adc52c1,  C:\Windows\System32\CRYPTBASE.dll
  4,   4, 0x74300000, 0x74320000, 0x7430c9b0, 0x0002c617, 0x245970b4,  C:\Windows\System32\SspiCli.dll
  5,   5, 0x74410000, 0x74431000, 0x74416900, 0x0002a940, 0x88a53c1d,  C:\Windows\System32\GDI32.dll
  6,   6, 0x74440000, 0x74500000, 0x7446fb20, 0x000cc410, 0xd343d532,  C:\Windows\System32\RPCRT4.dll
  7,   7, 0x74500000, 0x74525000, 0x745047d0, 0x00026737, 0xa39c8991,  C:\Windows\System32\IMM32.DLL
  8,   8, 0x74550000, 0x745c7000, 0x7456e8a0, 0x00081857, 0x73b971e1,  C:\Windows\System32\advapi32.dll
  9,   9, 0x748f0000, 0x74929000, 0x748febd0, 0x00045303, 0xa58be652,  C:\Windows\System32\cfgmgr32.dll
 10,  10, 0x74930000, 0x75c78000, 0x74aa09d0, 0x01377aa6, 0x4b39926b,  C:\Windows\System32\SHELL32.dll

Drltrace can easily filter out interlibrary calls and print only API calls performed from the main module (or from a heap) of a target application by specifying -only_from_app option which is very useful in case of applications that generate huge logs. For more granular control, the -filter option allows the user to specify a filter configuration file in order to filter in specific whitelisted functions, or ignore blacklisted functions (see the filter.config file for examples). Drltrace also has several useful external scripts to filter API calls for certain library, print only potentially interesting API calls and strings.

License

Drltrace main modules are distributed under BSD.

Some files required for drltrace are distributed under LGPL. See source files for more details.

Motivation

Malware analysis is not an easy task. Sophisticated software packers like Themida and Armadillo and of course dozens of unnamed packers written by malware authors plus code & data encryption significantly facilitate (in some cases making it completely impossible) static reverse engineering of such samples making life of malware analysts complicated. In such case, API calls tracing can significantly reduce amount of time required to understand an actual malicious intent and reveal a lot of technical details about protected malicious code.

While traditional technique of API-hooking was successfully implemented in several solutions, the approach is well studied by malware authors and can be easily detected and/or bypassed. Moreover, these tools are distributed as standalone heavy-weight GUI applications (as proprietary products) which are not often easy to integrate within existent malware analysis workflow.

If we look on Linux world, there is a wonderful tool called ltrace. Using a single bash command, we can easily get the full trace of API calls of a certain executable.

Why don’t we have such tool (like ltrace in Linux) for Windows which is also transparent against anti-research tricks used by modern malware?

It turns that there is a technique that can help us to have such tool for Windows and trace API calls transparently towards executed program. This technique is called dynamic binary instrumentation aka DBI. DBI is a technique of analyzing the behavior of a binary application at runtime through the injection of instrumentation code.

However, application of DBI for malware analysis is undeservedly limited by unpacking automatization and several proofs of concepts for instructions, basic blocks and function calls tracing. As far as we know, drltrace is a first tool for API calls tracing based on DBI which can be used in practice for malware analysis. We provided several malware analysis examples in our wiki where we described how drltrace allowed to revel in several minutes a lot of internal technical details about sophisticated malicious samples without even starting IDA or debugger.

Why Drltrace Rock ?

  • Fast enough to perform analysis of malicious samples without being detected by time-based anti-research techniques.
  • Supports both x86 and x64 (ARM in future).
  • Supports both Windows and Linux (macOS in future).
  • Supports self-modifying code.
  • Supports all types of library linkage (static and dynamic).
  • Not-detectable by standard anti-research approaches (anti-hooking, anti-debugging and anti-emulation).
  • User can easily add a new function prototype to tell drltrace how to print more details about previously unknown API calls (even about non-system DLLs). External configuration file is used.
  • Easy-to-use and modify for your own purposes (no additional package requirements, no heavy-weight GUI interface).
  • Open-source, code is clear and well-documented. You can freely build & use your own advanced solution on top of drltrace.

Command line options

 -logdir              [     .]  Log directory to print library call data
 -only_from_app       [ false]  Reports only library calls from the app
 -follow_children     [  true]  Trace child processes
 -print_ret_addr      [ false]  Print library call's return address
 -num_unknown_args    [     2]  Number of unknown libcall args to print
 -num_max_args        [     6]  Maximum number of arguments to print
 -default_config      [  true]  Use default config file.
 -config              [    ""]  The path to custom config file.
 -filter              [filter.config]  The path of the whitelist/blacklist file.
 -ignore_underscore   [ false]  Ignores library routine names starting with "_".
 -help                [ false]  Print this message.
 -version             [ false]  Print version number.
 -verbose             [     1]  Change verbosity.
 -use_config          [  true]  Use config file
 -grepable            [ false]  Grepable output

Configuration file syntax

Drltrace supports external configuration files where a user can describe how drltrace should print arguments for certain API calls.

HANDLE|CreateRemoteThread|HANDLE|SECURITY_ATTRIBUTES*|size_t|THREAD_START_ROUTINE*|VOID*|DWORD|__out DWORD*

Each function argument should be separated by |. The first argument is return type, the second argument is a function name itself and the rest are the function arguments. A token __out is used to mark output arguments and ___inout is used to mark input+output arguments.

Malware Analysis Examples

You can find examples of how to use drltrace for analysis of complex malware at our Wiki page.

Log Visualization

To make the work with log files easier, we have implemented a script called api_calls_viz.py which can be used to generate RGB images where each pixel color represents unique API call. For example, the picture below represents log file of WannaCry malware.

API calls picture

The large green areas on the picture represent API calls (wcscmp/wcsicmp) which are used to select files with interesting extensions (e.g. docx, xls, py) to encrypt them. The purple areas represent API calls (FindFirstFile/FindNextFile/CryptEncrypt) which are used to enumerate and encrypt files and folders on the disk.

The script can also generate an HTML representation of generated RGB image where each element can be selected to show a name of API call.

API calls picture

Raw HTML File.

See the api_calls_viz directory for more details.

How to Build

You can find a detailed manual at this Wiki page.

OS Support

Windows, Linux (macOS in future).

CPU Architectures Support

x86, x64 (ARM on the list).

Languages

C and C++ standard library (and logs handling scripts written in Python).

Technical Details

We decided to implement our API calls tracer on top of dynamic binary instrumentation framework DynamoRIO. Drltrace asks DynamoRIO to perform instrumentation of LoadLibrary call to be able to handle new libraries being loaded by the target process. When the process tries to load a new library, DynamoRIO redirects control flow to drltracelib.dll. In turn, drltrace enumerates exported functions in the newly loaded DLL and registers a special callback for each of them. Thus, if some exported function would be called by malware, drltrace’s callback will be executed before this function and the tool will be able to log all required information such as a function name and arguments. Another callback might be registered after the function to save results of execution.

Why not Intel Pin ? We decided to use DynamoRIO motivated by the following reasons:

  1. The source code of DynamoRIO is available on github.com and distributed under BSD license while Intel Pin is a proprietary software.
  2. One of the basic requirements for DynamoRIO at the time of development was transparency towards the instrumented executable.
  3. DynamoRIO uses different technology of instrumentation based on code transformation while Intel PIN uses special trampolines which is not transparent towards analyzed executable and might be detected by malware.

Future Work

  1. While drltrace is not detectable by standard anti-research tricks, DBI-engine itself can be detected as shown in these works 1, 2. Making DynamoRIO resistant against these tricks is important path for future work.
  2. Currently, drltrace prints a raw log and provides several scripts to print important strings and library calls. In future, we plan to add heuristics (probably by applying YARA rules) to be able to select indicative behavior from malware automatically.
  3. Currently, DynamoRIO has beta support of ARM architecture, testing and porting drltrace on ARM is required.
  4. Drltrace doesn’t support situation when malware injects code in a remote process. In such cases, it is possible to tell DynamoRIO inject drltrace in all newly created processes (-syswide_on option of drrun.exe). However, in future, it is necessary to implement a special support in drltrace for such situations.

Our issue tracker contains more details about future of drltrace.

Acknowledgments

Maksim Shudrak https://github.com/mxmssh

Derek Bruening https://github.com/derekbruening

Joe Testa https://github.com/jtesta

drltrace's People

Contributors

jtesta avatar merces avatar mxmssh avatar

Stargazers

 avatar  avatar  avatar  avatar  avatar  avatar  avatar  avatar  avatar  avatar  avatar  avatar  avatar  avatar  avatar  avatar  avatar  avatar  avatar  avatar  avatar  avatar  avatar  avatar  avatar  avatar  avatar  avatar  avatar  avatar  avatar  avatar  avatar  avatar  avatar  avatar  avatar  avatar  avatar  avatar  avatar  avatar  avatar  avatar  avatar  avatar  avatar  avatar  avatar  avatar  avatar  avatar  avatar  avatar  avatar  avatar  avatar  avatar  avatar  avatar  avatar  avatar  avatar  avatar  avatar  avatar  avatar  avatar  avatar  avatar  avatar  avatar  avatar  avatar  avatar  avatar  avatar  avatar  avatar  avatar  avatar  avatar  avatar  avatar  avatar  avatar  avatar  avatar  avatar  avatar  avatar  avatar  avatar  avatar  avatar  avatar  avatar  avatar  avatar  avatar

Watchers

 avatar  avatar  avatar  avatar  avatar  avatar  avatar  avatar  avatar  avatar  avatar  avatar  avatar  avatar  avatar  avatar  avatar  avatar  avatar  avatar  avatar  avatar  avatar  avatar  avatar  avatar  avatar  avatar

drltrace's Issues

Failed to build 32-bit version of drltrace in Linux (-mpreferred-stack-boundary=2)

/home/travis/build/mxmssh/drltrace/drltrace_src/drltrace.cpp:1:0: error: -mpreferred-stack-boundary=2 is not between 4 and 12
/* ***************************************************************************
^
make[2]: *** [CMakeFiles/drltracelib.dir/drltrace.cpp.o] Error 1
make[1]: *** [CMakeFiles/drltracelib.dir/all] Error 2
make: *** [all] Error 2

Syntax of configuration file

The syntax now does not cover many other more complex function prototypes e.g. atexit(). We need to improve that.

Error: Unable to inject

Hello Maksim!
I'm stalking your projects 😅 - on a more serious note I've recently
discovered this project and it's very awesome for bug hunting as well. I discovered
some interesting functions while playing with this tool, however I am not able
to inject Microsoft Edge, is this a limitation from DR itself?

drltrace -logdir . -- C:\Windows\SystemApps\Microsoft.MicrosoftEdge_8wekyb3d8bbwe\MicrosoftEdge.exe
ERROR: unable to inject

Am on a Windows 10 x64 system.
Also, I have another case where if the app crashes, the crashing function won't be shown at the log.
Are you aware of this? Lastly I'm having some issues re compilation but I should open a new issue for that one.

Thanks so much!

Compilation script

It would be easier just to have a compilation script that will pull DrMemory + DynamoRIO and compile them together with drltrace and then remove unnecessary files.

adding system call tracing and anti-analysis detection

Hi, I'm a malware reverse engineer and looking for a dynamic analysis tool with:

  • library call tracing
  • system call tracing
  • anti-analysis (e.g., accessing to PEB/TEB, parsing PE header, and so on) detection

I think DBI is a good candidate to implement easily and your code looks great for my requirements. I have questions.

  1. Will you integrate the drstrace function code in Dr. Memory into your version of drltrace in the future?
  2. If not I'll implement my own based on your code and DynamoRIO APIs (e.g., Code Manipulation API to return dummy data against anti-analysis code). What's the difference between your drltrace and Dr. Memory's one except that it is stand-alone?

DLTrace ails to start packed PE

C:\Program Files (x86)\TechnoResearch\Centurion>C:\Source\drltrace_win_x32\bin\drltrace.exe -logdir c:\source -- centurion.exe
ERROR: failed to create process for "C:\Program Files (x86)\xxxxxxxxx\Centurion\centurion.exe". If you wish I can provide the PE file in question. I haen't tried any of the configuration options.

question about call addresses

how to print the function call address ?

I modified your code a little to print the addresses.

2

for example:
2

the address is 0x0000000140001018 (he was interested in me)

but in logfile i see:

default

how do I modify the code to print the correct addresses

drltrace on Windows 10

Hi,

as I updated to Windows 10 for some time, I now figured out that drltrace doesn't actually work on Windows 10. When running the example from the readme (32-bit or 64-bit drltrace doesn't matter), the following console output is generated, whilst no log is output or saved in the given directory.

C:\drltrace\bin64>drltrace -logdir . -- calc.exe
INFO: C:\Windows\system32\calc.exe sucessfully started, waiting app for exit

C:\drltrace\bin64>

Is anyone else running Windows 10 without any issue, or is this a known bug? How could this be probably fixed, or is there some kind of a limitation under current versions of Windows?

Cheers,
Endres

drltrace can't output the trace of child process

Thanks for all the contribution and information in drltrace. I have just started the research of binary analysis in Windows. And I am trying to apply drltrace on my research to trace the library calls of Adobe Acrobat DC reader. However, I suffered from an issue that I can't get the Adobe related dll such as 'JP2KLib.dll' by applying -only_to_lib flag on drltrace.

My command is ".\drltrace.exe -logdir D:\Winfuzz_test\drltrace_win_x32\log -only_to_lib "JP2KLib.dll" -- "C:\Program Files (x86)\Adobe\Acrobat Reader DC\Reader\AcroRd32.exe" D:\Winfuzz_test\test\1.pdf"

And the environment is Windows 7 with visual studio 2013.

After I tried it on Acrobat Reader 9.0, I can successfully get the 'JP2LLib.dll' in the trace. Maksim told me that maybe the reason is that Acrobat Reader DC will call 'JP2Klib.dll' in its child process, but drltrace can't get the log of the child process now. Can you help me to examine this issue? Thanks for all the help and information.

drltrace for MacOS

To be able to compile drltrace under MacOS, we have to add support of the dr_symbol_export_iterator * group of functions (we have them for Windows and Linux). Right now, we disabled build in case of MacOS and should fix it in future.

I can't find out trace log file

Hello all,

I download drltrace_win64 version in my Win10

I set env & run command drltrace -logdir . .\hello.exe and my terminal display 'INFO: C:\User......\hello.exe sucessfully started, waiting app for exit'

The process finished but I can't see any log, so maybe i missed some configuration?

drltrace unable to track executable

When I try to track an executable on Windows 10 (my drltrace version is "drltrace custom build -- May 5 2021, 10:09:57". I used the instructions on the How To Build page, for Windows 10 64 bits, and thus I have the included DynamoRio version I guess), I get this issue:
When I try to track a Windows application (calc.exe, explorer.exe...), the tracking stops before the application shows up :
drltrace.calc.exe.10636.0000.log

On the other hand, when I try this with a not native application, the application does not start, and I get this message (and no log file). And the application starts normally through PowerShell. Here I tried with audacity:
PS C:\Program Files (x86)\Audacity> & "C:\Users\admin\Documents\Savegames\build\bin64\drltrace.exe" -- .\audacity.exe WARNING: cannot write log file into C:\Program Files (x86)\Audacity, writing log into C:\Users\admin\AppData\Roaming\Dr. LTrace instead INFO: C:\Program Files (x86)\Audacity\audacity.exe sucessfully started, waiting app for exit

Here is the executable:
audacity.zip
But I got the same issues with python3 and steam for example...
Thank you for your help

add correct Windows type printing

We have thousands of unsupported Windows types in drltrace described in the gen_drltrace_config.py.
We need to describe them one by one to be able to print them correctly.

drltrace does not output logs

Hello ! Thanks for this cool project.
I've downloaded it and I can make it works perfectly except when it deal with my binaries, mostly compiled from ASM using nasm or masm, or compiled from linux using minGW.

The only output I get is:
INFO: XXX.exe successfully started, waiting app for exit, even if the app is already closed.

Do you know where it may come from ?

The problem with the arguments

Hello )

I downloaded drltrace_win_x64.rar
and then I launched (by the way, is there any way to remove the rows with: ~~ found unknown type XLATEOBJ in the config file ?):
1

Here is the result and the logfile name:
2

I can't figure out where the arguments to the GetLocalTime function are:
3

This function must take one argument:
4
This is my source code with GetLocalTime():
5

Why are the arguments for the GetLocalTime function not printed ?)

DynamoRIO crashes with 32-bit drltrace (RelWithDebInfo)

There is some problem with drltrace when compiled in RelWithDebInfo configuration.

 Test command: /home/travis/build/mxmssh/drltrace/build/bin/drltrace "--" "./bin/drltrace_app"
1: Test timeout computed to be: 10000000
1: <Application /home/travis/build/mxmssh/drltrace/build/bin/drltrace_app (11338).  DynamoRIO internal crash at PC 0xf7e2e2d3.  Please report this at http://dynamorio.org/issues/.  Program aborted.
1: Received SIGSEGV at unknown pc 0xf7e2e2d3 in thread 11338
1: Base: 0xf7d27000
1: Registers:eax=0x00000000 ebx=0xff8a5ac8 ecx=0x00000035 edx=0xf7a57a40
1: 	esi=0x00046c94 edi=0xff8a5ac0 esp=0xff8a5abc ebp=0xff8a5ac2
1: 	eflags=0x00010286

drltrace will not work on GUI Apps

Running Windows 11 Pro

Downloaded the latest 64-bit version of the program. Trying to use the example from the documentation to run calc.exe fails:

.\drltrace.exe -logdir . -- calc.exe

<Application C:\Windows\system32\calc.exe (50824).  Dr. LTrace internal crash at PC 0x00000000710cb79b.  Please report this at ???.  Program aborted.
0xc0000005 0x00000000 0x00000000710cb79b 0x00000000710cb79b 0x0000000000000001 0x000000007118dcbc
Base: 0x0000000071000000
Registers: eax=0x0000000000000001 ebx=0x000002540e418040 ecx=0xffffffffffffffff edx=0x0000000000000001
        esi=0x00000094038ff258 edi=0x0000000000000000 esp=0x00000094038ff118 ebp=0x0000000000000000
        r8 =0xffffffffffffffe0 r9 =0x000002540e323520 r10=0x0000000000000000 r11=0x0000000000000246
        r12=0x0000000000000001 r13=0x0000000000000000 r14=0x00000094038ff800 r15=0x0000000000000000
        eflags=0x0000000000010286
version 7.91.18333, custom build
-no_dynamic_options -client_lib 'C:\Users\ianfr\Desktop\drltrace_win64\bin64\drltracelib.dll;0;-logdir . -logdir `C:\Users\ianfr\Desktop\drltrace_win64\bin64` -config `C:\Users\ianfr\Desktop\drltrace_win64\bin64\drltrace.config` ' -code_api -probe_api -stack_size 56K -max_elide_jmp 0 -max_elide_call 0 -no_inline_ignored_>`

image

Trying to run it on other GUI apps either also crashes, or else fails to start the program with no output:

.\drltrace.exe -logdir . -print_ret_addr -- 'C:\Users\ianfr\OneDrive\Transfer\assembly-re-projs\session1\gui-crackme-1\GUICrackMe1.exe'
INFO: C:\Users\ianfr\OneDrive\Transfer\assembly-re-projs\session1\gui-crackme-1\GUICrackMe1.exe sucessfully started, waiting app for exit
 11/28/2023 08:10:01

Improve CMake compilation file

We use truncated version of CMake build file from the original DrMemory repository. It is necessary to create our own build script for drltrace.

Starter script for Windows

In my understanding drltrace 32-bits can only trace PE32 files and drltrace 64-bits should be used with PE32+ files. For people that have 64-bit Windows, it'd be handy to have the ability to run drltrace <file> from anywhere in the system. I've thought about putting both the content of bin folder from drltrace_win32.7z and bin64 folder from drltrace_win64.7z under the same folder and add its full path to PATH environment variable, but lots of files have the same name. The workaround I found is to use a PowerShell script called drltrace and put it within a folder structure like this:

c:\tools\bin>dir
 Volume in drive C has no label.
 Volume Serial Number is 5CE4-F9DE

 Directory of c:\tools\bin

17/03/2020  23:36    <DIR>          .
17/03/2020  23:36    <DIR>          ..
18/03/2020  00:59             1,647 drltrace.ps1
14/03/2020  05:10    <DIR>          drltrace_win32
14/03/2020  05:12    <DIR>          drltrace_win64
08/05/2017  08:14         8,438,645 floss.exe
23/01/2020  17:56           412,672 upx.exe
13/11/2019  19:06           434,068 xorsearch-x64.exe

The script checks if the PE file given is compiled to 32 or 64-bits and call the right drltrace version to run it. If you add it to PATH, then you can call it from PowerShell shell this way:

drltrace-powershell

Or using cmd:

drltrace-cmd

The idea is to make things easier when using it in a VM to analyse both 32 and 64-bits binaries.

If you think it's useful for other drltrace users, just point me out where I should put it in your directory tree and I can send a PR.

Thanks for your great tool!

Recommend Projects

  • React photo React

    A declarative, efficient, and flexible JavaScript library for building user interfaces.

  • Vue.js photo Vue.js

    🖖 Vue.js is a progressive, incrementally-adoptable JavaScript framework for building UI on the web.

  • Typescript photo Typescript

    TypeScript is a superset of JavaScript that compiles to clean JavaScript output.

  • TensorFlow photo TensorFlow

    An Open Source Machine Learning Framework for Everyone

  • Django photo Django

    The Web framework for perfectionists with deadlines.

  • D3 photo D3

    Bring data to life with SVG, Canvas and HTML. 📊📈🎉

Recommend Topics

  • javascript

    JavaScript (JS) is a lightweight interpreted programming language with first-class functions.

  • web

    Some thing interesting about web. New door for the world.

  • server

    A server is a program made to process requests and deliver data to clients.

  • Machine learning

    Machine learning is a way of modeling and interpreting data that allows a piece of software to respond intelligently.

  • Game

    Some thing interesting about game, make everyone happy.

Recommend Org

  • Facebook photo Facebook

    We are working to build community through open source technology. NB: members must have two-factor auth.

  • Microsoft photo Microsoft

    Open source projects and samples from Microsoft.

  • Google photo Google

    Google ❤️ Open Source for everyone.

  • D3 photo D3

    Data-Driven Documents codes.