Giter Site home page Giter Site logo

neurogenomics / rare_disease_celltyping Goto Github PK

View Code? Open in Web Editor NEW
6.0 3.0 0.0 510.66 MB

Code, data and results associated with the "Rare diseases cell-typing" project.

R 0.15% HTML 80.18% JavaScript 4.69% Lua 0.01% TeX 14.24% Jupyter Notebook 0.75%
rare-disease cell-type-deconvolution genetics enrichment-analysis

rare_disease_celltyping's Introduction

Identification of cell types underlying thousands of rare diseases and subtraits

Kitty B. Murphy, Bobby Gordon-Smith, Jai Chapman, Momoko Otani, Brian M. Schilder, Nathan G. Skene

Introduction

Rare diseases (RDs) are uncommon as individual diagnoses, but as a group contribute to an enormous disease burden globally. However, partly due the low prevalence and high diversity of individual RDs, this category of diseases is understudied and under-resourced. The advent of large, standardised genetics databases has enabled high-throughput, comprehensive approaches that uncover new insights into the multi-scale aetiology of thousands of diseases. Here, using the Human Phenotype Ontology (9,677 annotated phenotypes) and multiple single-cell transcriptomic atlases (77 human cell types and 38 mouse cell types), we conducted >688,000 enrichment tests (x100,000 bootstrap iterations each) to identify >13,888 genetically supported cell type-phenotype associations.

This repository contains the data and code needed to replicate the analyses in our preprint [insert link to preprint], as well as links to the R packages required (see below).

  • KGExplorer: Imports and analyses large-scale biomedical knowledge graphs and ontologies.

  • HPOExplorer: Contains extensive functions for easily importing, annotating, filtering, and visualising the Human Phenotype Ontology (HPO) at the disease, phenotype, and gene levels.

  • MSTExplorer: Systematically identifies, prioritises, and visualises cell-type-specific gene therapy targets across the phenome.

rare_disease_celltyping's People

Contributors

bobgsmith avatar bschilder avatar jaichapman avatar kittymurphy avatar nathanskene avatar

Stargazers

 avatar  avatar  avatar  avatar  avatar

Watchers

 avatar  avatar  avatar

rare_disease_celltyping's Issues

Make figures / text based around the cell type specificity of obvious facial markers visible from birth

Jai had the figure showing that leaf nodes of HPO are more specific. Bobby to add an extra one showing the leaf nodes are more likely to only have one cell type association.

This principle can be followed through to the idea that facial morphological defects should be cell type specific.

E.g. there is a broad "abnormal lip morphology" which is associated with excitatory, inhibitory neurons, astrocytes and amacrine cells.

But a subphenotype of that, "short philtrum" is specific to excitatory neurons.

And a subphenotype "cleft upper lip" is astrocyte specific.

Can suggest then that obvious facial defects can be used to gain insight into the underlying cell types.

Drop files that are now outdated / no longer required

Drop code files which are no longer used, e.g. process_hpo_to_genelists.r. That file is replaced by process_hpo_to_genelists-wholebody.r... we want the repo to be neat and tidy and only have the latest version of files.

If it is not called by the makefile, remove it (if outdated) or move it to a new repo (if it just doesn't belong there anymore)

Assess pLI in HPO genes

Originally discussed here:

We should asses the relationship between HPO genes and probability of Loss Intolerance (pLI) scores.

Questions

  • Do HPO genes have greater pLI than randomly sampled background genes from the human genome?
  • Is there a relationship between cell-type specificity scores (from our CTDs) and pLI?
  • Do phenotypes with stronger cell type enrichment (in terms of fold-change) tend to have genes with greater pLI scores?
  • Is there a relationship between pLI and GenCC evidence scores? (use HPOExplorer::get_gencc() to get the GenCC data)

@KittyMurphy it would be great if you could start exploring these questions and upload them as rmarkdown reports in this repo.
Perhaps start by just uploading a script showing me how to get the pLI scores for all genes, so I can start exploring this a bit as well.

Also just came across this paper:

Improve function coding practices

This is more of a personal preference, but i find it much easier to read functions when the arguments are separated by newlines.

Also, it's good practice to make all function arguments explicit, bc if the order of the args ever changes, the function won't break.

Lastly, it's not essential to for every single function, but I think including @examples for a greater proportion of functions would be helpful.

Screenshot 2021-08-24 at 13 59 29

Setup the document so that the text can be edited in authorea + figures regenerated from a markdown file

Basic idea for this is described here:
https://www.authorea.com/users/2191/articles/278550-a-step-by-step-guide-to-using-authorea-github-and-jupyter-for-reproducible-dynamic-collaborative-data-science-in-public-health

This is the best guide for how it can be done that I've seen:
https://21docs.com/users/244977/articles/324602-how-to-combine-r-with-authorea-to-collaboratively-write-reproducible-scientific-papers

Authorea allows collaborative editing of the markdown document + references

Authorea documents can be linked to a github repo

Then we keep a markdown document within the same repo. This is used to (re)generate all the figures as required. The markdown document probably wouldn't perform the whole (computationally intensive) analysis, it would be for e.g. generating figures. The figures are then saved as *.jpeg and read into the Authorea document.

Improve app speed

I'm combing through the code of all the apps and looking for places where we could improve speed.

Here's a couple of things I'll be on the lookout for:

  • Use data.table wherever possible (much more efficient than standard data.frame)
  • Onlylibrary(pkg) packages that you need all functions from. Otherwise use pkg::function in the code itself, and/or @importfrom pkg function in the Roxygen notes.
  • Remove variables when they're no long being used.
  • Replace for loops with lapply or mclapply.
  • Introduce parallelization where possible.
  • Pre-calculate results as much as possible.
  • Look for functions that could be replaced with more efficient versions.

I'll work on the bschilder_dev branch and then we can merged afterwards.

Assess our results against known phenotype-celltype links

The Monarch knowledge graph (KG) include well-established links between phenotypes/diseases and celltypes.
Of those, 103 are phenotypes within the HPO with associations across 79 different cell types. We can use this to validate our own MultiEWCE enrichment results. However, only 64 phenotypes were included in our results, likely due to the lack of >=4 genes for certain phenotypes.

kg_res.csv

See the rendered validation report here.
https://neurogenomics.github.io/rare_disease_celltyping/code/validation

Programmatic checking

To do this programmatically, we need the following in both the KG and the MultiEWCE enrichment results to have the following:

  • HPO IDs ✅ : already present in both
  • Cell Ontology IDs ❌ : present in KG, but not our enrichment results, since we used the freeform annotations provided by the authors.
    • As it turns out, CellxGene has since provided harmonised versions of both DescartesHuman and HumanCellLandscape, complete with Cell Ontology (CL)-aligned annotations (alongside the freeform ones).
  • Cell Ontology IDs at the same level ❌ :
    • That said, even with the CL Ids, the annotations are not guarantees to be defined at the same level within the ontology (e.g. "neurons" vs. "interneurons"). There is a package by Irene Papatheodorou's lab called scOntoMatch that is designed to make sets of CL IDs comparable by finding their shared common ancestors.
    • After trying this a number of different ways, I had trouble getting too far up the CL ontology to the point of many annotations becoming meaningless (e.g. "stellate cell" --> "cell"). I may be missing something, and the tool seems conceptually useful, so I'll reach out to the package author to see if i can get some more info.
    • Another issue with this approach is that the CL doesn't seem to always consider developmental precursors (hematopoetic stem cells) in addition to ontological ancestors.

Manual checking

Thus, I ultimately took an approach where I merged the KG with our significant results (DecartesHuman + HumanCellLandscape; FDR<5%), joining on the HPO ID column only. I then manually compared the KG celltype annotations with those in our results, looking up cell type definitions where needed.

After manual inspection I found that 65.6% (42/64) of known causal phenotype-cell type associations were recapitulated by our MultiEWCE results. In many instances, our results further resolved the specific cell subtype(s) underlying the phenotype (e.g. "neuron" to "visceromotor neuron", or "muscle cell" to "ventricular cardiac muscle cell").

For several KG cell types (sperm, germ cell), we didn't have an equivalent celltype in either of our CTD references and thus could not compare our results.

What's up with these missing phenotype-celltype associations?

Strangely, almost all of the known phenotype-celltype associations we missed are the most obvious ones!
Things like

  • HP:0100494 | Abnormal mast cell morphology (HPO)
  • HP:0100705 | Abnormal glial cell morphology (HPO)
  • HP:0012757 | Abnormal neuron morphology (HPO)
  • etc. see here for the full list: kg_missing.csv

Some possible reasons

  • The way our specificity matrix is constructed, we may be missing some of the markers for neurons in general (instead, focusing on neuronal subtype markers). But as both our CTDs are multi-system atlases, I'd expect that kind of effect to be attenuated.
  • Incomplete genes lists in the HPO.
  • Stringent multiple testing correction may have killed some weaker signals (tho not sure why these would be quite so weak). All 22 missing phenotypes-associations are significant at an uncorrected p-value (<0.05). Though I'd expect the enrichment to be quite strong for these phenotypes.

But are we simply recalling these associations due to massive amounts of testing?

It seems not! Using FDR<5% seems to be sufficient to keep the number of enriched celltypes per phenotype reasonable. In the KG annotations they have 1 cell type per phenotype. In ours, we have a median of 4 cell types per phenotype. DescartesHuman has 77 unique celltypes while HCL has 124, for a total of 201 cell types that we tested across all phenotypes. If we assume a single "correct" celltype per phenotype (from the KG annotations), this would mean we have a 4/201 (2%) probability of picking the correct celltype by chance.

Now, one might argue this isn't quite right since multiple celltypes can count as the "correct" celltype, including a direct match , a developmental precursor, or an ontological ancestor. But even if you triple our number of "draws", that would still only be 12/201 (6%) probability of getting the correct celltype by chance.

Conclusions

I think this provides some decent evidence to our claim that our enrichment results represent the real causal celltypes underlying these phenotypes. But the imperfect recall rate (especially for obvious associations) leaves some concerns.

Are congenital phenotypes more enriched for fetal cell types?

  • Are congenital phenotypes are more strongly enriched for fetal cell types than congenital phenotypes?
    • Strategy: Identify cell types that only occur in fetal samples (and not adult samples)
  • Are congenital phenotypes are more strongly enriched for fetal cell types vs. adult cell types?
    • Strategy: Identify cell types that occur in both fetal and adult samples, and compare their relative enrichment levels in congenital vs. non-congenital disease.

We can assess these questions with the Human Cell Landscape as it contains both fetal and adult cell types.

We can use the "congenital_onset" column from GPT annotations to categorise each phenotype.
neurogenomics/RareDiseasePrioritisation#19

Engage with rare disease community

Identify ways to share our findings, and get members of the rare disease community to engage with our resources (e.g. web apps).

Stakeholders

  • Researchers
  • Healthcare providers (doctors, nurses, physician assistants)
  • Rare disease patients
  • Family of rare disease patients

Rare disease networks

Contacts

  • Caroline Olshewsky: head of Lupus UK and Foundation for ARID1B. Met her at Crick Institute RD conference and she was very excited to discuss our results.

Cut the words in the paper back to 2500 to fit with requirements for science report submission

Here's the word limit info: https://www.science.org/content/page/science-information-authors

Reports (up to ~2500 words including references, notes and captions–corresponds to ~3 printed pages in the journal) present important new research results of broad significance. Reports should include an abstract, an introductory paragraph, up to four figures or tables, and about 30 references. Materials and Methods should be included in supplementary materials, which should also include information needed to support the paper's conclusions.

Try 'pruning' the terms associated with 'Pancreatic Stellate Cells'... if all leaf nodes of a parent are enriched, then drop the leaf terms. Then we can see a cleaner list of what phenotypes are associated with it

It's interesting because they have more phenotypes associated with them than any other cell type...

But they are not associated with 'abnormality of the pancreas' (though all other major classes of pancreatic cell type are associated)

Without pruning the phenotypes associated with it just look like a random mixed bag

Describe Human Cell Landscape CTD levels

Script to preprocess the HCL here:
https://github.com/neurogenomics/model_celltype_conservation/blob/4bcd4d569775a5f17c70ff314ad68accc9e47e4b/scripts/prepare_HumanCellLandscape.R#L52C2-L60C47

Define levels

The main thing to note is that I used the following combinations of metadata variables from the original study to create 5 levels:

> save_path="/shared/bms20/projects/model_celltype_conservation/raw_data/scRNAseq/standardized/HumanCellLandscape.orth.h5ad"
> adat2 <- prepare_metadata(adat = adat,
>                           save_path = save_path,
>                           species = "human",
>                           level_cols = list(level1="tissue",
>                                             level2="celltype",
>                                             level3=c("stage","celltype"),
>                                             level4=c("tissue","celltype"),
>                                             level5=c("tissue","celltype","cluster")
>                                             )

Assess preprocessed HCL scRNA-seq data

> adat
AnnData object with n_obs × n_vars = 599926 × 27341
    obs: 'batch', 'tissue', 'n_genes', 'n_counts', 'id', 'cluster', 'stage', 'donor', 'celltype', 'cellid', 'level1', 'level2', 'level3', 'level4', 'level5', 'species'
    var: 'n_cells'
    uns: 'levels_key'

Check each level

Within each level (the metadata column i use to generate the CTD aferwards), asses the number of unique values and show 10 example values.

> lapply(grep("^level",names(adat$obs),value = TRUE), function(x)head(unique(adat$obs[[x]]),10))
[[1]]
 [1] AdultAdipose         AdultAdrenalGland    AdultArtery          AdultAscendingColon  AdultBladder        
 [6] AdultBoneMarrow      AdultCerebellum      AdultCervix          AdultTransverseColon AdultDuodenum       
59 Levels: AdultAdipose AdultAdrenalGland AdultArtery AdultAscendingColon AdultBladder ... Placenta

[[2]]
 [1] Macrophage             Monocyte               Stromal cell           Smooth muscle cell     Dendritic cell        
 [6] B cell (Plasmocyte)    Erythroid cell         T cell                 Endothelial cell (APC) Fibroblast            
63 Levels: AT2 cell Adrenal gland inflammatory cell Antigen presenting cell (RPS high) Astrocyte ... hESC

[[3]]
 [1] Adult.Macrophage             Adult.Monocyte               Adult.Stromal cell           Adult.Smooth muscle cell    
 [5] Adult.Dendritic cell         Adult.B cell (Plasmocyte)    Adult.Erythroid cell         Adult.T cell                
 [9] Adult.Endothelial cell (APC) Adult.Fibroblast            
124 Levels: Adult.AT2 cell Adult.Antigen presenting cell (RPS high) Adult.Astrocyte ... HESC.hESC

[[4]]
 [1] AdultAdipose.Macrophage             AdultAdipose.Monocyte               AdultAdipose.Stromal cell          
 [4] AdultAdipose.Smooth muscle cell     AdultAdipose.Dendritic cell         AdultAdipose.B cell (Plasmocyte)   
 [7] AdultAdipose.Erythroid cell         AdultAdipose.T cell                 AdultAdipose.Endothelial cell (APC)
[10] AdultAdipose.Fibroblast            
1361 Levels: AdultAdipose.B cell (Plasmocyte) AdultAdipose.Dendritic cell ... Placenta.hESC

[[5]]
 [1] AdultAdipose.Macrophage.cluster2             AdultAdipose.Monocyte.cluster13             
 [3] AdultAdipose.Stromal cell.cluster27          AdultAdipose.Smooth muscle cell.cluster42   
 [5] AdultAdipose.Dendritic cell.cluster22        AdultAdipose.B cell (Plasmocyte).cluster3   
 [7] AdultAdipose.Erythroid cell.cluster75        AdultAdipose.T cell.cluster6                
 [9] AdultAdipose.Endothelial cell (APC).cluster8 AdultAdipose.Fibroblast.cluster18           
1864 Levels: AdultAdipose.B cell (Plasmocyte).cluster3 ... Placenta.hESC.cluster87

Regenerate manuscript figures with new results

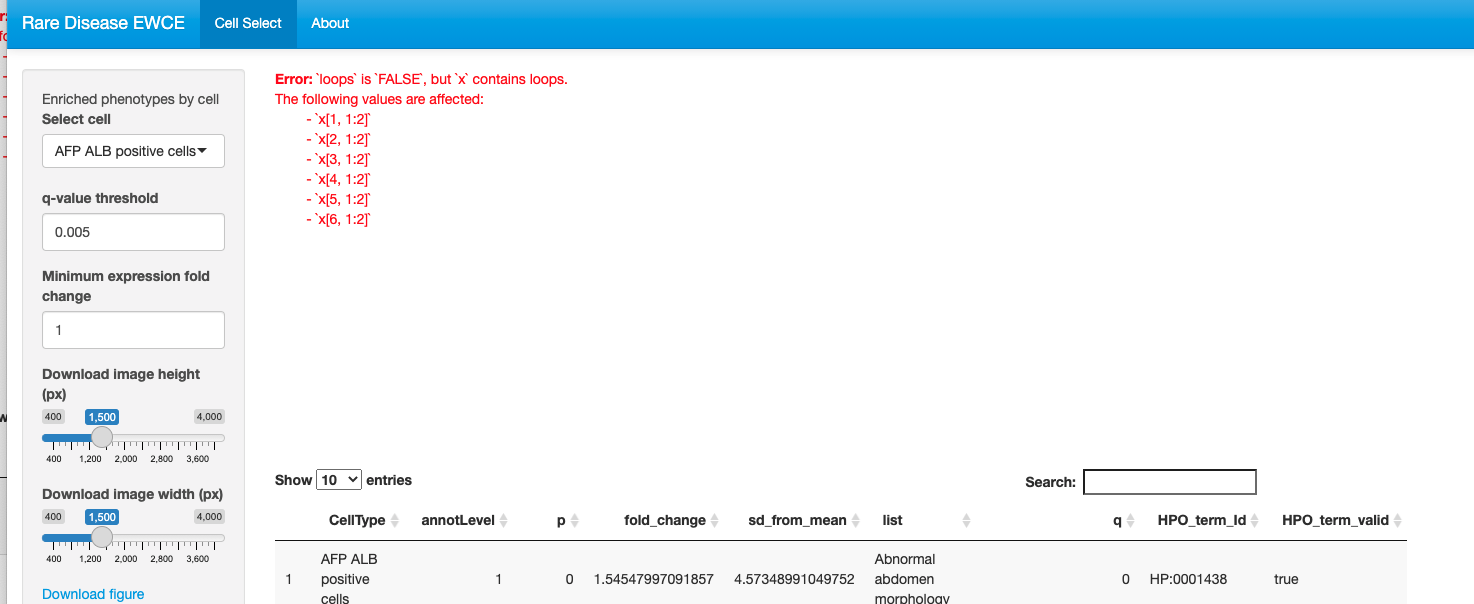
Cell_select_interactive: `Error:`loops` is `FALSE`, but `x` contains loops. `

When i launch the Cell_select_interactive shiny app locally this error appears. Have you encountered this before @ovrhuman ?:
Screenshot 2021-08-24 at 13 23 13

I'm running Rstudio within a docker container, so i'm viewing the ap through a Chrome tab.

Session info

R version 4.1.0 (2021-05-18)
Platform: x86_64-pc-linux-gnu (64-bit)
Running under: Ubuntu 20.04.2 LTS

Matrix products: default
BLAS/LAPACK: /usr/lib/x86_64-linux-gnu/openblas-pthread/libopenblasp-r0.3.8.so

locale:
 [1] LC_CTYPE=en_US.UTF-8       LC_NUMERIC=C               LC_TIME=en_US.UTF-8        LC_COLLATE=en_US.UTF-8    
 [5] LC_MONETARY=en_US.UTF-8    LC_MESSAGES=C              LC_PAPER=en_US.UTF-8       LC_NAME=C                 
 [9] LC_ADDRESS=C               LC_TELEPHONE=C             LC_MEASUREMENT=en_US.UTF-8 LC_IDENTIFICATION=C       

attached base packages:
[1] grid      stats     graphics  grDevices utils     datasets  methods   base     

other attached packages:
 [1] jsonlite_1.7.2       httr_1.4.2           sna_2.6              statnet.common_4.5.0 ggnet_0.1.0          cowplot_1.1.1       
 [7] stringr_1.4.0        ontologyPlot_1.6     ontologyIndex_2.7    Rgraphviz_2.37.2     graph_1.71.2         BiocGenerics_0.39.1 
[13] DT_0.18              plotly_4.9.4.9000    shinythemes_1.2.0    shiny_1.6.0          reshape2_1.4.4       plyr_1.8.6          
[19] network_1.17.1       viridis_0.6.1        viridisLite_0.4.0    ggnetwork_0.5.10     ggplot2_3.3.5       

loaded via a namespace (and not attached):
 [1] fs_1.5.0            usethis_2.0.1       devtools_2.4.2      rprojroot_2.0.2     tools_4.1.0         bslib_0.2.5.1      
 [7] utf8_1.2.2          R6_2.5.0            DBI_1.1.1           lazyeval_0.2.2      colorspace_2.0-2    withr_2.4.2        
[13] tidyselect_1.1.1    gridExtra_2.3       prettyunits_1.1.1   processx_3.5.2      curl_4.3.2          compiler_4.1.0     
[19] cli_3.0.1           desc_1.3.0          sass_0.4.0          scales_1.1.1        callr_3.7.0         digest_0.6.27      
[25] pkgconfig_2.0.3     htmltools_0.5.1.1   sessioninfo_1.1.1   fastmap_1.1.0       htmlwidgets_1.5.3   rlang_0.4.11       
[31] rstudioapi_0.13     jquerylib_0.1.4     generics_0.1.0      paintmap_1.0        crosstalk_1.1.1     dplyr_1.0.7        
[37] magrittr_2.0.1      Rcpp_1.0.7          munsell_0.5.0       fansi_0.5.0         lifecycle_1.0.0     stringi_1.7.3      
[43] yaml_2.2.1          pkgbuild_1.2.0      promises_1.2.0.1    crayon_1.4.1        lattice_0.20-44     ps_1.6.0           
[49] pillar_1.6.2        stats4_4.1.0        pkgload_1.2.1       glue_1.4.2          data.table_1.14.0   remotes_2.4.0      
[55] BiocManager_1.30.16 vctrs_0.3.8         httpuv_1.6.1        testthat_3.0.4      gtable_0.3.0        purrr_0.3.4        
[61] tidyr_1.1.3         assertthat_0.2.1    cachem_1.0.5        mime_0.11           xtable_1.8-4        coda_0.19-4        
[67] later_1.2.0         tibble_3.1.3        memoise_2.0.0       ellipsis_0.3.2  

`phenomix`: Exploring more efficient methods for celltype enrichment

@NathanSkene @KittyMurphy @Al-Murphy

While I was waiting for the latest phenotype-celltype enrichment results to finish running on HPC, I starting exploring whether we could run phenotype-celltype association tests in a more efficient manner. This was implemented within my package phenomix.

Short answer: yes, I was able to run all HPO x Descartes celltype enrichment tests but orders of magnitude faster using only my laptop.

All code to run the tests and benchmarking can be found here. Will generate a proper HTML report with figures as well.

Approach

In this approach, I:

  1. use the GenCC evidence scores for each disease-gene link-
  2. merge that with the disease-phenotype-gene data in HPO
  3. construct a gene x phenotype matrix (filled with the GenCC scores)
  4. run regression on every combination of phenotype and celltype in the level 2 specificity matrix of the Descartes CTD (via phenomix::iterate_lm)
  5. apply multiple-testing correction

Fundamentally, the biggest differences between MultiEWCE and phenomix are:

  1. MultiEWCE treats it as a gene set enrichment problem, while phenomix treats it as a linear regression problem.
  2. MultiEWCE uses bootstrapping (100,000 iterations per phenotype-celltype test), while phenomix only needs to run one rep per phenotype-celltype test.

Speed

MultiEWCE:

  • N tests: 6916 phenotypes x 77 celltypes (532,532 tests)
  • Time: Completed overnight (don't have a precise estimate)
  • Resources: 6916 array subjobs with 4 cores (27,664 cores total) and 128Gb mem per subjob

phenomix:

  • N tests: 10,948 phenotypes x 77 celltypes (844,613 tests)
  • Time: 30.5 min
  • Resources: Local Macbook Pro, paralellised across 10 cores. Only ever used a small fraction of my 64Gb of memory.

Benchmarking.

  • I benchmarked these new results against Bobby's old MultiEWCE results. Will repeat once i finish the updated MultiEWCE tests using the fixed Descartes CTD (and the Human Cell Landscape CTD).
  • In the end, there is 96.66% concordance between the top most enriched celltype (the one with the highest fold-change after filtering by q<0.05 within the MultiEWCE results) between MultiEWCE and my new method (implemented in phenomix).
  • Will need to explore exactly how much the GenCC scores help these analyses. ie. does making the gene links binary degrade performance substantially? (1=associated with the disease/phenotype, 0=not).

Conclusion

This new method will still require more benchmarking to ensure it's robust, and I think for the sake of the rare disease celltyping paper we should stick to our original MultiEWCE approach (partly for the sake of not having to rewrite it..). But wanted to document this here to let us know we have a new approach in our back pocket.

Recommend Projects

  • React photo React

    A declarative, efficient, and flexible JavaScript library for building user interfaces.

  • Vue.js photo Vue.js

    🖖 Vue.js is a progressive, incrementally-adoptable JavaScript framework for building UI on the web.

  • Typescript photo Typescript

    TypeScript is a superset of JavaScript that compiles to clean JavaScript output.

  • TensorFlow photo TensorFlow

    An Open Source Machine Learning Framework for Everyone

  • Django photo Django

    The Web framework for perfectionists with deadlines.

  • D3 photo D3

    Bring data to life with SVG, Canvas and HTML. 📊📈🎉

Recommend Topics

  • javascript

    JavaScript (JS) is a lightweight interpreted programming language with first-class functions.

  • web

    Some thing interesting about web. New door for the world.

  • server

    A server is a program made to process requests and deliver data to clients.

  • Machine learning

    Machine learning is a way of modeling and interpreting data that allows a piece of software to respond intelligently.

  • Game

    Some thing interesting about game, make everyone happy.

Recommend Org

  • Facebook photo Facebook

    We are working to build community through open source technology. NB: members must have two-factor auth.

  • Microsoft photo Microsoft

    Open source projects and samples from Microsoft.

  • Google photo Google

    Google ❤️ Open Source for everyone.

  • D3 photo D3

    Data-Driven Documents codes.