Giter Site home page Giter Site logo

rtoolbox's Introduction

Rtoolbox

Toolbox with R scripts (mostly bioinformatic; see below).

Installation R-package:

After installing the required tools as described above you can download the pre-compiled Rtoolbox R-package. The package can be installed from the command line using the following command:

$ R CMD INSTALL Rtoolbox_*.tar.gz

Rtoolbox usage:

Load the Rtoolbox package in R using:

> library("Rtoolbox")

Rtoolbox contains the following functions:

replotGSEA

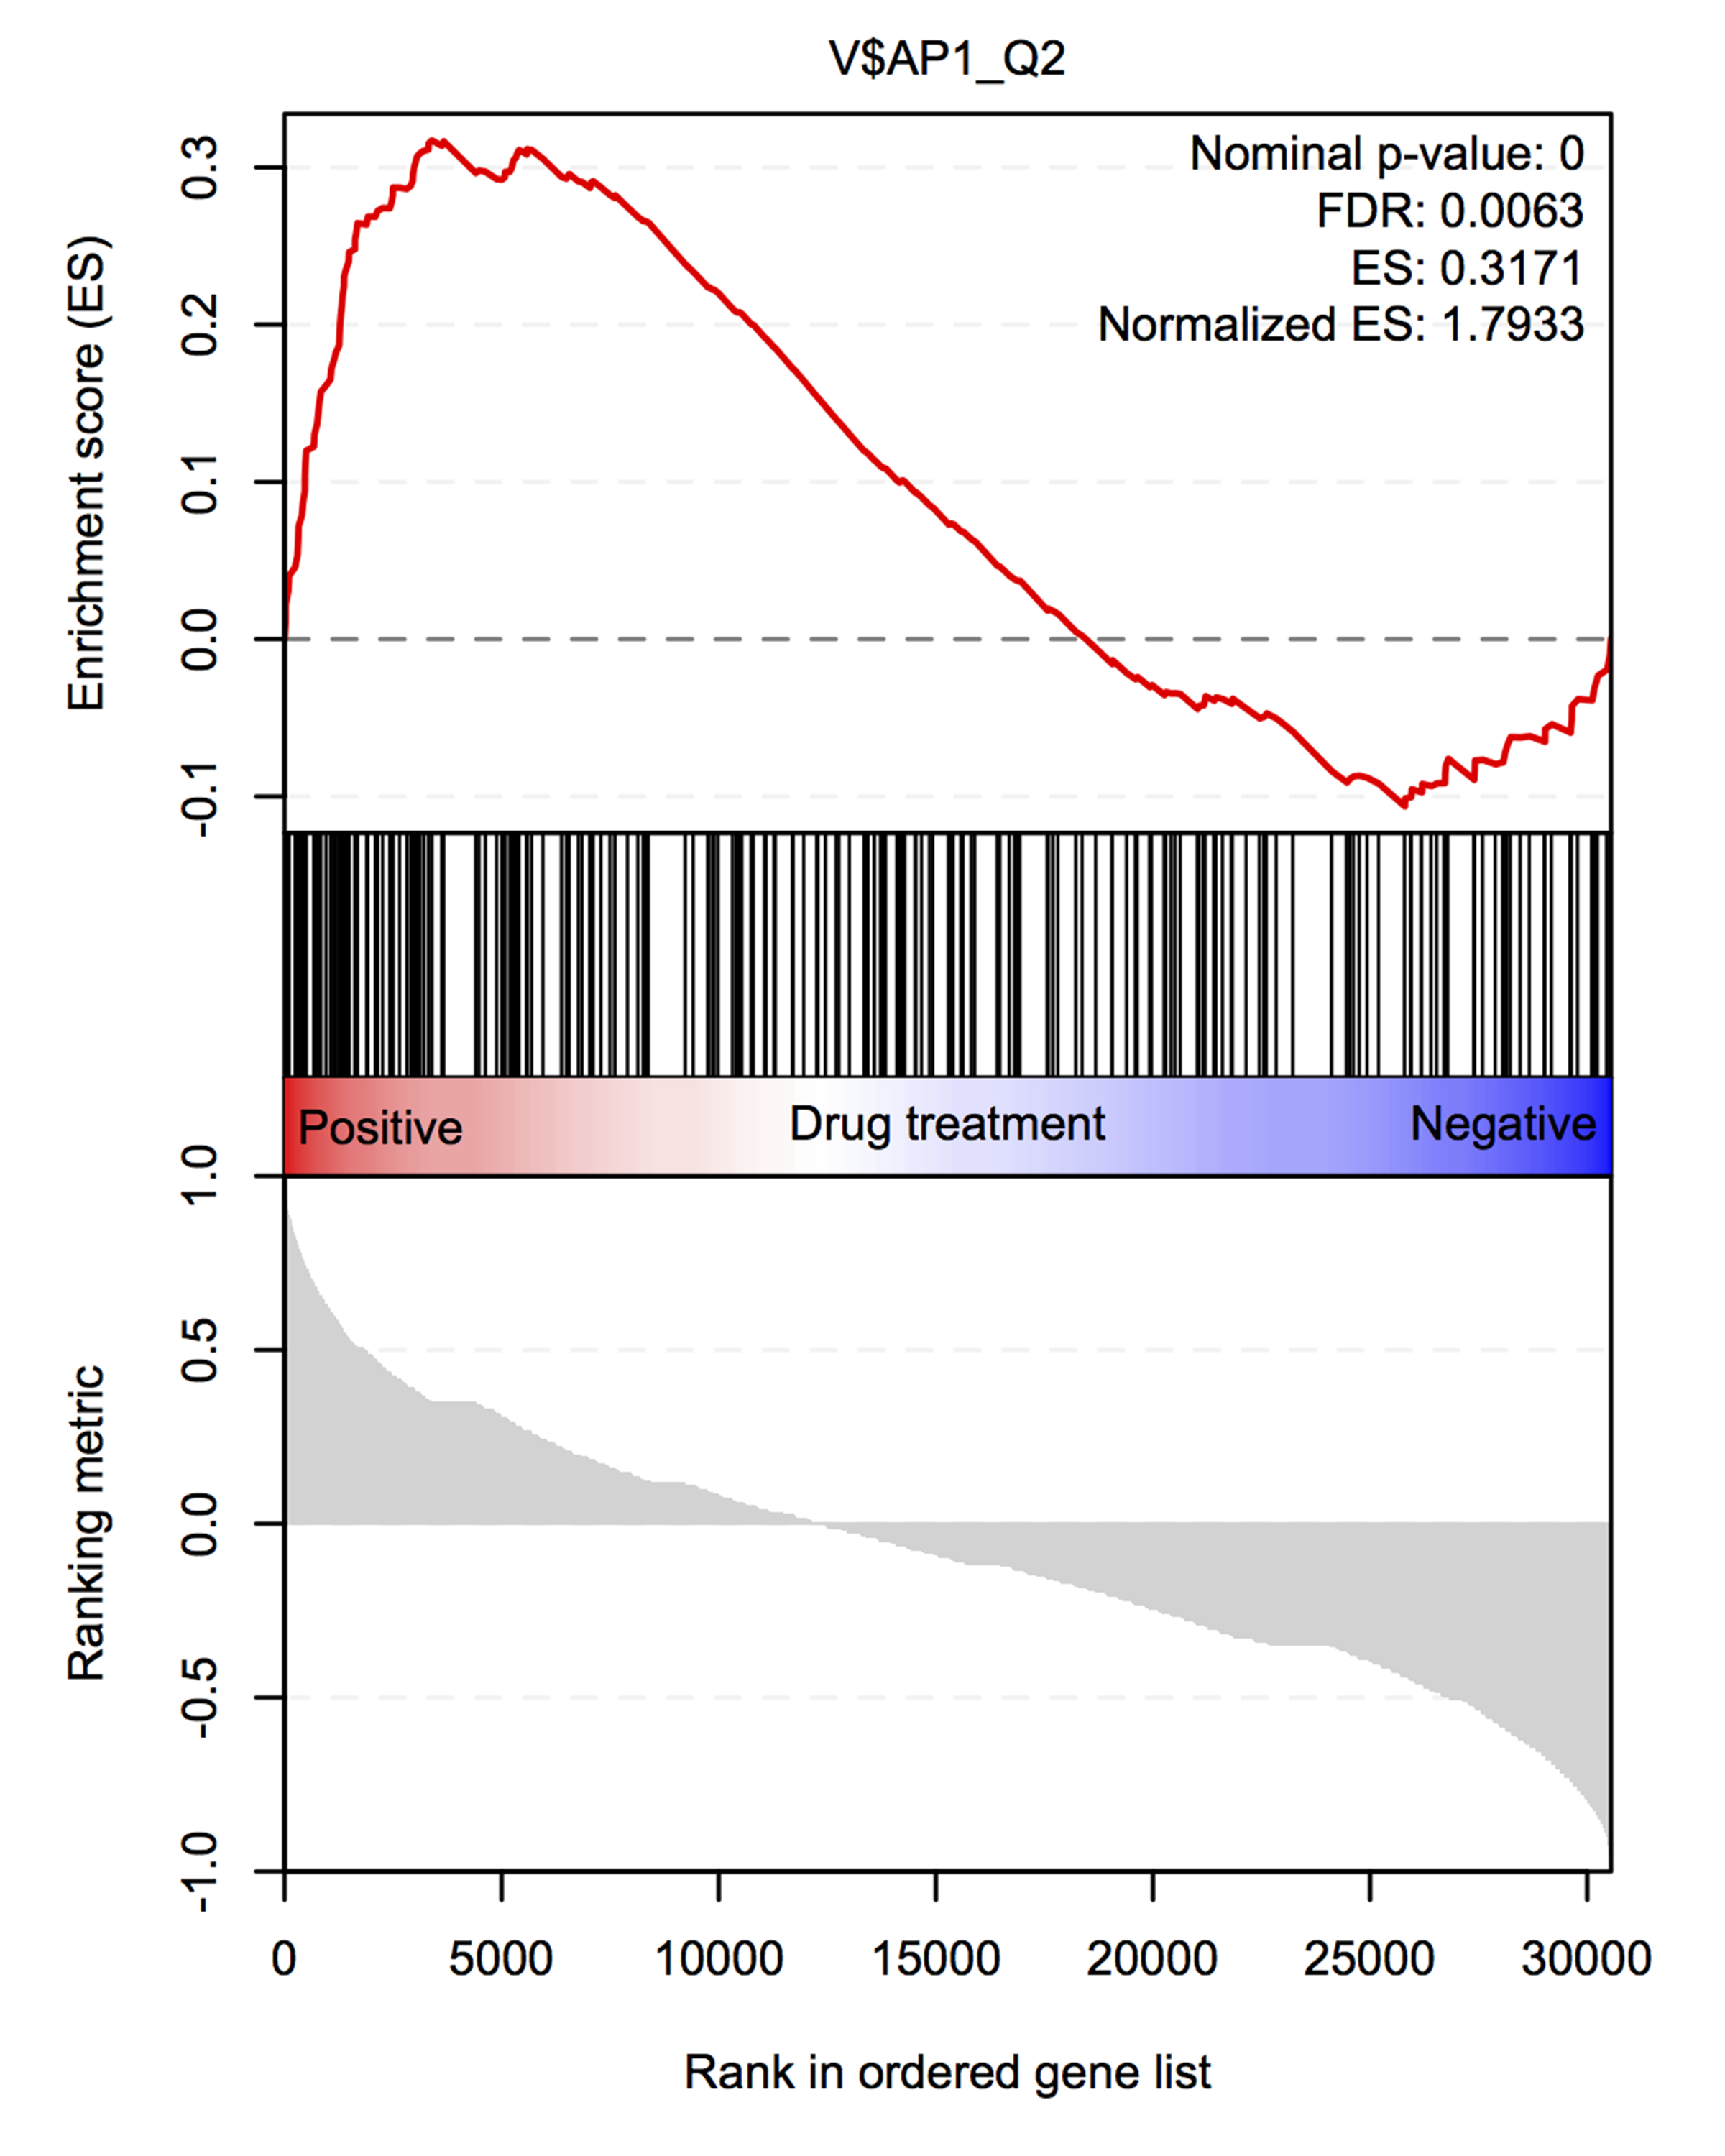
replotGSEA re-plots data from the javaGSEA desktop version in R. The function takes three arguments: path, the path to the javaGSEA output folder; gene.set, which is the name of the gene set you want to plot (note: approximate matching is used in a grep-function to determine the appropriate gene set); and class.name, which is the name of the variable to which gene expression has been matched (i.e., the description of the variable that is specified in the .cls file or that is used to pre-rank the data; example: "drug treatment").

Example replotGSEA

For the example of the output of replotGSEA, the following command was used:

replotGSEA(path = path, gene.set = gene.set, class.name = class.name)

replotGSEA

OverviewPlot

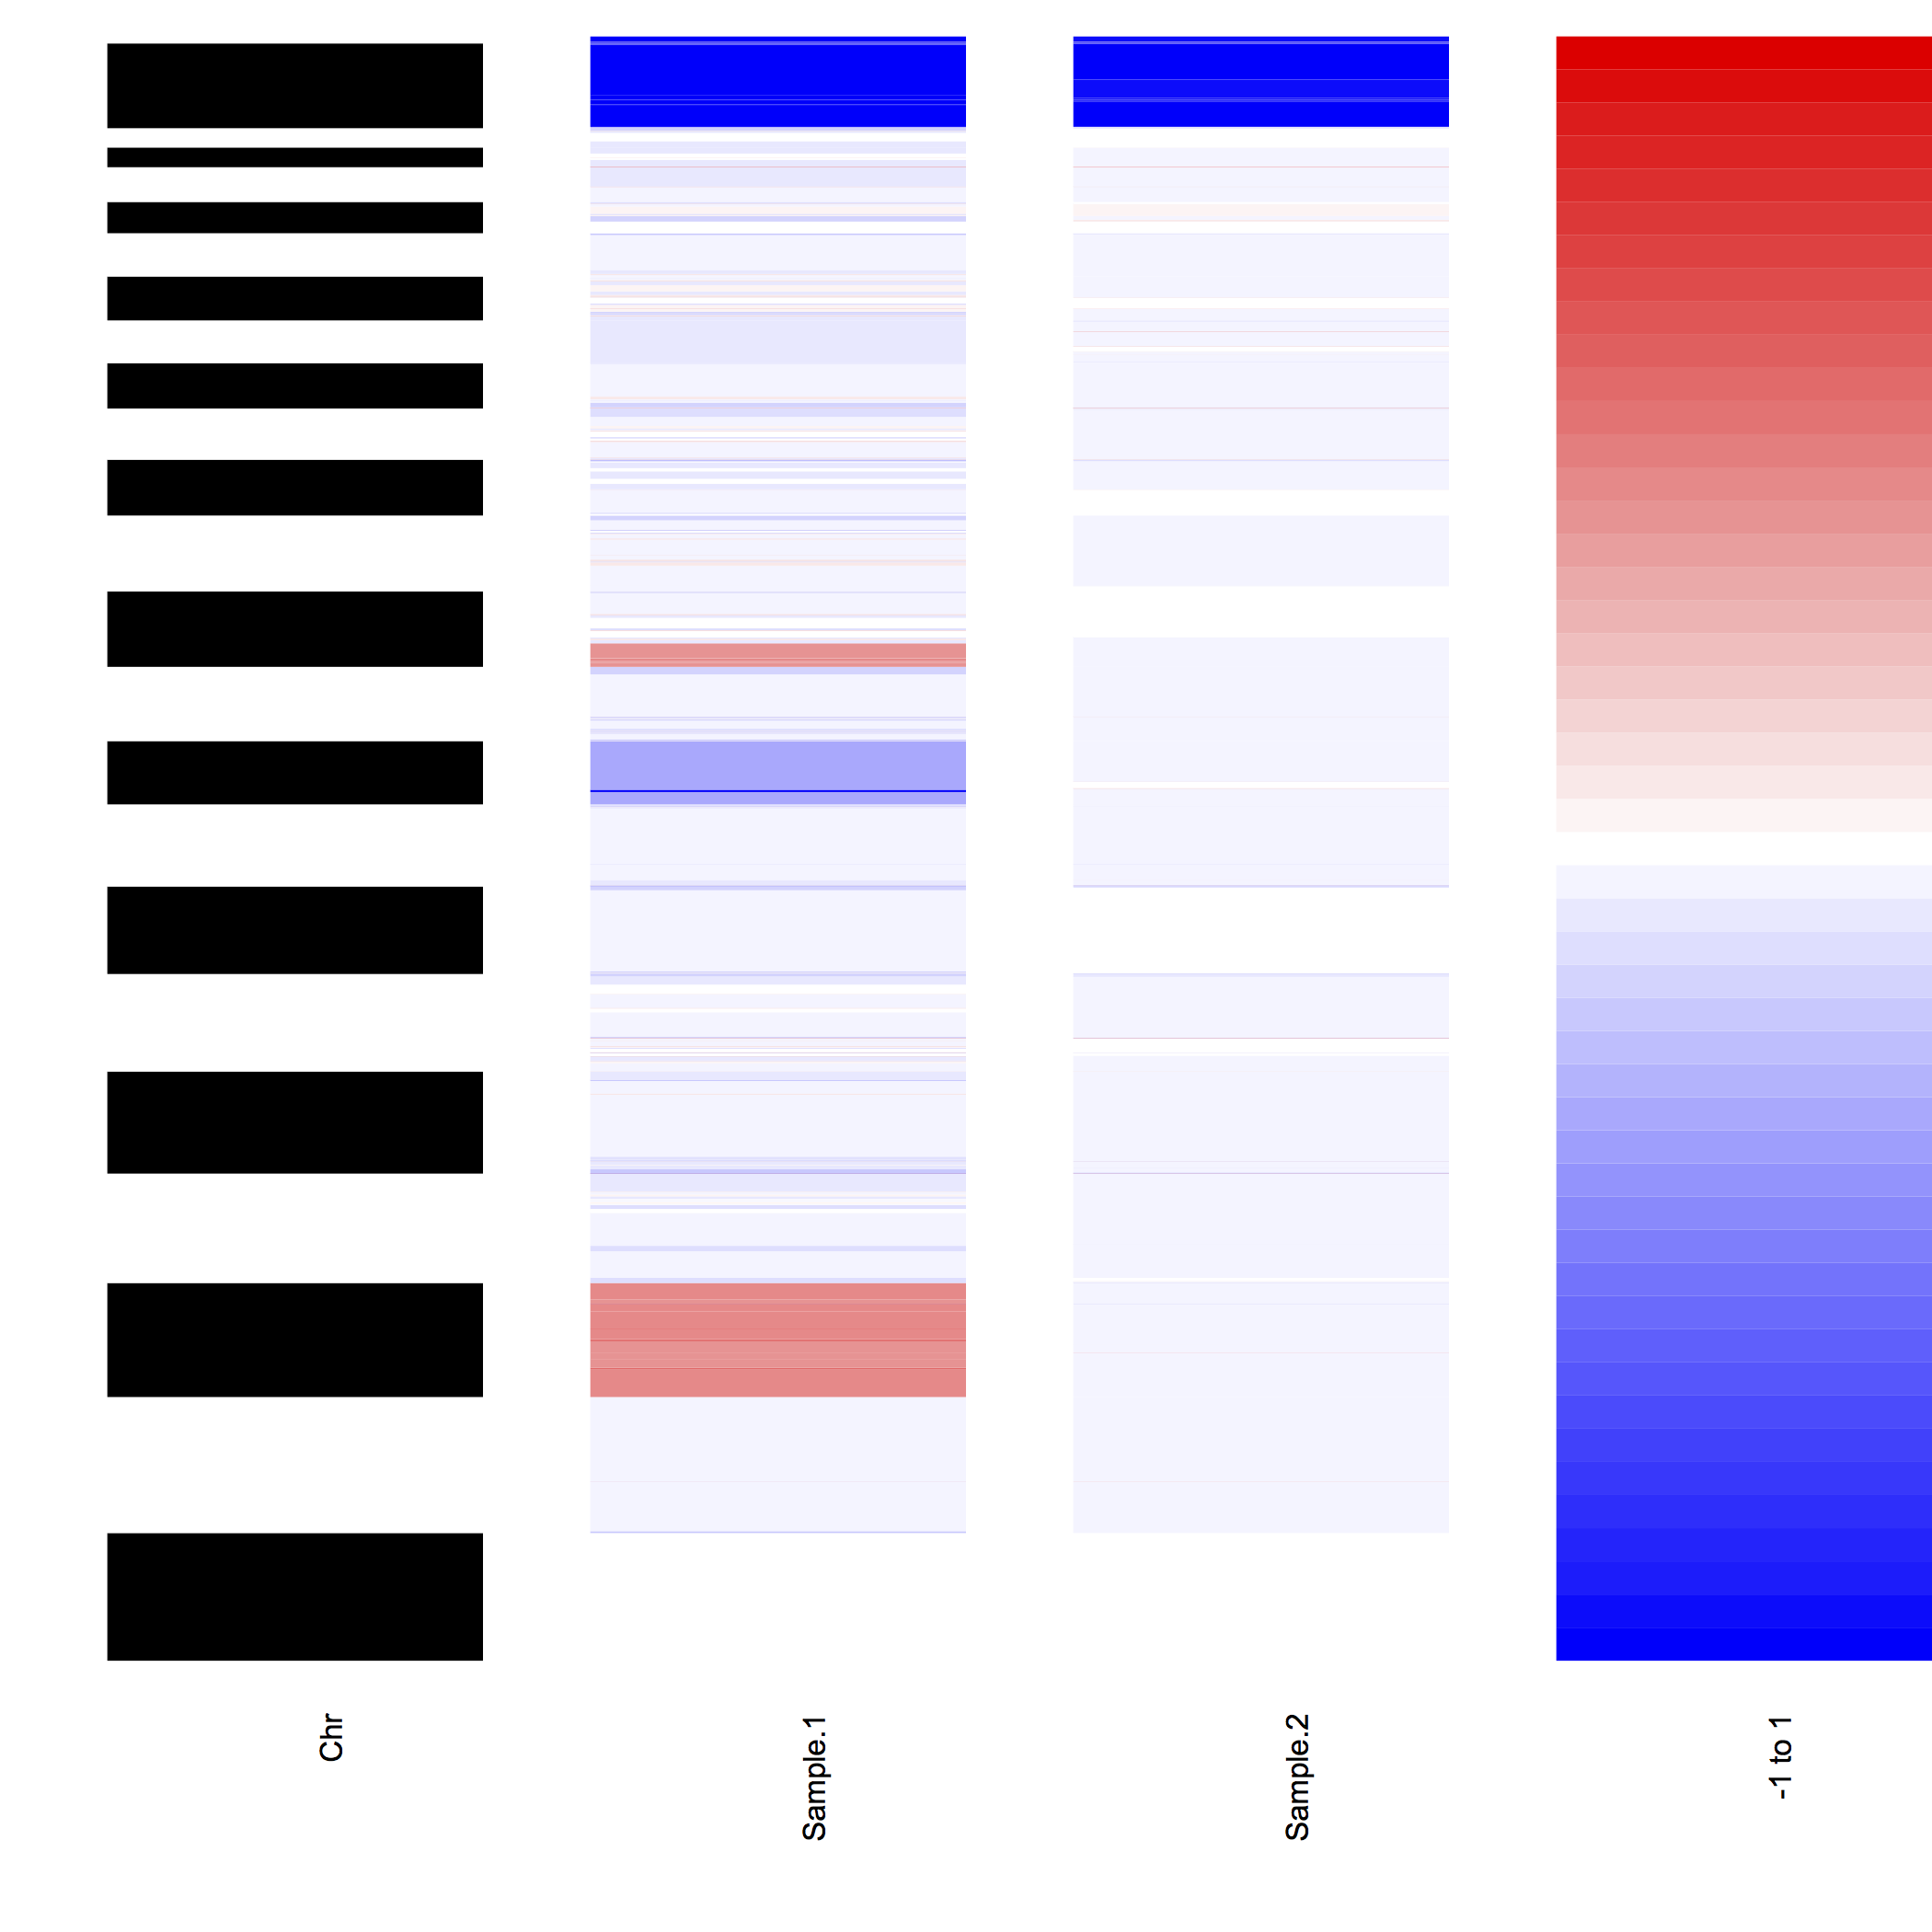
OverviewPlot will create color-based plots of segmentation values as found in the provided DNAcopy object. The heatmap plotting function has three optional arguments: samples, range.CNA, and color.palette. The samples argument can be used to specify which samples need to be included in the plotting. The range.CNA range specifies the range of values that will be plotted; segmentation values outside of this range are capped to either the minimum or the maximum of range.CNA. The color.palette argument can be used to customize the colors used for plotting.

Example OverviewPlot

For the example of the output of OverviewPlot, the following command was used:

OverviewPlot(DNAcopy.object, unique(DNAcopy.object$output$ID)[1:2], range.CNA = c(-1,1))

replotGSEA

rtoolbox's People

Contributors

peeperlab2 avatar

Stargazers

 avatar  avatar  avatar  avatar  avatar  avatar  avatar  avatar  avatar  avatar  avatar  avatar  avatar  avatar  avatar  avatar  avatar  avatar  avatar  avatar  avatar  avatar  avatar  avatar  avatar  avatar  avatar  avatar  avatar  avatar  avatar  avatar  avatar  avatar  avatar  avatar  avatar

Watchers

 avatar  avatar  avatar  avatar  avatar  avatar  avatar  avatar

rtoolbox's Issues

problem running Rtoolbox

Hi,
I used your script and I almost got what I want. However, the color bar (below the plot) only showed blue. Can you help? I attached the output from preranked GSEA ( I generated this using .rnk and .gmx file).

example.zip

heatmap is not centered

Hi, I've tried to use replotGSEA using my results. It's a very nice function but I found and issue I couldn't fix. The heatmap is not centered. I mean, in the original Java plot white is in the middle of the color scale, but in the plot of replotGSEA it is shifted sideways. Do you know why?

javaGSEA:
JavaGSEA

replotGSEA
replotGSEA

Error in file(file, "rt") : invalid 'description' argument.

Dear Peeper Lab,

I am trying to reproduce the GSEA file using your replotGSEA code in R. I run the GSEA using the desktop version, and the path directory has both the rnk file and the edb file. But the code cannot be executed. The error message returned:

"Error in file(file, "rt") : invalid 'description' argument."
Traceback:
4. file(file, "rt")
3. read.table(file = file, header = header, sep = sep, quote = quote, dec = dec, fill = fill, comment.char = comment.char, ...)
2. read.delim(file = path.rnk, header = FALSE)

  1. replotGSEA(path, gene.set = "GBM")

I appreciate if you could offer some suggestions.

Thank you,
Min

Export plot as pdf

Hi,

How can i export the plot as a pdf?

ggsave() of pdf() does not seem to work

thanks

Domien

In file(file, "rt") ERROR

Dear Peeper Lab,

I am trying to replot the GSEA result using your package.
However, I got the error message as follows:

I executed this code:
replotGSEA(path,
gene.set = this.set,
class.name = "geneA KO vs WT"
# metric.range,
# enrichment.score.range
)

Error in file(file, "rt") : cannot open the connection
In addition: Warning message:
In file(file, "rt") :
cannot open file 'path_to_GSEAresult/edb/XXX.rnk': No such file or directory

Actually, I can see the XXX.rnk and that file is not broken. Why is this happening ?

Here is my environment
R version 4.1.0 (2021-05-18)
Platform: x86_64-w64-mingw32/x64 (64-bit)

Thank you,
Yuta

Metric color display incorrect

Hello,
I have an issue of the metric color scale not displaying properly, even though my metric was in the range of (-33 to 64.) It displays correctly using the java gsea program. Would you mind checking my example?

I also had trouble saving the plot. I tried this:
geneset <- "BELTRAN_UP_29"
png(file=file.path(outputpath,paste(geneset,".png",sep="_")), width = 3300,height = 3300, res=300)
replotGSEA(path=datapath, gene.set=geneset, class.name="Bromedemstat")
dev.off()

I also tried the above with print(replotGSEA(path=datapath, gene.set=geneset, class.name="Bromedemstat")) but the plot only renders in the console. An example for saving to file would be much appreciated.

Thanks!
example2.zip

Recommend Projects

  • React photo React

    A declarative, efficient, and flexible JavaScript library for building user interfaces.

  • Vue.js photo Vue.js

    🖖 Vue.js is a progressive, incrementally-adoptable JavaScript framework for building UI on the web.

  • Typescript photo Typescript

    TypeScript is a superset of JavaScript that compiles to clean JavaScript output.

  • TensorFlow photo TensorFlow

    An Open Source Machine Learning Framework for Everyone

  • Django photo Django

    The Web framework for perfectionists with deadlines.

  • D3 photo D3

    Bring data to life with SVG, Canvas and HTML. 📊📈🎉

Recommend Topics

  • javascript

    JavaScript (JS) is a lightweight interpreted programming language with first-class functions.

  • web

    Some thing interesting about web. New door for the world.

  • server

    A server is a program made to process requests and deliver data to clients.

  • Machine learning

    Machine learning is a way of modeling and interpreting data that allows a piece of software to respond intelligently.

  • Game

    Some thing interesting about game, make everyone happy.

Recommend Org

  • Facebook photo Facebook

    We are working to build community through open source technology. NB: members must have two-factor auth.

  • Microsoft photo Microsoft

    Open source projects and samples from Microsoft.

  • Google photo Google

    Google ❤️ Open Source for everyone.

  • D3 photo D3

    Data-Driven Documents codes.