Giter Site home page Giter Site logo

sd2k / grafana-tokio-console-datasource Goto Github PK

View Code? Open in Web Editor NEW
125.0 72.0 4.0 1.38 MB

Tokio Console Datasource for Grafana

License: Apache License 2.0

JavaScript 0.54% Dockerfile 3.55% Rust 86.39% TypeScript 9.53%
grafana-plugin hacktoberfest rust tokio

grafana-tokio-console-datasource's Introduction

Grafana Tokio Console Data Source

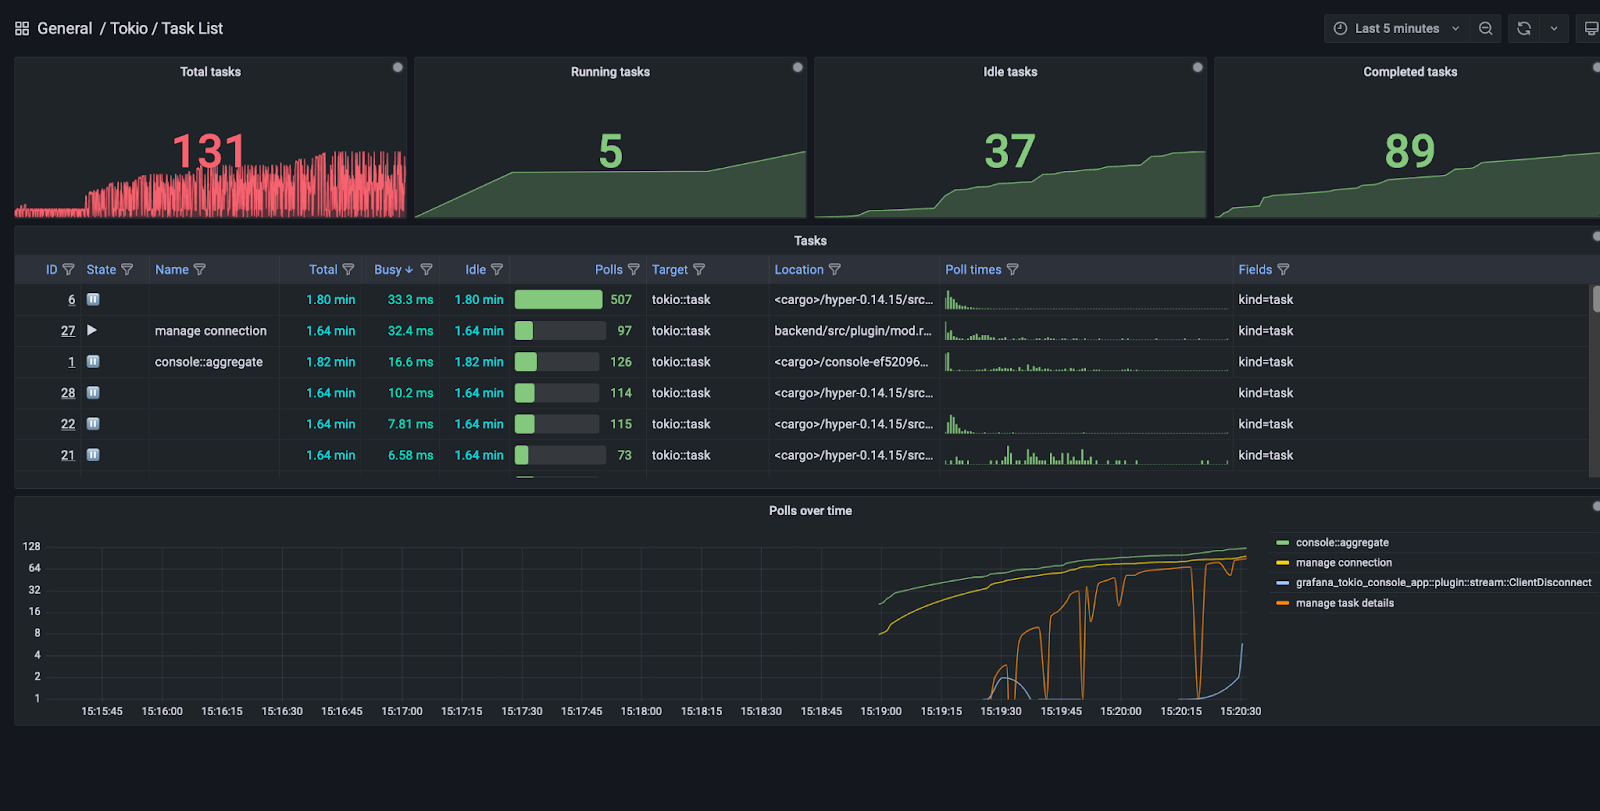
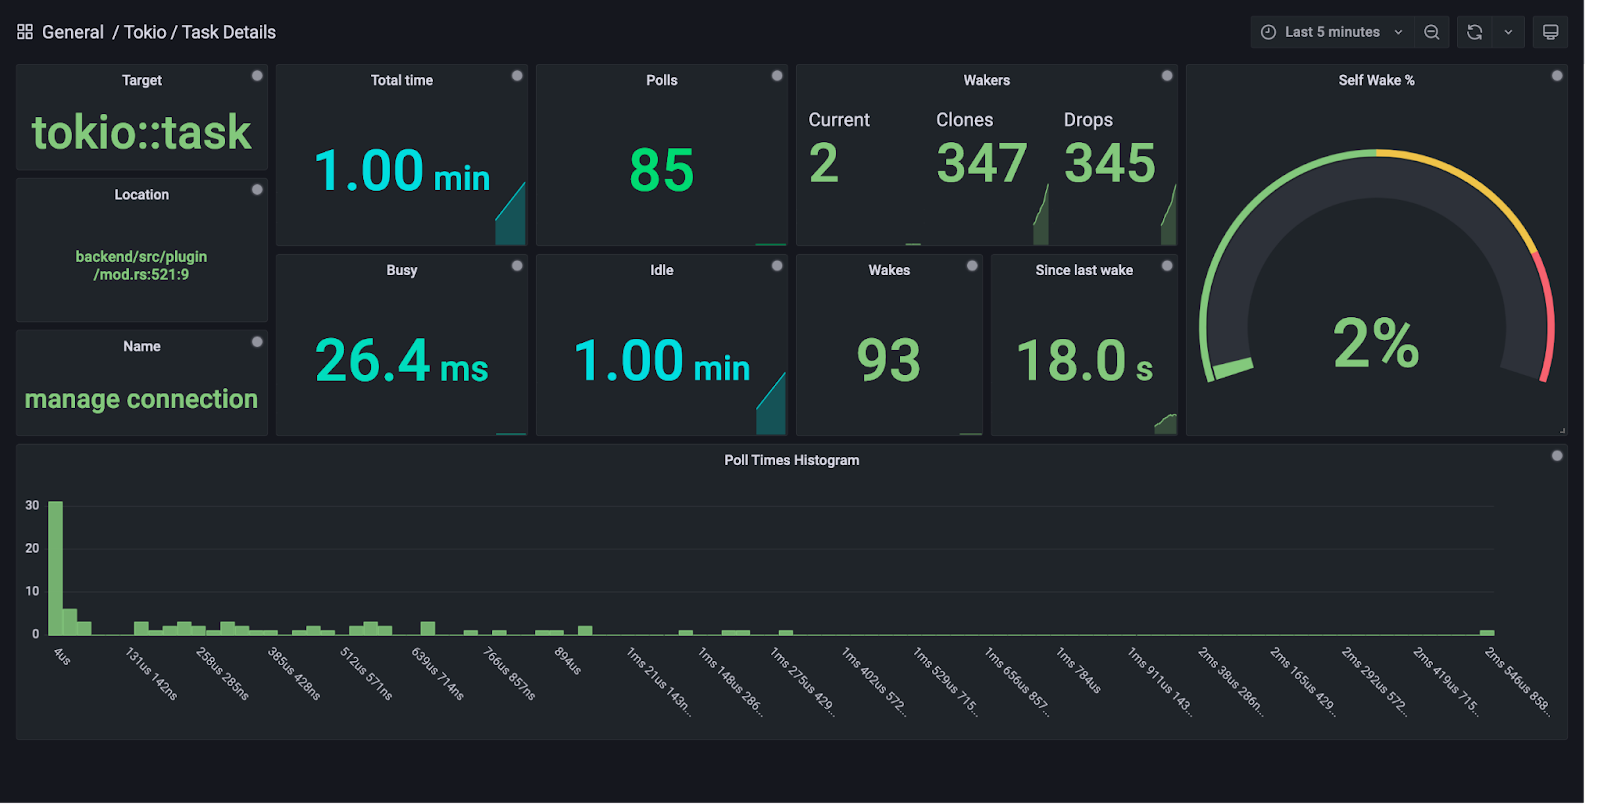
This is a streaming Grafana data source which can connect to the Tokio console subscriber. It provides similar functionality to the console TUI frontend (albeit more limited at the moment!).

Screenshots

image

image

Try it out

Docker

# On Linux or MacOS
docker run --rm -p 3000:3000 sd2k/grafana:with-tokio-console-datasource
# Or, on Linux, if you want to access console-enabled processes running on the host
docker run --rm --net=host sd2k/grafana:with-tokio-console-datasource

This will start a custom-built Grafana build serving on port 3000 with the Console datasource already installed.

Three datasources will already be configured:

  • Tokio Console - Grafana plugin - connects to the console-enabled Grafana plugin backend itself, as an example. Note that the plugin serves on localhost:6668.
  • Tokio Console - localhost:6669 - connects to a console-enabled process at localhost:6669, the default address
  • Tokio Console - host.docker.internal:6669 - connects to a console-enabled process at host.docker.internal:6669. On MacOS (and possibly Windows - untested) this lets the Grafana process running inside Docker communicate with processes running outside Docker using the special host.docker.internal address.

Installing the plugin on an existing Grafana instance

The plugin is available on the Grafana plugin marketplace so can be installed from there similarly to any other plugin.

Development

Plugin frontend

At the repository root:

  1. Install dependencies

    yarn install
  2. Build plugin in development mode or run in watch mode

    yarn dev

    or

    yarn watch
  3. Build plugin in production mode

    yarn build

Plugin backend

Make sure you have a recent version of Rust (run rustup update stable), and install cargo-watch.

Then run:

cargo xtask watch

This will run the watch task using the cargo-xtask pattern, which rebuilds the backend component on changes, copies the binary into the correct location, and restarts the plugin process (which Grafana subsequently restarts).

Running Grafana

You'll need to clone a fork Grafana and run a specific branch to get some nice extra things working (namely the poll time histograms inside the main task list table):

  1. Clone Grafana

    git clone [email protected]/sd2k/grafana
  2. Check out the custom branch

    git checkout table-charts
  3. Build the frontend

    yarn && yarn dev

    or, to watch for changes

    yarn && yarn watch
  4. Change some config - make sure to change the 'plugins' path to the parent directory of this repo.

    cat <<EOF > conf/custom.ini
    app_mode = development
    [log]
    level = debug
    
    [paths]
    plugins = /Users/ben/repos/grafana-plugins  # or wherever you cloned this repo
    
    [plugins]
    plugin_admin_enabled = true
  5. Run the Grafana backend

    make run
  6. Add a Tokio Console datasource

    In your browser, navigate to http://localhost:3000/datasources/new, find the 'Tokio Console' datasource, and add a new instance Using the placeholder value of http://127.0.0.1:6669 should work; this datasource instance will connect to the plugin backend process itself, which is serving the console subscriber service.

    You can then head to the datasource's Dashboards tab and import the provided dashboards.

Cross compiling

From MacOS

  1. Install the relevant cross compiler toolchains. Using Homebrew:

    brew tap messense/macos-cross-toolchains
    brew install armv7-unknown-linux-musleabihf
    brew install aarch64-unknown-linux-musl
    brew install x86_64-unknown-linux-musl
    brew install mingw-w64
  2. Install the relevant Rust targets. Using rustup:

    rustup target add armv7-unknown-linux-musleabihf
    rustup target add aarch64-apple-darwin
    rustup target add x86_64-apple-darwin
    rustup target add aarch64-unknown-linux-musl
    rustup target add x86_64-unknown-linux-musl
    rustup target add x86_64-pc-windows-gnu
  3. Run the following to compile the plugin in release mode for each target:

    CARGO_TARGET_ARMV7_UNKNOWN_LINUX_MUSLEABIHF_LINKER=armv7-unknown-linux-musleabihf-ld cargo build --release --target armv7-unknown-linux-musleabihf
    cargo build --release --target aarch64-apple-darwin
    cargo build --release --target x86_64-apple-darwin
    CARGO_TARGET_AARCH64_UNKNOWN_LINUX_GNU_LINKER=aarch64-unknown-linux-gnu-gcc cargo build --release --target aarch64-unknown-linux-gnu
    CARGO_TARGET_AARCH64_UNKNOWN_LINUX_MUSL_LINKER=aarch64-unknown-linux-musl-gcc cargo build --release --target aarch64-unknown-linux-musl
    CARGO_TARGET_X86_64_PC_WINDOWS_GNU_LINKER=x86_64-w64-mingw32-gcc cargo build --release --target x86_64-pc-windows-gnu

grafana-tokio-console-datasource's People

Contributors

dependabot[bot] avatar sd2k avatar

Stargazers

 avatar  avatar  avatar  avatar  avatar  avatar  avatar  avatar  avatar  avatar  avatar  avatar  avatar  avatar  avatar  avatar  avatar  avatar  avatar  avatar  avatar  avatar  avatar  avatar  avatar  avatar  avatar  avatar  avatar  avatar  avatar  avatar  avatar  avatar  avatar  avatar  avatar  avatar  avatar  avatar  avatar  avatar  avatar  avatar  avatar  avatar  avatar  avatar  avatar  avatar  avatar  avatar  avatar  avatar  avatar  avatar  avatar  avatar  avatar  avatar  avatar  avatar  avatar  avatar  avatar  avatar  avatar  avatar  avatar  avatar  avatar  avatar  avatar  avatar  avatar  avatar  avatar  avatar  avatar  avatar  avatar  avatar  avatar  avatar  avatar  avatar  avatar  avatar  avatar  avatar  avatar  avatar  avatar  avatar  avatar  avatar  avatar  avatar  avatar  avatar

Watchers

 avatar  avatar  avatar  avatar  avatar  avatar  avatar  avatar  avatar  avatar  avatar  avatar  avatar  avatar  avatar  avatar  avatar  avatar  avatar  avatar  avatar  avatar  avatar  avatar  avatar  avatar  avatar  avatar  avatar  avatar  avatar  avatar  avatar  avatar  avatar  avatar  avatar  avatar  avatar  avatar  avatar  avatar  avatar  avatar  avatar  avatar  avatar  avatar  avatar  avatar  avatar  avatar  avatar  avatar  avatar  avatar  avatar  avatar  avatar  avatar  avatar  avatar  avatar  avatar  avatar  avatar  avatar  avatar  avatar  avatar  avatar  avatar

grafana-tokio-console-datasource's Issues

Add Task List dashboard to plugin

The frontend side of the plugin is currently structured like this:

src
├── AppConfig.tsx
├── dashboards
│   └── overview.json
├── datasource-tokio-console
│   ├── ConfigEditor.tsx
│   ├── QueryEditor.tsx
│   ├── datasource.ts
│   ├── img
│   │   ├── logo.jpg
│   │   └── logo.svg
│   ├── module.ts
│   ├── plugin.json
│   └── types.ts
├── img
│   ├── logo.jpg
│   └── logo.svg
├── module.ts
├── plugin.json
└── types.ts

where the data source plugin is inside the datasource-tokio-console directory, and the 'root' plugin has "type": "app" and 'includes' a placeholder dashboard in src/dashboards/overview.json. This doesn't actually seem to work right now, but I do have a Tokio / Task List dashboard I created manually in Grafana which should be added here and fixed up.

Cannot find release

I am unable to find a release on the plugin website. Are you sure it is there?

Plugin sometimes panics when subtracting durations

Backtrace:

DBUG[12-03|13:11:09] thread 'grafana-plugin-worker-thread' panicked at 'overflow when subtracting durations', library/core/src/time.rs:987:31 logger=plugin.initializer pluginID=grafana-tokio-console-datasource
DBUG[12-03|13:11:09] stack backtrace:                         logger=plugin.initializer pluginID=grafana-tokio-console-datasource
DBUG[12-03|13:11:09]    0: rust_begin_unwind                  logger=plugin.initializer pluginID=grafana-tokio-console-datasource
DBUG[12-03|13:11:09]              at /rustc/f1edd0429582dd29cccacaf50fd134b05593bd9c/library/std/src/panicking.rs:517:5 logger=plugin.initializer pluginID=grafana-tokio-console-datasource
DBUG[12-03|13:11:09]    1: core::panicking::panic_fmt         logger=plugin.initializer pluginID=grafana-tokio-console-datasource
DBUG[12-03|13:11:09]              at /rustc/f1edd0429582dd29cccacaf50fd134b05593bd9c/library/core/src/panicking.rs:100:14 logger=plugin.initializer pluginID=grafana-tokio-console-datasource
DBUG[12-03|13:11:09]    2: core::panicking::panic_display     logger=plugin.initializer pluginID=grafana-tokio-console-datasource
DBUG[12-03|13:11:09]              at /rustc/f1edd0429582dd29cccacaf50fd134b05593bd9c/library/core/src/panicking.rs:64:5 logger=plugin.initializer pluginID=grafana-tokio-console-datasource
DBUG[12-03|13:11:09]    3: core::option::expect_failed        logger=plugin.initializer pluginID=grafana-tokio-console-datasource
DBUG[12-03|13:11:09]              at /rustc/f1edd0429582dd29cccacaf50fd134b05593bd9c/library/core/src/option.rs:1638:5 logger=plugin.initializer pluginID=grafana-tokio-console-datasource
DBUG[12-03|13:11:09]    4: core::option::Option<T>::expect    logger=plugin.initializer pluginID=grafana-tokio-console-datasource
DBUG[12-03|13:11:09]              at /rustc/f1edd0429582dd29cccacaf50fd134b05593bd9c/library/core/src/option.rs:709:21 logger=plugin.initializer pluginID=grafana-tokio-console-datasource
DBUG[12-03|13:11:09]    5: <core::time::Duration as core::ops::arith::Sub>::sub logger=plugin.initializer pluginID=grafana-tokio-console-datasource
DBUG[12-03|13:11:09]              at /rustc/f1edd0429582dd29cccacaf50fd134b05593bd9c/library/core/src/time.rs:987:9 logger=plugin.initializer pluginID=grafana-tokio-console-datasource
DBUG[12-03|13:11:09]    6: grafana_tokio_console_datasource::task::Task::idle logger=plugin.initializer pluginID=grafana-tokio-console-datasource
DBUG[12-03|13:11:09]    7: grafana_tokio_console_datasource::plugin::DatasourceState::get_tasks_frame logger=plugin.initializer pluginID=grafana-tokio-console-datasource
DBUG[12-03|13:11:09]    8: <core::future::from_generator::GenFuture<T> as core::future::future::Future>::poll logger=plugin.initializer pluginID=grafana-tokio-console-datasource
DBUG[12-03|13:11:09]    9: <core::future::from_generator::GenFuture<T> as core::future::future::Future>::poll logger=plugin.initializer pluginID=grafana-tokio-console-datasource
DBUG[12-03|13:11:09]   10: <tracing::instrument::Instrumented<T> as core::future::future::Future>::poll logger=plugin.initializer pluginID=grafana-tokio-console-datasource
DBUG[12-03|13:11:09]   11: <core::future::from_generator::GenFuture<T> as core::future::future::Future>::poll logger=plugin.initializer pluginID=grafana-tokio-console-datasource
DBUG[12-03|13:11:09]   12: <core::future::from_generator::GenFuture<T> as core::future::future::Future>::poll logger=plugin.initializer pluginID=grafana-tokio-console-datasource
DBUG[12-03|13:11:09]   13: <core::future::from_generator::GenFuture<T> as core::future::future::Future>::poll logger=plugin.initializer pluginID=grafana-tokio-console-datasource
DBUG[12-03|13:11:09]   14: <tower::util::either::Either<A,B> as core::future::future::Future>::poll logger=plugin.initializer pluginID=grafana-tokio-console-datasource
DBUG[12-03|13:11:09]   15: <futures_util::future::future::map::Map<Fut,F> as core::future::future::Future>::poll logger=plugin.initializer pluginID=grafana-tokio-console-datasource
DBUG[12-03|13:11:09]   16: <tower::util::either::Either<A,B> as core::future::future::Future>::poll logger=plugin.initializer pluginID=grafana-tokio-console-datasource
DBUG[12-03|13:11:09]   17: <tonic::transport::server::recover_error::ResponseFuture<F> as core::future::future::Future>::poll logger=plugin.initializer pluginID=grafana-tokio-console-datasource
DBUG[12-03|13:11:09]   18: <tonic::transport::server::SvcFuture<F> as core::future::future::Future>::poll logger=plugin.initializer pluginID=grafana-tokio-console-datasource
DBUG[12-03|13:11:09]   19: <hyper::proto::h2::server::H2Stream<F,B> as core::future::future::Future>::poll logger=plugin.initializer pluginID=grafana-tokio-console-datasource
DBUG[12-03|13:11:09]   20: <tracing::instrument::Instrumented<T> as core::future::future::Future>::poll logger=plugin.initializer pluginID=grafana-tokio-console-datasource
DBUG[12-03|13:11:09]   21: tokio::runtime::task::harness::Harness<T,S>::poll logger=plugin.initializer pluginID=grafana-tokio-console-datasource
DBUG[12-03|13:11:09]   22: std::thread::local::LocalKey<T>::with logger=plugin.initializer pluginID=grafana-tokio-console-datasource
DBUG[12-03|13:11:09]   23: tokio::runtime::thread_pool::worker::Context::run_task logger=plugin.initializer pluginID=grafana-tokio-console-datasource
DBUG[12-03|13:11:09]   24: tokio::runtime::thread_pool::worker::Context::run logger=plugin.initializer pluginID=grafana-tokio-console-datasource
DBUG[12-03|13:11:09]   25: tokio::macros::scoped_tls::ScopedKey<T>::set logger=plugin.initializer pluginID=grafana-tokio-console-datasource
DBUG[12-03|13:11:09]   26: tokio::runtime::thread_pool::worker::run logger=plugin.initializer pluginID=grafana-tokio-console-datasource
DBUG[12-03|13:11:09]   27: <tracing::instrument::Instrumented<T> as core::future::future::Future>::poll logger=plugin.initializer pluginID=grafana-tokio-console-datasource
DBUG[12-03|13:11:09]   28: tokio::runtime::task::harness::Harness<T,S>::poll logger=plugin.initializer pluginID=grafana-tokio-console-datasource
DBUG[12-03|13:11:09]   29: tokio::runtime::blocking::pool::Inner::run logger=plugin.initializer pluginID=grafana-tokio-console-datasource
DBUG[12-03|13:11:09] note: Some details are omitted, run with `RUST_BACKTRACE=full` for a verbose backtrace. logger=plugin.initializer pluginID=grafana-tokio-console-datasource

Add Task Details dashboard

The Task Details dashboard should reproduce this view in the TUI:

image

This will require us to handle a new stream path, which will look something like /ds/<uid>/task/<task ID>.

'Polls over time' graph should be a rate, not a total

The polls over time graph currently just shows the latest value of the 'polls' field, which is effectively a counter, so it just increases forever. It would be much more useful to see a polls/second rate over the last 5 minutes or something similar. I'm not sure if this is possible in the Grafana transformations, so we might need to do it in the backend.

Add task details stream

Required for #2.

The task details come from two places:

  • the WatchUpdates stream, which we already subscribe to
  • the WatchTaskDetails stream, which we should also be subscribed to after the first update of WatchUpdates

The new stream should return a frame containing anything we need to produce the dashboard in #2.

Shift more logic to the plugin backend

The Tasks List dashboard currently just subscribes to the /tasks stream for every panel, and does any required aggregations in transforms, even if it just needs to display a single number. It would be more efficient to have separate streams for things like task counts, rather than requiring the frontend to do complex group bys and filtering.

Recommend Projects

  • React photo React

    A declarative, efficient, and flexible JavaScript library for building user interfaces.

  • Vue.js photo Vue.js

    🖖 Vue.js is a progressive, incrementally-adoptable JavaScript framework for building UI on the web.

  • Typescript photo Typescript

    TypeScript is a superset of JavaScript that compiles to clean JavaScript output.

  • TensorFlow photo TensorFlow

    An Open Source Machine Learning Framework for Everyone

  • Django photo Django

    The Web framework for perfectionists with deadlines.

  • D3 photo D3

    Bring data to life with SVG, Canvas and HTML. 📊📈🎉

Recommend Topics

  • javascript

    JavaScript (JS) is a lightweight interpreted programming language with first-class functions.

  • web

    Some thing interesting about web. New door for the world.

  • server

    A server is a program made to process requests and deliver data to clients.

  • Machine learning

    Machine learning is a way of modeling and interpreting data that allows a piece of software to respond intelligently.

  • Game

    Some thing interesting about game, make everyone happy.

Recommend Org

  • Facebook photo Facebook

    We are working to build community through open source technology. NB: members must have two-factor auth.

  • Microsoft photo Microsoft

    Open source projects and samples from Microsoft.

  • Google photo Google

    Google ❤️ Open Source for everyone.

  • D3 photo D3

    Data-Driven Documents codes.