Giter Site home page Giter Site logo

sebkrantz / collapse Goto Github PK

View Code? Open in Web Editor NEW
598.0 10.0 29.0 97.94 MB

Advanced and Fast Data Transformation in R

Home Page: https://sebkrantz.github.io/collapse/

License: Other

R 36.54% C++ 22.63% C 40.79% CSS 0.04%
r cran rstats statistics data-science scientific-computing time-series panel-data weights weighted

collapse's Introduction

collapse

R-CMD-check collapse status badge CRAN status cran checks downloads per month downloads Conda Version Conda Downloads Codecov test coverage minimal R version status DOI arXiv

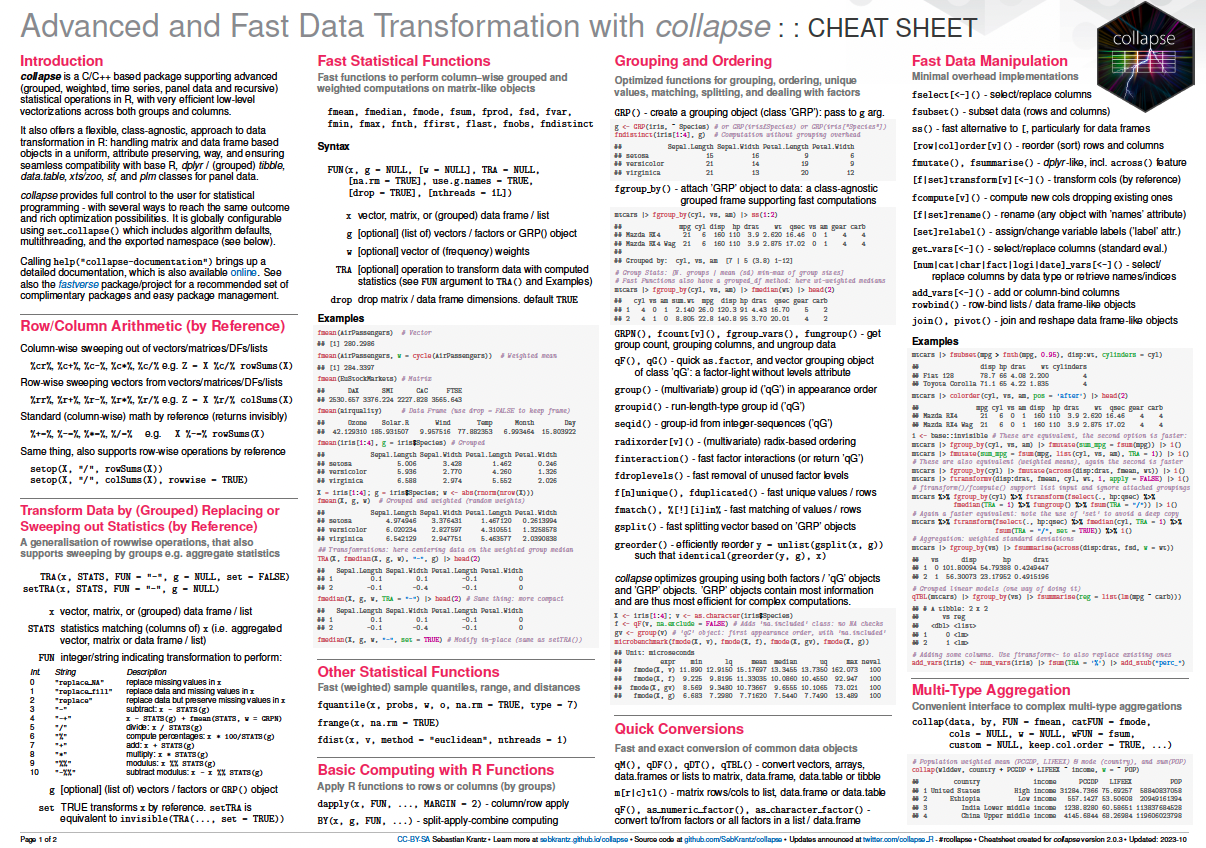
collapse is a C/C++ based package for data transformation and statistical computing in R. Its aims are:

  • To facilitate complex data transformation, exploration and computing tasks in R.
  • To help make R code fast, flexible, parsimonious and programmer friendly.

It further implements a class-agnostic approach to R programming, supporting base R, tibble, grouped_df (tidyverse), data.table, sf, pseries, pdata.frame (plm), and preserving many others (e.g. units, xts/zoo, tsibble).

Key Features:

  • Advanced statistical programming: A full set of fast statistical functions supporting grouped and weighted computations on vectors, matrices and data frames. Fast and programmable grouping, ordering, matching, unique values/rows, factor generation and interactions.

  • Fast data manipulation: Fast and flexible functions for data manipulation, data object conversions, and memory efficient R programming.

  • Advanced aggregation: Fast and easy multi-data-type, multi-function, weighted and parallelized data aggregation.

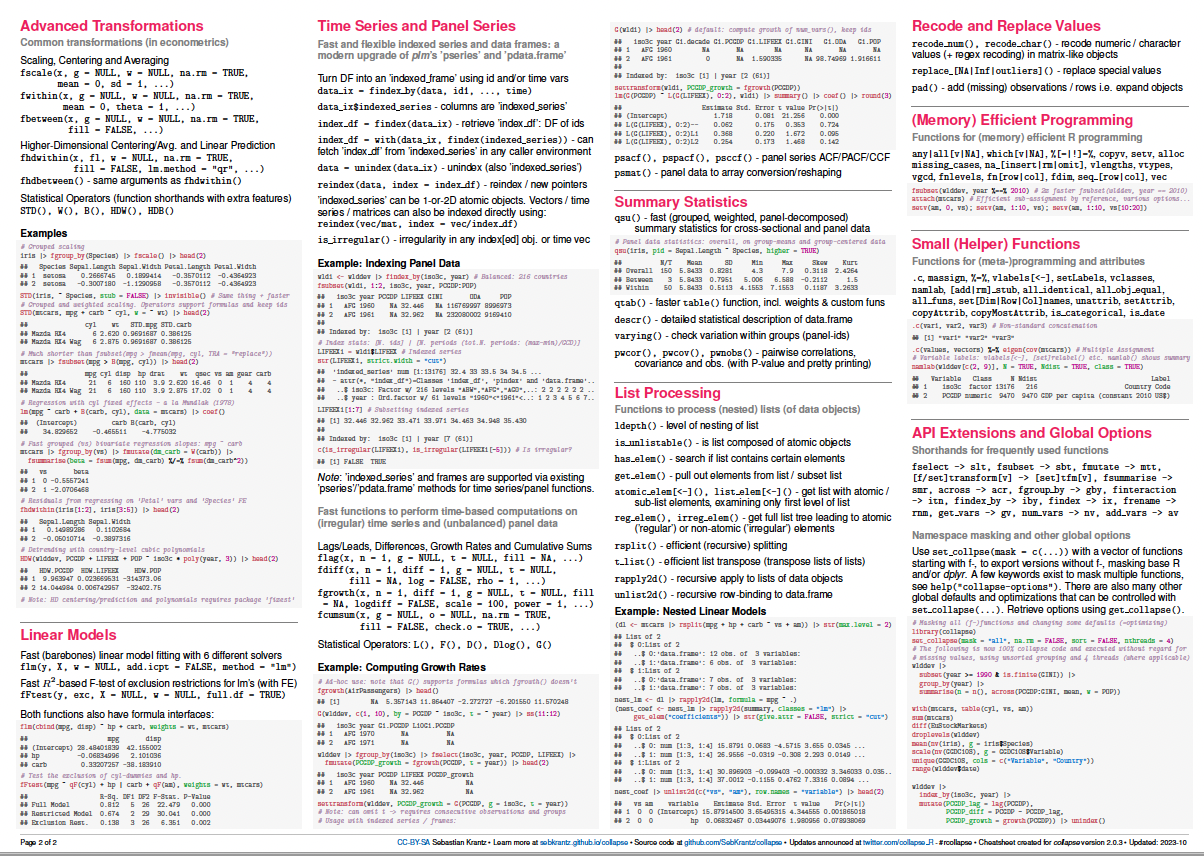
  • Advanced transformations: Fast row/column arithmetic, (grouped) replacing and sweeping out of statistics (by reference), (grouped, weighted) scaling/standardizing, (higher-dimensional) between (averaging) and (quasi-)within (demeaning) transformations.

  • Advanced time-computations: Fast and flexible indexed time series and panel data classes, (sequences of) lags/leads, and (lagged/leaded, iterated, quasi-, log-) differences and (compounded) growth rates on (irregular) time series and panels. Multivariate auto-, partial- and cross-correlation functions for panel data. Panel data to (ts-)array conversions.

  • List processing: Recursive list search, splitting, extraction/subsetting, apply, and generalized row-binding / unlisting to data frame.

  • Advanced data exploration: Fast (grouped, weighted, panel-decomposed) summary statistics and descriptive tools.

collapse is written in C and C++ and only depends on Rcpp. Its algorithms are multiple times faster than base R's, scale well to <= 1 billion obs, and very efficient for complex tasks (e.g. quantiles, weighted stats, mode/counting/deduplication, joins). Optimized R code ensures minimal overheads and fast syntax evaluation.

Installation

# Install the current version on CRAN
install.packages("collapse")

# Install a stable development version (Windows/Mac binaries) from R-universe
install.packages("collapse", repos = "https://fastverse.r-universe.dev")

# Install a stable development version from GitHub (requires compilation)
remotes::install_github("SebKrantz/collapse")

# Install previous versions from the CRAN Archive (requires compilation)
install.packages("https://cran.r-project.org/src/contrib/Archive/collapse/collapse_1.9.6.tar.gz", 
                 repos = NULL, type = "source") 
# Older stable versions: 1.8.9, 1.7.6, 1.6.5, 1.5.3, 1.4.2, 1.3.2, 1.2.1

Documentation

collapse installs with a built-in structured documentation, implemented via a set of separate help pages. Calling help('collapse-documentation') brings up the the top-level documentation page, providing an overview of the entire package and links to all other documentation pages.

In addition there are several vignettes, among them one on Documentation and Resources.

Cheatsheet

Article on arXiv

An article on collapse has been submitted to the Journal of Statistical Software in March 2024.

Presentation at useR 2022

Video Recording | Slides

Example Usage

This provides a simple set of examples introducing some important features of collapse. It should be easy to follow for readers familiar with R.

Click here to expand
library(collapse)
data("iris")            # iris dataset in base R
v <- iris$Sepal.Length  # Vector
d <- num_vars(iris)     # Saving numeric variables (could also be a matrix, statistical functions are S3 generic)
g <- iris$Species       # Grouping variable (could also be a list of variables)

## Advanced Statistical Programming -----------------------------------------------------------------------------

# Simple (column-wise) statistics...
fmedian(v)                       # Vector
fsd(qM(d))                       # Matrix (qM is a faster as.matrix)
fmode(d)                         # data.frame
fmean(qM(d), drop = FALSE)       # Still a matrix
fmax(d, drop = FALSE)            # Still a data.frame

# Fast grouped and/or weighted statistics
w <- abs(rnorm(fnrow(iris)))
fmedian(d, w = w)                 # Simple weighted statistics
fnth(d, 0.75, g)                  # Grouped statistics (grouped third quartile)
fmedian(d, g, w)                  # Groupwise-weighted statistics
fsd(v, g, w)                      # Similarly for vectors
fmode(qM(d), g, w, ties = "max")  # Or matrices (grouped and weighted maximum mode) ...

# A fast set of data manipulation functions allows complex piped programming at high speeds
library(magrittr)                            # Pipe operators
iris %>% fgroup_by(Species) %>% fndistinct   # Grouped distinct value counts
iris %>% fgroup_by(Species) %>% fmedian(w)   # Weighted group medians 
iris %>% add_vars(w) %>%                     # Adding weight vector to dataset
  fsubset(Sepal.Length < fmean(Sepal.Length), Species, Sepal.Width:w) %>% # Fast selecting and subsetting
  fgroup_by(Species) %>%                     # Grouping (efficiently creates a grouped tibble)
  fvar(w) %>%                                # Frequency-weighted group-variance, default (keep.w = TRUE)  
  roworder(sum.w)                            # also saves group weights in a column called 'sum.w'

# Can also use dplyr (but dplyr manipulation verbs are a lot slower)
library(dplyr)
iris %>% add_vars(w) %>% 
  filter(Sepal.Length < fmean(Sepal.Length)) %>% 
  select(Species, Sepal.Width:w) %>% 
  group_by(Species) %>% 
  fvar(w) %>% arrange(sum.w)
  
## Fast Data Manipulation ---------------------------------------------------------------------------------------

head(GGDC10S)

# Pivot Wider: Only SUM (total)
SUM <- GGDC10S |> pivot(c("Country", "Year"), "SUM", "Variable", how = "wider")
head(SUM)

# Joining with data from wlddev
wlddev |>
    join(SUM, on = c("iso3c" = "Country", "year" = "Year"), how = "inner")

# Recast pivoting + supplying new labels for generated columns
pivot(GGDC10S, values = 6:16, names = list("Variable", "Sectorcode"),
      labels = list(to = "Sector",
                    new = c(Sectorcode = "GGDC10S Sector Code",
                            Sector = "Long Sector Description",
                            VA = "Value Added",
                            EMP = "Employment")), 
      how = "recast", na.rm = TRUE)

## Advanced Aggregation -----------------------------------------------------------------------------------------

collap(iris, Sepal.Length + Sepal.Width ~ Species, fmean)  # Simple aggregation using the mean..
collap(iris, ~ Species, list(fmean, fmedian, fmode))       # Multiple functions applied to each column
add_vars(iris) <- w                                        # Adding weights, return in long format..
collap(iris, ~ Species, list(fmean, fmedian, fmode), w = ~ w, return = "long")

# Generate some additional logical data
settransform(iris, AWMSL = Sepal.Length > fmedian(Sepal.Length, w = w), 
                   AWMSW = Sepal.Width > fmedian(Sepal.Width, w = w))

# Multi-type data aggregation: catFUN applies to all categorical columns (here AMWSW)
collap(iris, ~ Species + AWMSL, list(fmean, fmedian, fmode), 
       catFUN = fmode, w = ~ w, return = "long")

# Custom aggregation gives the greatest possible flexibility: directly mapping functions to columns
collap(iris, ~ Species + AWMSL, 
       custom = list(fmean = 2:3, fsd = 3:4, fmode = "AWMSL"), w = ~ w, 
       wFUN = list(fsum, fmin, fmax), # Here also aggregating the weight vector with 3 different functions
       keep.col.order = FALSE)        # Column order not maintained -> grouping and weight variables first

# Can also use grouped tibble: weighted median for numeric, weighted mode for categorical columns
iris %>% fgroup_by(Species, AWMSL) %>% collapg(fmedian, fmode, w = w)

## Advanced Transformations -------------------------------------------------------------------------------------

# All Fast Statistical Functions have a TRA argument, supporting 10 different replacing and sweeping operations
fmode(d, TRA = "replace")     # Replacing values with the mode
fsd(v, TRA = "/")             # dividing by the overall standard deviation (scaling)
fsum(d, TRA = "%")            # Computing percentages
fsd(d, g, TRA = "/")          # Grouped scaling
fmin(d, g, TRA = "-")         # Setting the minimum value in each species to 0
ffirst(d, g, TRA = "%%")      # Taking modulus of first value in each species
fmedian(d, g, w, "-")         # Groupwise centering by the weighted median
fnth(d, 0.95, g, w, "%")      # Expressing data in percentages of the weighted species-wise 95th percentile
fmode(d, g, w, "replace",     # Replacing data by the species-wise weighted minimum-mode
      ties = "min")

# TRA() can also be called directly to replace or sweep with a matching set of computed statistics
TRA(v, sd(v), "/")                       # Same as fsd(v, TRA = "/")
TRA(d, fmedian(d, g, w), "-", g)         # Same as fmedian(d, g, w, "-")
TRA(d, BY(d, g, quantile, 0.95), "%", g) # Same as fnth(d, 0.95, g, TRA = "%") (apart from quantile algorithm)

# For common uses, there are some faster and more advanced functions
fbetween(d, g)                           # Grouped averaging [same as fmean(d, g, TRA = "replace") but faster]
fwithin(d, g)                            # Grouped centering [same as fmean(d, g, TRA = "-") but faster]
fwithin(d, g, w)                         # Grouped and weighted centering [same as fmean(d, g, w, "-")]
fwithin(d, g, w, theta = 0.76)           # Quasi-centering i.e. d - theta*fbetween(d, g, w)
fwithin(d, g, w, mean = "overall.mean")  # Preserving the overall weighted mean of the data

fscale(d)                                # Scaling and centering (default mean = 0, sd = 1)
fscale(d, mean = 5, sd = 3)              # Custom scaling and centering
fscale(d, mean = FALSE, sd = 3)          # Mean preserving scaling
fscale(d, g, w)                          # Grouped and weighted scaling and centering
fscale(d, g, w, mean = "overall.mean",   # Setting group means to overall weighted mean,
       sd = "within.sd")                 # and group sd's to fsd(fwithin(d, g, w), w = w)

get_vars(iris, 1:2)                      # Use get_vars for fast selecting data.frame columns, gv is shortcut
fhdbetween(gv(iris, 1:2), gv(iris, 3:5)) # Linear prediction with factors and continuous covariates
fhdwithin(gv(iris, 1:2), gv(iris, 3:5))  # Linear partialling out factors and continuous covariates

# This again opens up new possibilities for data manipulation...
iris %>%  
  ftransform(ASWMSL = Sepal.Length > fmedian(Sepal.Length, Species, w, "replace")) %>%
  fgroup_by(ASWMSL) %>% collapg(w = w, keep.col.order = FALSE)

iris %>% fgroup_by(Species) %>% num_vars %>% fwithin(w)  # Weighted demeaning


## Time Series and Panel Series ---------------------------------------------------------------------------------

flag(AirPassengers, -1:3)                      # A sequence of lags and leads
EuStockMarkets %>%                             # A sequence of first and second seasonal differences
  fdiff(0:1 * frequency(.), 1:2)  
fdiff(EuStockMarkets, rho = 0.95)              # Quasi-difference [x - rho*flag(x)]
fdiff(EuStockMarkets, log = TRUE)              # Log-difference [log(x/flag(x))]
EuStockMarkets %>% fgrowth(c(1, frequency(.))) # Ordinary and seasonal growth rate
EuStockMarkets %>% fgrowth(logdiff = TRUE)     # Log-difference growth rate [log(x/flag(x))*100]

# Creating panel data
pdata <- EuStockMarkets %>% list(`A` = ., `B` = .) %>% 
         unlist2d(idcols = "Id", row.names = "Time")  

L(pdata, -1:3, ~Id, ~Time)                   # Sequence of fully identified panel-lags (L is operator for flag) 
pdata %>% fgroup_by(Id) %>% flag(-1:3, Time) # Same thing..

# collapse also supports indexed series and data frames (and plm panel data classes)
pdata <- findex_by(pdata, Id, Time)         
L(pdata, -1:3)          # Same as above, ...
psacf(pdata)            # Multivariate panel-ACF
psmat(pdata) %>% plot   # 3D-array of time series from panel data + plotting

HDW(pdata)              # This projects out id and time fixed effects.. (HDW is operator for fhdwithin)
W(pdata, effect = "Id") # Only Id effects.. (W is operator for fwithin)

## List Processing ----------------------------------------------------------------------------------------------

# Some nested list of heterogenous data objects..
l <- list(a = qM(mtcars[1:8]),                                   # Matrix
          b = list(c = mtcars[4:11],                             # data.frame
                   d = list(e = mtcars[2:10], 
                            f = fsd(mtcars))))                   # Vector

ldepth(l)                       # List has 4 levels of nesting (considering that mtcars is a data.frame)
is_unlistable(l)                # Can be unlisted
has_elem(l, "f")                # Contains an element by the name of "f"
has_elem(l, is.matrix)          # Contains a matrix

get_elem(l, "f")                # Recursive extraction of elements..
get_elem(l, c("c","f"))         
get_elem(l, c("c","f"), keep.tree = TRUE)
unlist2d(l, row.names = TRUE)   # Intelligent recursive row-binding to data.frame   
rapply2d(l, fmean) %>% unlist2d # Taking the mean of all elements and repeating

# Application: extracting and tidying results from (potentially nested) lists of model objects
list(mod1 = lm(mpg ~ carb, mtcars), 
     mod2 = lm(mpg ~ carb + hp, mtcars)) %>%
  lapply(summary) %>% 
  get_elem("coef", regex = TRUE) %>%   # Regular expression search and extraction
  unlist2d(idcols = "Model", row.names = "Predictor")

## Summary Statistics -------------------------------------------------------------------------------------------

irisNA <- na_insert(iris, prop = 0.15)  # Randmonly set 15% missing
fnobs(irisNA)                           # Observation count
pwnobs(irisNA)                          # Pairwise observation count
fnobs(irisNA, g)                        # Grouped observation count
fndistinct(irisNA)                      # Same with distinct values... (default na.rm = TRUE skips NA's)
fndistinct(irisNA, g)  

descr(iris)                                   # Detailed statistical description of data

varying(iris, ~ Species)                      # Show which variables vary within Species
varying(pdata)                                # Which are time-varying ? 
qsu(iris, w = ~ w)                            # Fast (one-pass) summary (with weights)
qsu(iris, ~ Species, w = ~ w, higher = TRUE)  # Grouped summary + higher moments
qsu(pdata, higher = TRUE)                     # Panel-data summary (between and within entities)
pwcor(num_vars(irisNA), N = TRUE, P = TRUE)   # Pairwise correlations with p-value and observations
pwcor(W(pdata, keep.ids = FALSE), P = TRUE)   # Within-correlations

Evaluated and more extensive sets of examples are provided on the package page (also accessible from R by calling example('collapse-package')), and further in the vignettes and documentation.

Citation

If collapse was instrumental for your research project, please consider citing it using citation("collapse").

collapse's People

Contributors

arthurgailes avatar eddelbuettel avatar fkohrt avatar github-actions[bot] avatar jofam avatar kalibera avatar rfhb avatar romainfrancois avatar sebkrantz avatar tappek avatar

Stargazers

 avatar  avatar  avatar  avatar  avatar  avatar  avatar  avatar  avatar  avatar  avatar  avatar  avatar  avatar  avatar  avatar  avatar  avatar  avatar  avatar  avatar  avatar  avatar  avatar  avatar  avatar  avatar  avatar  avatar  avatar  avatar  avatar  avatar  avatar  avatar  avatar  avatar  avatar  avatar  avatar  avatar  avatar  avatar  avatar  avatar  avatar  avatar  avatar  avatar  avatar  avatar  avatar  avatar  avatar  avatar  avatar  avatar  avatar  avatar  avatar  avatar  avatar  avatar  avatar  avatar  avatar  avatar  avatar  avatar  avatar  avatar  avatar  avatar  avatar  avatar  avatar  avatar  avatar  avatar  avatar  avatar  avatar  avatar  avatar  avatar  avatar  avatar  avatar  avatar  avatar  avatar  avatar  avatar  avatar  avatar  avatar  avatar  avatar  avatar  avatar

Watchers

 avatar  avatar  avatar  avatar  avatar  avatar  avatar  avatar  avatar  avatar

collapse's Issues

use fixest to replace lfe

Do you have any plans to replace collapse's dependency on lfe with fixest? lfe is slow and seems to lack proper maintenance. Meanwhile, fixest is fast and well maintained.

Thanks again for your great package. I am working on a research project using high-frequency foreign exchange data, which is a huge panel data. Your package's qsu function really makes my life much easier.

return 25%, 50%, and 75% quantiles with qsu

I could not figure out how to return 25%, 50% (median), and 75% quantiles with qsu. All I can get are N, Mean, SD, Min, Max, Skew, and Kurt. Are these quantiles available in qsu? If not, it would be great if you could add them. Thanks.

matrix attribute

If one displays the result of flag it shows a matrix attribute but if one uses matrix it does not. This may be the result of changes in R. Note below how the class does not display when we use matrix below but does when we use flag. (Examing the dput of the outputs can be used to show the differences.)

> flag(1:5, 2:3)
     L2 L3
[1,] NA NA
[2,] NA NA
[3,]  1 NA
[4,]  2  1
[5,]  3  2
attr(,"class")   <-------------------
[1] "matrix"

> matrix(1, 3, 3)
     [,1] [,2] [,3]
[1,]    1    1    1
[2,]    1    1    1
[3,]    1    1    1

> packageVersion("collapse")
[1] โ€˜1.5.3โ€™

> R.version.string
[1] "R version 4.1.0 RC (2021-05-16 r80303)"

Feature request: Fast substitute for plm::pvar

The function pvar in plm is notoriously slow. A fast function for the same purpose is are_varying in package panelr but it requires package dplyr as a dependency.

Do you plan a drop-in replacement for pvar (without additional dependencies, i.e., just Rcpp)?

BTW: This is a very interesting package! I am thinking since a while if plm could have an option to make use of the faster versions of transformations supplied by this package as they seem to be drop-in replacements (if the package is available on the users local machine). The additional dependency burden with collapse and - in turn - Rcpp seems quite low.

flast returns wrong values for POSIXct columns

The last value returned by flast for posixct columns in this case the date column) is not the last value for the group.

x <- mtcars 
x$date = Sys.time() + 1:nrow(x) 
tail(x,1) 
collapse::collap(x, ~cyl, FUN = collapse::flast) 

# this will return the correct value:
 collapse::flast(x, x[,'cyl'])

I am using version 1.2.1

unlist2d returns error if empty list is present

Hi. Nice work!

Was playing with collapse using internal data.
When I have a nested list with 3 levels and one of the levels is empty, the unlist2d function returns "Error in .subset2(l, 1L) : subscript out of bounds".

Is there a way to filter out empty list or nulls before building the data.frame in unlist2d?

Thanks

Argument checking

As I saw you put quite some effort into checking of input arguments! I thought a leave a tiny hint for further improvement shall you be interested.
The fine error output for the commands below specify what is expected, but not for which argument; the second case with = NULL I found harder to track down as it was not clear to me it refers to arguments.

Anyways, looking at the fine documentation, it is very clear.

library(collapse)
data(wlddev, package = "collapse")
collapse::fbetween(wlddev$PCGDP, g = wlddev$iso3c, w = NULL, na.rm = "a") 
# Error in fbetween.default(wlddev$PCGDP, g = wlddev$iso3c, w = NULL, na.rm = "a") : 
#   Not compatible with requested type: [type=character; target=logical].
collapse::fbetween(wlddev$PCGDP, g = wlddev$iso3c, w = NULL, na.rm = NULL)
#Error in fbetween.default(wlddev$PCGDP, g = wlddev$iso3c, w = NULL, na.rm = NULL) : 
#  Expecting a single value: [extent=0].

Add imports!

Add the necessary imports:

  • imports for functions used from stats package et al
  • import/suggest data.table package (after reworking to separate the code)
  • imports/suggests future/parallel package (after reworking to separate the code)

How this has to be done, depends largely on the decisions on how to go forwards with the data.table and parallel functionality.

ffirst did not work with list columns

dt <- data.table::as.data.table(mtcars)
(dt_listcol <- dt[, lapply(.SD, list), by = c("vs", "am", "gear", "carb")])
#>     vs am gear carb                      mpg       cyl                    disp
#>  1:  0  1    4    4                    21,21       6,6                 160,160
#>  2:  1  1    4    1      22.8,32.4,33.9,27.3   4,4,4,4 108.0, 78.7, 71.1, 79.0
#>  3:  1  0    3    1           21.4,18.1,21.5     6,6,4       258.0,225.0,120.1
#>  4:  0  0    3    2      18.7,15.5,15.2,19.2   8,8,8,8         360,318,304,400
#>  5:  0  0    3    4 14.3,10.4,10.4,14.7,13.3 8,8,8,8,8     360,472,460,440,350
#>  6:  1  0    4    2                24.4,22.8       4,4             146.7,140.8
#>  7:  1  0    4    4                19.2,17.8       6,6             167.6,167.6
#>  8:  0  0    3    3           16.4,17.3,15.2     8,8,8       275.8,275.8,275.8
#>  9:  1  1    4    2                30.4,21.4       4,4              75.7,121.0
#> 10:  0  1    5    2                       26         4                   120.3
#> 11:  1  1    5    2                     30.4         4                    95.1
#> 12:  0  1    5    4                     15.8         8                     351
#> 13:  0  1    5    6                     19.7         6                     145
#> 14:  0  1    5    8                       15         8                     301
#>                      hp                     drat                            wt
#>  1:             110,110                  3.9,3.9                   2.620,2.875
#>  2:         93,66,65,66      3.85,4.08,4.22,4.08       2.320,2.200,1.835,1.935
#>  3:         110,105, 97           3.08,2.76,3.70             3.215,3.460,2.465
#>  4:     175,150,150,175      3.15,2.76,3.15,3.08       3.440,3.520,3.435,3.845
#>  5: 245,205,215,230,245 3.21,2.93,3.00,3.23,3.73 3.570,5.250,5.424,5.345,3.840
#>  6:               62,95                3.69,3.92                     3.19,3.15
#>  7:             123,123                3.92,3.92                     3.44,3.44
#>  8:         180,180,180           3.07,3.07,3.07                4.07,3.73,3.78
#>  9:              52,109                4.93,4.11                   1.615,2.780
#> 10:                  91                     4.43                          2.14
#> 11:                 113                     3.77                         1.513
#> 12:                 264                     4.22                          3.17
#> 13:                 175                     3.62                          2.77
#> 14:                 335                     3.54                          3.57
#>                              qsec
#>  1:                   16.46,17.02
#>  2:       18.61,19.47,19.90,18.90
#>  3:             19.44,20.22,20.01
#>  4:       17.02,16.87,17.30,17.05
#>  5: 15.84,17.98,17.82,17.42,15.41
#>  6:                     20.0,22.9
#>  7:                     18.3,18.9
#>  8:                17.4,17.6,18.0
#>  9:                   18.52,18.60
#> 10:                          16.7
#> 11:                          16.9
#> 12:                          14.5
#> 13:                          15.5
#> 14:                          14.6

dt_listcol[, data.table::first(.SD), by = c("vs", "am")]
#>    vs am gear carb                 mpg     cyl                    disp
#> 1:  0  1    4    4               21,21     6,6                 160,160
#> 2:  1  1    4    1 22.8,32.4,33.9,27.3 4,4,4,4 108.0, 78.7, 71.1, 79.0
#> 3:  1  0    3    1      21.4,18.1,21.5   6,6,4       258.0,225.0,120.1
#> 4:  0  0    3    2 18.7,15.5,15.2,19.2 8,8,8,8         360,318,304,400
#>                 hp                drat                      wt
#> 1:         110,110             3.9,3.9             2.620,2.875
#> 2:     93,66,65,66 3.85,4.08,4.22,4.08 2.320,2.200,1.835,1.935
#> 3:     110,105, 97      3.08,2.76,3.70       3.215,3.460,2.465
#> 4: 175,150,150,175 3.15,2.76,3.15,3.08 3.440,3.520,3.435,3.845
#>                       qsec
#> 1:             16.46,17.02
#> 2: 18.61,19.47,19.90,18.90
#> 3:       19.44,20.22,20.01
#> 4: 17.02,16.87,17.30,17.05

collapse::ffirst.data.frame(dt_listcol, collapse::get_vars(dt_listcol, c("vs", "am")))
#> Error in collapse::ffirst.data.frame(dt_listcol, collapse::get_vars(dt_listcol, : incompatible SEXP encountered;

Created on 2021-03-29 by the reprex package (v1.0.0)

Inconsistence when counting occurrence by group

Hi, I don't know if I'm doing something wrong but I'm failing to count number of a certain occurrence by group.


library(tidyverse)
library(collapse)
#> collapse 1.5.0, see ?`collapse-package` or ?`collapse-documentation`
#> Note: stats::D  ->  D.expression, D.call, D.name
#> 
#> Attaching package: 'collapse'
#> The following object is masked from 'package:stats':
#> 
#>     D

a <- r"(a a a a b b b b b c c c)"
b <- r"(a b b b a a b b b b b b)"
a <- str_split(a, " ")
b <- str_split(b, " ")

tibble(a = a, b = b) %>%  unnest() -> df
#> Warning: `cols` is now required when using unnest().
#> Please use `cols = c(a, b)`

df %>% 
  group_by(a) %>% 
  mutate(
    n = sum(b == "a")
  )
#> # A tibble: 12 x 3
#> # Groups:   a [3]
#>    a     b         n
#>    <chr> <chr> <int>
#>  1 a     a         1
#>  2 a     b         1
#>  3 a     b         1
#>  4 a     b         1
#>  5 b     a         2
#>  6 b     a         2
#>  7 b     b         2
#>  8 b     b         2
#>  9 b     b         2
#> 10 c     b         0
#> 11 c     b         0
#> 12 c     b         0

df %>% 
  fgroup_by(a) %>% 
  ftransform(
    n = fsum(b == a)
  )
#> # A tibble: 12 x 3
#>    a     b         n
#>  * <chr> <chr> <dbl>
#>  1 a     a         4
#>  2 a     b         4
#>  3 a     b         4
#>  4 a     b         4
#>  5 b     a         4
#>  6 b     a         4
#>  7 b     b         4
#>  8 b     b         4
#>  9 b     b         4
#> 10 c     b         4
#> 11 c     b         4
#> 12 c     b         4
#> 
#> Grouped by:  a  [3 | 4 (1)]

Created on 2021-03-05 by the reprex package (v0.3.0)

As you may see, ftransform weren't affected by grouping function.

Thanks in advance.

Is there an alternative solution for function case_when in the dplyr?

Hi Krantz! I feel like this package has so much potential, and I plan to get familiar with the grammar during the winter.

I am trying to modify most of our data processing pipeline with collapse(mostly written in dplyr). And I ran into the problem with finding the right alternatives for the function case_when from dplyr. The following example actually worked due to the great design of flexibility and interactivity with the collapse object. But I wondered if there are ways in the collapse package to replace the case_when function with something else? In that way, it might boost the performance to another level. The recode method was not what I have in mind at this point.

library(tidyverse)
library(collapse)
x <- 1:50
tbl <- tibble(variable = x)
microbenchmark::microbenchmark(
  dplyr = tbl %>%
    mutate(
      cat = case_when(
        x %% 35 == 0 ~ "fizz buzz",
        x %% 5 == 0 ~ "fizz",
        x %% 7 == 0 ~ "buzz",
        TRUE ~ as.character(x)
      )
    ),
  collapse = tbl %>%
    ftransform(
      cat = case_when(
        x %% 35 == 0 ~ "fizz buzz",
        x %% 5 == 0 ~ "fizz",
        x %% 7 == 0 ~ "buzz",
        TRUE ~ as.character(x)
      )
    )
)

performance questions

I haven't tried your collapse yet but I am curious about its performance. I use data.table and Rfast for performance. Is the collapse package faster than data.table + Rfast? In addition, how does the collapse package using multiple threads?

`add_vars()` seems incompatible with `.subset2()` when inputing larger vectors

For smaller vector, add_vars() works nicely with .subset2():

data <- data.frame(x = rep(round(runif(100))), y = rep(rpois(100, 2)))
bench::mark(
    .ss2 = .subset2(data, "x") * .subset2(data, "y"),
    `[[` = data[["x"]] * data[["y"]],
    collapse = collapse::get_elem(data, "x") * collapse::get_elem(data, "y")
)
#> # A tibble: 3 x 6
#>   expression      min   median `itr/sec` mem_alloc `gc/sec`
#>   <bch:expr> <bch:tm> <bch:tm>     <dbl> <bch:byt>    <dbl>
#> 1 .ss2          800ns    1.2us   680680.      848B     0   
#> 2 [[            9.9us   12.2us    67557.      848B     6.76
#> 3 collapse     52.3us   64.3us    13101.    67.8MB     6.23
bench::mark(
    .ss2 = {collapse::add_vars(data) <- list(new = .subset2(data, "x") * .subset2(data, "y"))},
    `[[` = {collapse::add_vars(data) <- list(new = data[["x"]] * data[["y"]])},
    collapse = {collapse::add_vars(data) <- list(new = collapse::get_elem(data, "x") * collapse::get_elem(data, "y"))}
)
#> # A tibble: 3 x 6
#>   expression      min   median `itr/sec` mem_alloc `gc/sec`
#>   <bch:expr> <bch:tm> <bch:tm>     <dbl> <bch:byt>    <dbl>
#> 1 .ss2           23us 150.55us    6500.     67.1KB    15.3 
#> 2 [[          247.7us  375.7us    2294.       848B    16.5 
#> 3 collapse     8.31ms   9.78ms      97.4      848B     2.03

Created on 2021-03-29 by the reprex package (v1.0.0)

For larger data set, add_vars() works slowly with .subset2():

data <- data.frame(x = rep(round(runif(100)), 10000), y = rep(rpois(100, 2), 10000))
bench::mark(
    .ss2 = .subset2(data, "x") * .subset2(data, "y"),
    `[[` = data[["x"]] * data[["y"]],
    collapse = collapse::get_elem(data, "x") * collapse::get_elem(data, "y")
)
#> # A tibble: 3 x 6
#>   expression      min   median `itr/sec` mem_alloc `gc/sec`
#>   <bch:expr> <bch:tm> <bch:tm>     <dbl> <bch:byt>    <dbl>
#> 1 .ss2         3.16ms   3.94ms      245.    7.63MB     49.6
#> 2 [[           3.45ms   4.31ms      230.    7.63MB     46.7
#> 3 collapse     3.29ms   4.36ms      212.   75.42MB     43.0
bench::mark(
    .ss2 = {collapse::add_vars(data) <- list(new = .subset2(data, "x") * .subset2(data, "y"))},
    `[[` = {collapse::add_vars(data) <- list(new = data[["x"]] * data[["y"]])},
    collapse = {collapse::add_vars(data) <- list(new = collapse::get_elem(data, "x") * collapse::get_elem(data, "y"))}
)
#> # A tibble: 3 x 6
#>   expression      min   median `itr/sec` mem_alloc `gc/sec`
#>   <bch:expr> <bch:tm> <bch:tm>     <dbl> <bch:byt>    <dbl>
#> 1 .ss2         4.23ms   5.08ms      185.    7.69MB    41.1 
#> 2 [[           3.79ms   4.78ms      181.    7.63MB    20.1 
#> 3 collapse     3.82ms   5.28ms      182.    7.63MB     8.87

Created on 2021-03-29 by the reprex package (v1.0.0)

collap weighted aggregation of some columns only.

Hi,
not sure if this is an issue or if I'm doing something wrong here.
I want to aggregate a data.table applying sum to some variables, and weighted.mean to another.
If I aggregate only the sum variables, everything works fine. But when I add the weighted.mean variable, the sum variables get messed up! Any idea?

library(data.table)
library(collapse)
#> collapse 1.4.2, see ?`collapse-package` or ?`collapse-documentation`
#> Note: stats::D  ->  D.expression, D.call, D.name
#> 
#> Attaching package: 'collapse'
#> The following object is masked from 'package:stats':
#> 
#>     D

dt <- data.table(
  a = rep(1:10, 100), 
  b = rnorm(n = 1000, mean = 100, sd = 20), 
  c = rnorm(n = 1000, mean = 1000, sd = 100), 
  d = rnorm(n = 1000, mean = 10000, sd = 200), 
  e = rnorm(n = 1000, mean = 40, sd = 30), 
  key = "a"
)

# sum only
dt_aggr <- dt[, 
              .(b = sum(b), 
                c = sum(c), 
                d = sum(d)
              ), 
              by = a 
]

dt_collap <- collap(dt, by = ~ a, 
                    custom = list(fsum = c("b", "c", "d")),
                    give.names = FALSE, keep.col.order = FALSE)

all.equal(dt_aggr, dt_collap)
#> [1] TRUE


# use custom function with sum and weighted.mean

dt_aggr <- dt[, 
              .(b = sum(b), 
                c = sum(c), 
                d = sum(d),
                e = weighted.mean(e, b)
              ), 
              by = a 
]

dt_collap <- collap(dt, by = ~ a, 
                    custom = list(
                      fsum = c("b", "c", "d"),
                      fmean = "e"
                      ),
                    w = ~ b, keep.w = FALSE, 
                    give.names = FALSE, keep.col.order = FALSE)

dt_aggr
#>      a         b         c         d        e
#>  1:  1  9985.163 100656.28 1000460.5 43.45476
#>  2:  2 10215.605 101369.08 1001280.4 38.81689
#>  3:  3 10132.684 100015.69  998257.2 45.00704
#>  4:  4 10299.465  99359.17  998097.4 38.94448
#>  5:  5  9905.694  99733.19 1001845.9 37.09333
#>  6:  6  9988.843  98280.45 1002948.9 41.16864
#>  7:  7  9959.367  99793.90  995675.8 37.17596
#>  8:  8  9919.158  99717.87  998518.1 39.40925
#>  9:  9  9893.985  99670.91  999392.1 40.97915
#> 10: 10  9675.062  99277.57  997792.6 44.98985
dt_collap
#>      a         b        c         d        e
#>  1:  1 1034167.1 10040221  99905293 43.45476
#>  2:  2 1079467.2 10379496 102277718 38.81689
#>  3:  3 1070231.1 10112437 101265286 45.00704
#>  4:  4 1104998.8 10192585 102704800 38.94448
#>  5:  5 1019286.8  9875563  99210893 37.09333
#>  6:  6 1036688.8  9809949 100116781 41.16864
#>  7:  7 1021060.7  9926199  99127299 37.17596
#>  8:  8 1018893.5  9894616  99034998 39.40925
#>  9:  9 1017878.8  9847994  98895093 40.97915
#> 10: 10  979306.1  9594276  96542945 44.98985

Created on 2020-11-23 by the reprex package (v0.3.0)

`add_vars()<-` should support specify the name all the new column

Surprisingly, I cannot specify the column name for the added variable in add_vars()<-. Currently, ftransform() can do this, but no standard evaluation is supported. It turned out that I use the base [<-, again. Hopefully, programming using this package will be better soon.

Error "lag-length exceeds average group-size": should drop levels first?

Thanks for the package!

Subsetting a dataset on a factor variable will throw an error with L, as it seems group size is computed for missing factors too, and hence throws zero? Maybe use dropLevels first?

library(collapse)
#> collapse 1.1.0, see ?`collapse-package` or ?`collapse-documentation`
#> 
#> Attaching package: 'collapse'
#> The following object is masked from 'package:stats':
#> 
#>     D
data(wlddev)

wlddev2 <- subset(wlddev, iso3c %in% c("ALB", "AFG", "DZA"))
wlddev3 <- droplevels(wlddev2)

head(L(wlddev, 1, ~iso3c, ~year, cols="LIFEEX"))
#>   iso3c year L1.LIFEEX
#> 1   AFG 1960        NA
#> 2   AFG 1961    32.292
#> 3   AFG 1962    32.742
#> 4   AFG 1963    33.185
#> 5   AFG 1964    33.624
#> 6   AFG 1965    34.060
head(L(wlddev2, 1, ~iso3c, ~year, cols="LIFEEX"))
#> Error in L.data.frame(wlddev2, 1, ~iso3c, ~year, cols = "LIFEEX"): lag-length exceeds average group-size (0)
head(L(wlddev3, 1, ~iso3c, ~year, cols="LIFEEX"))
#>   iso3c year L1.LIFEEX
#> 1   AFG 1960        NA
#> 2   AFG 1961    32.292
#> 3   AFG 1962    32.742
#> 4   AFG 1963    33.185
#> 5   AFG 1964    33.624
#> 6   AFG 1965    34.060

Created on 2020-05-03 by the reprex package (v0.3.0)

Add unit tests

Unit tests (using testthat) need to be added. They work on small example datasets and allow to check whether the code keeps functioning as planned while reworking.

@SebKrantz if you can provide a couple of examples on small datasets with the required output, I can add them.

Update examples to forthcoming native pipe (`|>`)

Hi Sebastian,

Just a small and likely redundant note to say that I've tested collapse against the forthcoming R 4.1.0 release candidate. The new native pipe (|>) appears to work very nicely with the package. Examples:

# R Under development (unstable) (2021-05-01 r80254) -- "Unsuffered Consequences"

iris |> fgroup_by(Species) |> fNdistinct() 
#>      Species Sepal.Length Sepal.Width Petal.Length Petal.Width
#> 1     setosa           15          16            9           6
#> 2 versicolor           21          14           19           9
#> 3  virginica           21          13           20          12

w <- abs(rnorm(fnrow(iris)))
iris |> 
  add_vars(w) |> 
  fsubset(Sepal.Length < fmean(Sepal.Length), Species, Sepal.Width:w) |>
  fgroup_by(Species) |> 
  fvar(w) |> 
  roworder(sum.w) 
#>      Species     sum.w Sepal.Width Petal.Length Petal.Width
#> 1  virginica  5.876047  0.01770740   0.04656351  0.01606024
#> 2 versicolor 18.347134  0.05583887   0.14284741  0.02330951
#> 3     setosa 35.626894  0.12962384   0.03163604  0.01031945

When the time comes, it might be worth updating the doc examples that currently rely on the magrittr pipe (%>%), since that's one less additional package/dependency to worry about.

"sortedโ€œ attributes should not be kept when using fsubset

Maybe related to #136.

data.table internally uses attributes to store some metadata. sorted is one of them indicating names of the columns that have been sorted using data.table::setkey().

When subsetting using [.data.table, the sorted attribute will be removed. But using collapse::fsubset.data.frame() did not. I am not sure if this will introduce errors when doing other data.table operations, since giving #136 that using fsubset will break the
self-referencing of data.table.

dt <- data.table::as.data.table(mtcars)
data.table::setkey(dt, cyl)

str(dt[c(2L, 1L)])
#> Classes 'data.table' and 'data.frame':   2 obs. of  11 variables:
#>  $ mpg : num  24.4 22.8
#>  $ cyl : num  4 4
#>  $ disp: num  147 108
#>  $ hp  : num  62 93
#>  $ drat: num  3.69 3.85
#>  $ wt  : num  3.19 2.32
#>  $ qsec: num  20 18.6
#>  $ vs  : num  1 1
#>  $ am  : num  0 1
#>  $ gear: num  4 4
#>  $ carb: num  2 1
#>  - attr(*, ".internal.selfref")=<externalptr>

str(collapse::fsubset.data.frame(dt, c(2L, 1L)))
#> Classes 'data.table' and 'data.frame':   2 obs. of  11 variables:
#>  $ mpg : num  24.4 22.8
#>  $ cyl : num  4 4
#>  $ disp: num  147 108
#>  $ hp  : num  62 93
#>  $ drat: num  3.69 3.85
#>  $ wt  : num  3.19 2.32
#>  $ qsec: num  20 18.6
#>  $ vs  : num  1 1
#>  $ am  : num  0 1
#>  $ gear: num  4 4
#>  $ carb: num  2 1
#>  - attr(*, ".internal.selfref")=<externalptr> 
#>  - attr(*, "sorted")= chr "cyl"

Created on 2021-03-29 by the reprex package (v1.0.0)

integer groups in `fsum(..., use.g.names = FALSE)` unnecessary factor conversion?

I have noticed that passing an integer vector as g in collapse::fsum causes internal factor conversion, even when use.g.names = FALSE. This is a considerable slowdown if the names are irrelevant. I have data with integer group ids already present, which I think is not an edge case.

Some test data:

sum_test <- function(x, g) collapse::fsum.default(x, g, use.g.names = FALSE)
x <- sample(1:1e7)
g_int <- sample(1:1000, length(x), replace = TRUE)
g_fac <- as.factor(g_int)

microbenchmark::microbenchmark(
ans1 <- sum_test(x, g_int),
ans2 <- sum_test(x, g_fac)
, times = 10L
)

                        # expr       min       lq      mean    median        uq       max neval
  # ans1 <- sum_test(x, g_int) 173.77554 180.0894 184.38943 183.61633 189.80703 192.17675    10
 # ans2 <- sum_test(x, g_fac)  37.00679  48.4336  47.61358  49.42442  50.43859  51.29969    10

identical(ans1, ans2) # TRUE

Here are the relevant lines in collapse::fsum.default

...
            if (use.g.names) {
              ...
            }
            if (is.nmfactor(g))
                return(.Call(Cpp_fsum, x, fnlevels(g), g, w,
                  na.rm))
            g <- qG(g, na.exclude = FALSE)
            return(.Call(Cpp_fsum, x, attr(g, "N.groups"), g,
                w, na.rm))
...

Adding something along the lines of
if (is.integer(g)) return(.Call(cpp_fsum, x, fNdistinct(g), g, w, na.rm)
could fix this. I feel like this is not intended behavior, but I lack the bigger picture. I also suspect that there are similar functions with this behavior.

rolling statistics

Do you plan to add rolling statistics to your collapse package? Like the rolling mean, sd, regression, etc.

selecting one column

Using the built-in anscombe data frame, the following gives an error:

> slt(anscombe, 2)
Error in slt(anscombe, 2) : Unknown columns: 2

> ss(anscombe, , 2)
Error in ss(anscombe, , 2) : argument "i" is missing, with no default

> ss(anscombe, TRUE, 2)
Error in ss(anscombe, TRUE, 2) : 
  i needs to be integer or logical(nrow(x))

although, these work:

slt(anscombe, x2)  # second column is named x2
slt(anscombe, 2:2) # second column
slt(anscombe, 1:2) # first two columns

funique/fNdistinct

Hi,
Not an issue, but just for your information, please see below benchmark. I would tested larger data set but I have old hardware. You could be interested by some of the function in package kit.
Thanks.

set.seed(123)
x = sample(letters,6e7,TRUE)

microbenchmark::microbenchmark(
  collapse::funique(x),
  kit::funique(x),
  times = 2L
)
# Unit: milliseconds
#                 expr       min        lq      mean    median       uq      max neval
# collapse::funique(x) 284.24375 284.24375 322.06107 322.06107 359.8784 359.8784     2
# kit::funique(x)       94.74482  94.74482  94.76791  94.76791  94.7910  94.7910     2

microbenchmark::microbenchmark(
  collapse::fNdistinct(x),
  kit::uniqLen(x),
  times = 2L
)
# Unit: milliseconds
#                    expr      min       lq     mean   median       uq      max neval
# collapse::fNdistinct(x) 229.4525 229.4525 251.3959 251.3959 273.3393 273.3393     2
# kit::uniqLen(x)         102.3109 102.3109 117.6955 117.6955 133.0801 133.0801     2

summary statistics of date

The collapse::qsu function currently seems to not work with dates. It would be great if qsu could summarize date (and time) variables, just like the R base summary function.

Fix internal self-referencing issues when manipulating data.tableโ€˜s

Thanks for this amazing plugin. I did some very coarse benchmarking about {collapse} and {data.table} and got pretty impressed. Very looking forward to seeing the multi-threaded version as you mentioned by the end of this year. I am trying to replace some of my {data.table} workflow with {collapse}.

Currently settransform() did not work if {collapse} was not attached.

head(collapse::ftransform(airquality, Ozone = -Ozone))
#>   Ozone Solar.R Wind Temp Month Day
#> 1   -41     190  7.4   67     5   1
#> 2   -36     118  8.0   72     5   2
#> 3   -12     149 12.6   74     5   3
#> 4   -18     313 11.5   62     5   4
#> 5    NA      NA 14.3   56     5   5
#> 6   -28      NA 14.9   66     5   6
head(collapse::settransform(airquality, Ozone = -Ozone))
#> Error in ftransform(airquality, Ozone = -Ozone): could not find function "ftransform"

Created on 2021-03-13 by the reprex package (v1.0.0)

BTW, to my understanding, data.table::set* functions are not drop-in replacements for data.table::set*. The latter modifies the passed data internally at the C level which will be memory efficient. But collapse::settransform() did not. In this sense, from a performance perspective, it makes no difference between airquality <- collapse::ftransform(airquality, Ozone = -Ozone) and collapse::settransform(airquality, Ozone = -Ozone) right? Please correct if I am wrong.

Run collap() on data frame without observations

Hi Sebastian, hi everyone,

First let me congratulate you to this great and very useful tool. I am using the collap() command in a shiny app. In this context, I am occasionally passing data frames with zero rows to collap() (e.g. due to previous filters). This leads to R crashing immediately. Although a dim() check on data frames passed to collap() easily circumvents the issue, it might be useful to incorporate this dim() check into the command itself, i.e. when receiving
collap(data, var1 + var2 ~ var3 + var4, FUN = fsum)
with
dim(data)[1] == 0
return a data frame with var1 -- var4 but zero rows (e.g. through dplyr's select() or even base R).

If I am overlooking an obvious mistake on my behalf, I am happy for suggestions.

Best,
Daniel

Links in online documentation which are "Page not found (404)"

First, thanks a lot for your great work!

I was browsing through the nice online documentation and stumbled on some links that need to be updated (Page not found (404)).

Site:
https://sebkrantz.github.io/collapse/reference/fast-statistical-functions.html
Page not found:
Data Transformations
Time Series and Panel Series

Sites:
https://sebkrantz.github.io/collapse/reference/fmean.html
https://sebkrantz.github.io/collapse/reference/fmedian.html
https://sebkrantz.github.io/collapse/reference/fmode.html
https://sebkrantz.github.io/collapse/reference/fsum.html
https://sebkrantz.github.io/collapse/reference/fprod.html
https://sebkrantz.github.io/collapse/reference/fvar_fsd.html
https://sebkrantz.github.io/collapse/reference/fmin_fmax.html
https://sebkrantz.github.io/collapse/reference/fnth.html
https://sebkrantz.github.io/collapse/reference/ffirst_flast.html
https://sebkrantz.github.io/collapse/reference/fNobs.html
https://sebkrantz.github.io/collapse/reference/fNdistinct.html
https://sebkrantz.github.io/collapse/reference/collap.html
https://sebkrantz.github.io/collapse/reference/data-transformations.html
https://sebkrantz.github.io/collapse/reference/summary-statistics.html
https://sebkrantz.github.io/collapse/reference/qsu.html
https://sebkrantz.github.io/collapse/reference/collapse-options.html
Page not found:
Fast Statistical Functions

Site:
https://sebkrantz.github.io/collapse/reference/fast-grouping.html
Page not found:
Data Frame Manipulation
Fast Statistical Functions

Sites:
https://sebkrantz.github.io/collapse/reference/GRP.html
https://sebkrantz.github.io/collapse/reference/radixorder.html
https://sebkrantz.github.io/collapse/reference/funique.html
https://sebkrantz.github.io/collapse/reference/qF.html
https://sebkrantz.github.io/collapse/reference/fdroplevels.html
https://sebkrantz.github.io/collapse/reference/groupid.html
https://sebkrantz.github.io/collapse/reference/seqid.html
https://sebkrantz.github.io/collapse/reference/roworder.html
https://sebkrantz.github.io/collapse/reference/qF.html
Page not found:
Fast Grouping and Ordering

Site:
https://sebkrantz.github.io/collapse/reference/fast-data-manipulation.html
Page not found:
Quick Data Conversion
Recode and Replace Values

Site:
https://sebkrantz.github.io/collapse/reference/select_replace_vars.html
https://sebkrantz.github.io/collapse/reference/fsubset.html
https://sebkrantz.github.io/collapse/reference/ftransform.html
https://sebkrantz.github.io/collapse/reference/colorder.html
https://sebkrantz.github.io/collapse/reference/frename.html
Page not found:
Data Frame Manipulation

Site:
https://sebkrantz.github.io/collapse/reference/data-transformations.html
https://sebkrantz.github.io/collapse/reference/fdiff.html
https://sebkrantz.github.io/collapse/reference/fgrowth.html
https://sebkrantz.github.io/collapse/reference/psacf.html
Page not found:
Time Series and Panel Series

Site:
https://sebkrantz.github.io/collapse/reference/arithmetic.html
https://sebkrantz.github.io/collapse/reference/fbetween_fwithin.html
https://sebkrantz.github.io/collapse/reference/fHDbetween_fHDwithin.html
https://sebkrantz.github.io/collapse/reference/flm.html
https://sebkrantz.github.io/collapse/reference/fFtest.html
https://sebkrantz.github.io/collapse/reference/time-series-panel-series.html
Page not found:
Data Transformations

Site:
https://sebkrantz.github.io/collapse/reference/dapply.html
https://sebkrantz.github.io/collapse/reference/BY.html
https://sebkrantz.github.io/collapse/reference/TRA.html
https://sebkrantz.github.io/collapse/reference/fscale.html
Page not found:
Fast Statistical Functions
Data Transformations

Site:
https://sebkrantz.github.io/collapse/reference/flag.html
Page not found:
Fast Statistical Functions
Time Series and Panel Series

Site:
https://sebkrantz.github.io/collapse/reference/is.unlistable.html
https://sebkrantz.github.io/collapse/reference/ldepth.html
https://sebkrantz.github.io/collapse/reference/extract_list.html
https://sebkrantz.github.io/collapse/reference/rsplit.html
https://sebkrantz.github.io/collapse/reference/rapply2d.html
https://sebkrantz.github.io/collapse/reference/unlist2d.html
Page not found:
List Processing

Site:
https://sebkrantz.github.io/collapse/reference/qsu.html
Page not found:
Fast Statistical Functions
Summary Statistics

Site:
https://sebkrantz.github.io/collapse/reference/pwcor_pwcov_pwNobs.html
Page not found:
Summary Statistics

Site:
https://sebkrantz.github.io/collapse/reference/varying.html
Page not found:
Data Transformations
Summary Statistics

Site:
https://sebkrantz.github.io/collapse/reference/recode-replace.html
Page not found:
Small (Helper) Functions

Cheers

ftransform and fgroup_by

ftransform does not respect fgroup_by. For example, the following ignores the grouping:

anscombe2 <- anscombe
anscombe2$g <- c(0L, 0L, 0L, 0L, 0L, 1L, 1L, 1L, 1L, 1L, 1L)

anscombe2 %>%
  fgroup_by(g) %>%
  ftransformv(startsWith(names(.), "y"), cumsum) %>%
  fungroup

As far as I can tell it is only the fsum, fmean and related functions and fsummarise that respect fgroup_by. This works but it would still be desirable that ftransform respect grouping as well.

anscombe2 %>% ftransformv(startsWith(names(.), "y"), BY, g, cumsum)

It is possible that there are other functions that could usefully respect fgroup_by as well but I haven't played with this enough to know.

namespace with custom argument

Is it possible to use the collap 'custom' argument without loading the collapse library? When specifying the function names of in the 'custom' argument, which are the names of the elements, it is not possible to name the element list(collapse::fmean = 9:12, ...)

head(collapse::collap(collapse::wlddev, ~ country + decade, custom = list(fmean = 9:12, fsd = 9:10, fmode = 7:8)))       
Error in get(as.character(FUN), mode = "function", envir = envir) : 
  object 'fmean' of mode 'function' was not found

F as a function name

First, thank you so much for this really nice package. This is not your issue so much as it is mine and other bad syntax programmers like me, of which I think there are many.

In Collapse there is a function F(), but if you have poor programming practice like myself you frequently get lazy and set a statement to T/F instead of TRUE/FALSE as you technically should. As a result when collapse is loaded any function that has this lazy F will throw up errors.

Though it's probably not best to enable my bad practices, I think it's an obscure enough error that many people will get tripped up on this problem. Maybe consider changing?

Either way, really love this package and thank you again.

is.regular

is.regular conflicts with the generic of the same name in zoo which checks whether its argument is regularly spaced. Note that collapse claims to be compatible with zoo.

Calculation of Kurtosis

I would like to ask whether the kurtosis calculated with the qsu function is excess kurtosis or not.

Set up method dispatch on X and by

Currently the code to process by is copied twice (in collap and qsu). Providing method dispatch on X and by avoids unnecessary evaluations and conversions, and makes the package easier to maintain.

Ideally the internal workhorse function(s) would avoid conversions to data.frame as much as possible, as these are quite costly. It also allows to separate the data.table code from the rest, helping to solve #1

Segfaults: "numeric(0)" input in several fast statistical functions

While working on some data cleaning, a numeric(0) vector popped out after base subsetting. This led to a segfault when I tried to use the zero length vector with fsum(). Afterwards I tested all other fast statistical functions with the following results:

collapse::fsum(numeric(0))       # Segfault: address 0x55f7363efff8, cause 'memory not mapped'
collapse::fprod(numeric(0))      # Segfault: address 0x557a14cc8ff8, cause 'memory not mapped'
collapse::fmean(numeric(0))      # Segfault: address 0x559c7bdfaff8, cause 'memory not mapped
collapse::fmedian(numeric(0))    # Output: [1] 4.668247e-310
collapse::fmode(numeric(0))      # Output: [1] 4.668247e-310
collapse::fvar(numeric(0))       # Output: [1] 0 (but the equivalent 'stats::var(numeric(0))' returns NA
collapse::fsd(numeric(0))        # Output: [1] 0 (but the equivalent 'stats::sd(numeric(0))' returns NA
collapse::fmin(numeric(0))       # Segfault: address 0x55ef52e99ff8, cause 'memory not mapped'
collapse::fmax(numeric(0))       # Segfault: address 0x5586c9c93ff8, cause 'memory not mapped'
collapse::fnth(numeric(0))       # Output: [1] 4.668247e-310
collapse::ffirst(numeric(0))     # Output: [1] 4.668247e-310
collapse::flast(numeric(0))      # Output: [1] 0 (inconsistent data types compared to 'ffirst()')
collapse::fNobs(numeric(0))      # Output: [1] 0
collapse::fNdistinct(numeric(0)) # Output: [1] 0

fNobs() and fNdistinct() both return the expected output. For the others, as I've commented, they either:

  1. Cause a crash.
  2. Inconsistent output compared to the stats package (e.g. stats::median(numeric(0)) returns NA, not 0).
  3. Internally inconsistent output (e.g. ffirst() and flast() return different data types).

I've attached a gdb session with the backtrace for the segfault with fsum().
debug_session.txt

Session info:

R version 4.0.3 (2020-10-10)
Platform: x86_64-pc-linux-gnu (64-bit)
Running under: Debian GNU/Linux bullseye/sid

Matrix products: default
BLAS:   /usr/lib/x86_64-linux-gnu/blas/libblas.so.3.9.0
LAPACK: /usr/lib/x86_64-linux-gnu/lapack/liblapack.so.3.9.0

locale:
 [1] LC_CTYPE=C.UTF-8          LC_NUMERIC=C
 [3] LC_TIME=en_IL.utf8        LC_COLLATE=en_IL.utf8
 [5] LC_MONETARY=en_IL.utf8    LC_MESSAGES=en_IL.utf8
 [7] LC_PAPER=en_IL.utf8       LC_NAME=C
 [9] LC_ADDRESS=C              LC_TELEPHONE=C
[11] LC_MEASUREMENT=en_IL.utf8 LC_IDENTIFICATION=C

attached base packages:
[1] stats     graphics  grDevices utils     datasets  methods   base

loaded via a namespace (and not attached):
[1] compiler_4.0.3           parallel_4.0.3           RcppArmadillo_0.10.1.2.0
[4] Rcpp_1.0.5               collapse_1.4.2

Package compiled with gcc:

gcc (Debian 10.2.0-19) 10.2.0
Copyright (C) 2020 Free Software Foundation, Inc.
This is free software; see the source for copying conditions.  There is NO
warranty; not even for MERCHANTABILITY or FITNESS FOR A PARTICULAR PURPOSE.

No "ss<-" function: Alternatives or suggestions?

Dear Seb,

Thanks for a super useful package. It's saved me a lot of time.

Here's a point where I am stuck in trying to employ collapse's functions to make my code faster. How do I replace a subset of a dataframe (speed being priority)?

I've racked my head against a wall for a few days now, and can't seem to find a way to do this using the functions provided in collapse.

For example, Big_DF[logical_indexes] <- Little_DF

Would you have any input towards this issue?

Would kindly appreciate your input if possible.

Many thanks,
Abhishek.

Suggestion for sf vignette

Hi Sebastian,

Congrats on the new release. I'm digging the new sf integration. Speaking of which...

In the sf vignette you write: "It needs to be noted here that typically most of the time in aggregation is consumed by st_union so that the speed of collapse does not really become visible on most datasets."

There's one exception to this rule that you may want to highlight. Namely, in panel data where you want to aggregate over time values of the same geometry. In such cases, you can simply use the first geometric observation per group (since it's repeated) and this will make it much quicker than st_union(). It's a trick that I sometimes use when manipulating sf objects as data.tables and appears to carry over nicely here. Example:

library(sf)
library(tidyverse)
library(data.table)
library(collapse)
library(microbenchmark)

nc = st_read(system.file("shape/nc.shp", package = "sf"), quiet = TRUE)

## First create a (very!) short panel of our NC data, recording births in each
## county in 1974 and 1979
ncl =
    nc |>
    fselect(county = NAME, BIR74, BIR79) |> 
    gather(year, births, BIR74, BIR79) |> 
    ftransform(year = as.integer(gsub("BIR", "19", year))) |> 
    roworder(county, year)

ncl
#> Simple feature collection with 200 features and 3 fields
#> Geometry type: MULTIPOLYGON
#> Dimension:     XY
#> Bounding box:  xmin: -84.32385 ymin: 33.88199 xmax: -75.45698 ymax: 36.58965
#> Geodetic CRS:  NAD27
#> First 10 features:
#>       county year births                       geometry
#> 1   Alamance 1974   4672 MULTIPOLYGON (((-79.24619 3...
#> 2   Alamance 1979   5767 MULTIPOLYGON (((-79.24619 3...
#> 3  Alexander 1974   1333 MULTIPOLYGON (((-81.10889 3...
#> 4  Alexander 1979   1683 MULTIPOLYGON (((-81.10889 3...
#> 5  Alleghany 1974    487 MULTIPOLYGON (((-81.23989 3...
#> 6  Alleghany 1979    542 MULTIPOLYGON (((-81.23989 3...
#> 7      Anson 1974   1570 MULTIPOLYGON (((-79.91995 3...
#> 8      Anson 1979   1875 MULTIPOLYGON (((-79.91995 3...
#> 9       Ashe 1974   1091 MULTIPOLYGON (((-81.47276 3...
#> 10      Ashe 1979   1364 MULTIPOLYGON (((-81.47276 3...

## data.table version
ncl_dt = as.data.table(ncl)

## Benchmarks

microbenchmark(
    dplyr = ncl |> 
        group_by(county, year) |> 
        summarise(mean_births = mean(births)),
    
    datatable_union = ncl_dt[,
                             .(mean_births = mean(births), 
                               geometry = st_union(geometry)),
                             by = .(county, year)],
    
    datatable_first = ncl_dt[,
                             .(mean_births = mean(births), 
                               geometry = data.table::first(geometry)),
                             by = .(county, year)],
    
    collapse_union = ncl |> 
        fgroup_by(county, year) |> 
        fsummarise(mean_births = fmean(births),
                   geometry = st_union(geometry)),
    
    collapse_first = ncl |> 
        fgroup_by(county, year) |> 
        fsummarise(mean_births = fmean(births),
                   geometry = ffirst(geometry)),
    
    times = 2
)
#> Unit: microseconds
#>             expr        min         lq       mean     median         uq         max neval cld
#>            dplyr 749877.901 749877.901 752414.346 752414.346 754950.790  754950.790     2   c
#>  datatable_union 704897.821 704897.821 708573.421 708573.421 712249.022  712249.022     2  b 
#>  datatable_first   3789.810   3789.810   6139.954   6139.954   8490.099    8490.099     2 a  
#>   collapse_union 724663.886 724663.886 739028.508 739028.508 753393.130  753393.130     2  bc
#>   collapse_first    154.334    154.334    198.569    198.569    242.804     242.804     2 a

Created on 2021-07-26 by the reprex package (v2.0.0)

PS. Just to show that it's generating valid geometries:

ncl |> 
    fgroup_by(county, year) |> 
    fsummarise(mean_births = fmean(births),
               geometry = ffirst(geometry)) |> 
    ggplot(aes(fill = mean_births)) + 
    geom_sf() + 
    scale_fill_viridis_c() +
    theme_minimal()

How to specify using column names

Is there some way of writing this using column names but without writing them all out:

collap(airquality, Ozone + Solar.R + Wind + Temp ~ Month)

This works but does not use names:

collap(airquality, ~ Month, custom = list(fmean = 1:4))

In dplyr it gets around this by allowing one to use Ozone:Temp to indicate the first 4 columns.

Here is another example.

DF <- structure(list(Data = c("D1", "D2", "D1", "D2", "D1", "D2", "D1", 
"D2", "D1", "D2"), A = c("Yes", "No", "Weak No", "No", 
"Weak Yes", "No", "No", "Weak Yes", "Weak No", "No"), B = c("Yes", 
"No", "No", "Yes", "No", "No", "No", "No", "No", "No"), C = c("No", 
"Yes", "No", "No", "No", "No", "Yes", "No", "Yes", "No")), class = "data.frame", row.names = c(NA, -10L))

which looks like t his:

> DF
   Data        A       B       C
1    D1      Yes     Yes      No
2    D2       No      No     Yes
3    D1  Weak No      No      No
4    D2       No     Yes      No
5    D1 Weak Yes      No      No
6    D2       No      No      No
7    D1       No      No     Yes
8    D2 Weak Yes      No      No
9    D1  Weak No      No     Yes
10   D2       No      No      No

Now calculate the number of Yes values for each value of A. The first one works but I would have liked to specify names rather than column numbers. The second one works but would be tedious if there were many columns and not just B and C and seems less general than the first one.

# column 1 is Data.  column 2 is A.
collap(+(DF[-(1:2)] == "Yes"), DF$A, FUN = fsum)

collap(+(DF[c("B", "C")] == "Yes"), DF$A, FUN = fsum)

giving:

         A B C
1       No 1 2
2  Weak No 0 1
3 Weak Yes 0 0
4      Yes 1 0

In dplyr this would have been done like this:

DF %>% group_by(A) %>% summarize(across(B:C, ~ sum(. == "Yes")))

Feature request: lag/lead fill gaps?

Hi

it would be great if flag/L and F could allow gaps in the timevar? Maybe add an argument fill_gaps=FALSE (for backward compatibility), and when TRUE add fill value for the gaps, instead of stopping?

library(collapse)
#> collapse 1.1.0, see ?`collapse-package` or ?`collapse-documentation`
#> 
#> Attaching package: 'collapse'
#> The following object is masked from 'package:stats':
#> 
#>     D
data(wlddev)

head(L(wlddev, 1, ~iso3c, ~year, cols="LIFEEX"))
#>   iso3c year L1.LIFEEX
#> 1   AFG 1960        NA
#> 2   AFG 1961    32.292
#> 3   AFG 1962    32.742
#> 4   AFG 1963    33.185
#> 5   AFG 1964    33.624
#> 6   AFG 1965    34.060

## would be nice if this works too:
head(L(wlddev[-3,], 1, ~iso3c, ~year, cols="LIFEEX"))
#> Error in L.data.frame(wlddev[-3, ], 1, ~iso3c, ~year, cols = "LIFEEX"): Gaps in timevar within one or more groups

## Should give: 
dat_complete <- tidyr::complete(wlddev[-3, c("iso3c", "year", "LIFEEX")], iso3c, year= 1960:2018)
head(subset(L(dat_complete, 1, ~iso3c, ~year, cols="LIFEEX"), iso3c=="AFG"))
#> # A tibble: 6 x 3
#>   iso3c  year L1.LIFEEX
#>   <fct> <int>     <dbl>
#> 1 AFG    1960      NA  
#> 2 AFG    1961      32.3
#> 3 AFG    1962      32.7
#> 4 AFG    1963      NA  
#> 5 AFG    1964      33.6
#> 6 AFG    1965      34.1

Created on 2020-05-03 by the reprex package (v0.3.0)

doc variable.wise in ?fhdbetween

In ?fhdbetween we have:

variable.wise data.frame methods: Setting variable.wise = TRUE will process each column individually i.e. use all non-missing cases in each column and in fl (fl is only checked for missing values if na.rm = TRUE). [...]

-> this argument is available for pdata.frames as well, so I suggest to start explanation with "(p)data.frame methods ...".

I would find column.wise a more intutive name as it expresses what it is about (and may be closer to a programming/data structure point of view. However, statisticans like to put their "variables" (in general, that is a very broad term) into columns of matrices/data frames).

My little suggestion

Hi developer,

I am a user of dplyr and data.table, and it's very interesting to find an R package seems to have better performance than data.table. I saw there are many functions provided by this package and it's very hard and great work! After I check the function names, I have a little suggestion, maybe the whole package (not a part of it) should use a very consistent way to define function names. From the cheat sheet, I saw you mix ., snakecase and camel case in function names. In this case, I would use some of the functions (for performance) to get my work done but I would not like to spend my time to get familiar with the self-contained data processing ecosystem you built. I didn't say this package is not good, what I want to express is that this package has the potential to be great, similar to data.table.

Best,
Shixiang

Vignettes

I noticed the Vignettes were removed from the package and outsourced to a website due to their size.

Maybe you want to put a placeholder vignette linking to the vignettes on the website so that on collapse's CRAN page the Vignette field has an entry point to the real Vignettes? The Vignettes are incredibly helpful and well written. I suspect people might oversee them, esp. when they evaluate the CRAN webpage of collapse.

num_vars, cat_vars and columns that are all NA

If a column in a data frame is all NA then you have to be very careful to use NA_real_ or NA_integer_ when setting it if you want it fetched using num_vars and not when using cat_vars.

One idea is to raise a warning if there are any logical columns containing all NA or perhaps just put a warning in the help file.

speed of fsd

I tried benchmarking fsd and sd ran faster.

> library(microbenchmark)
> x <- 1:1e6
> microbenchmark(sd = sd(x), fsd = fsd(x))
Unit: milliseconds
 expr     min       lq     mean   median       uq      max neval cld
   sd 17.2881 19.88775 24.05444 20.87300 21.86765  69.5896   100  a 
  fsd 28.5483 30.28625 41.80759 31.44415 32.15310 489.9944   100   b

Speed up plm::pmg with collapse

I have a large panel data that I need to use the plm::pmg function. The pmg function is pretty slow for my data. Does using your collapse package make the pmg functions faster?

Recommend Projects

  • React photo React

    A declarative, efficient, and flexible JavaScript library for building user interfaces.

  • Vue.js photo Vue.js

    ๐Ÿ–– Vue.js is a progressive, incrementally-adoptable JavaScript framework for building UI on the web.

  • Typescript photo Typescript

    TypeScript is a superset of JavaScript that compiles to clean JavaScript output.

  • TensorFlow photo TensorFlow

    An Open Source Machine Learning Framework for Everyone

  • Django photo Django

    The Web framework for perfectionists with deadlines.

  • D3 photo D3

    Bring data to life with SVG, Canvas and HTML. ๐Ÿ“Š๐Ÿ“ˆ๐ŸŽ‰

Recommend Topics

  • javascript

    JavaScript (JS) is a lightweight interpreted programming language with first-class functions.

  • web

    Some thing interesting about web. New door for the world.

  • server

    A server is a program made to process requests and deliver data to clients.

  • Machine learning

    Machine learning is a way of modeling and interpreting data that allows a piece of software to respond intelligently.

  • Game

    Some thing interesting about game, make everyone happy.

Recommend Org

  • Facebook photo Facebook

    We are working to build community through open source technology. NB: members must have two-factor auth.

  • Microsoft photo Microsoft

    Open source projects and samples from Microsoft.

  • Google photo Google

    Google โค๏ธ Open Source for everyone.

  • D3 photo D3

    Data-Driven Documents codes.