This repository contains useful tips/tricks/scripts that I have picked up over the years. The are scripts written in
- bash
- awk
- perl
- R
- python3
Some of the scripts have been written by my collaborators: Cesar Poot UNAM Bruno Contreras EMBL. Carlos Cantalapiedra
Before using any of the scripts make sure that you have install the following dependencies
sudo apt-get install python3 python3-pip python3-matplotlib \
ipython3-notebook python3-mpltoolkits.basemap
sudo pip3 install -U pip
sudo -H pip3 install --upgrade pandas numpy scipy seaborn
sudo -H pip3 install -U scikit-learn
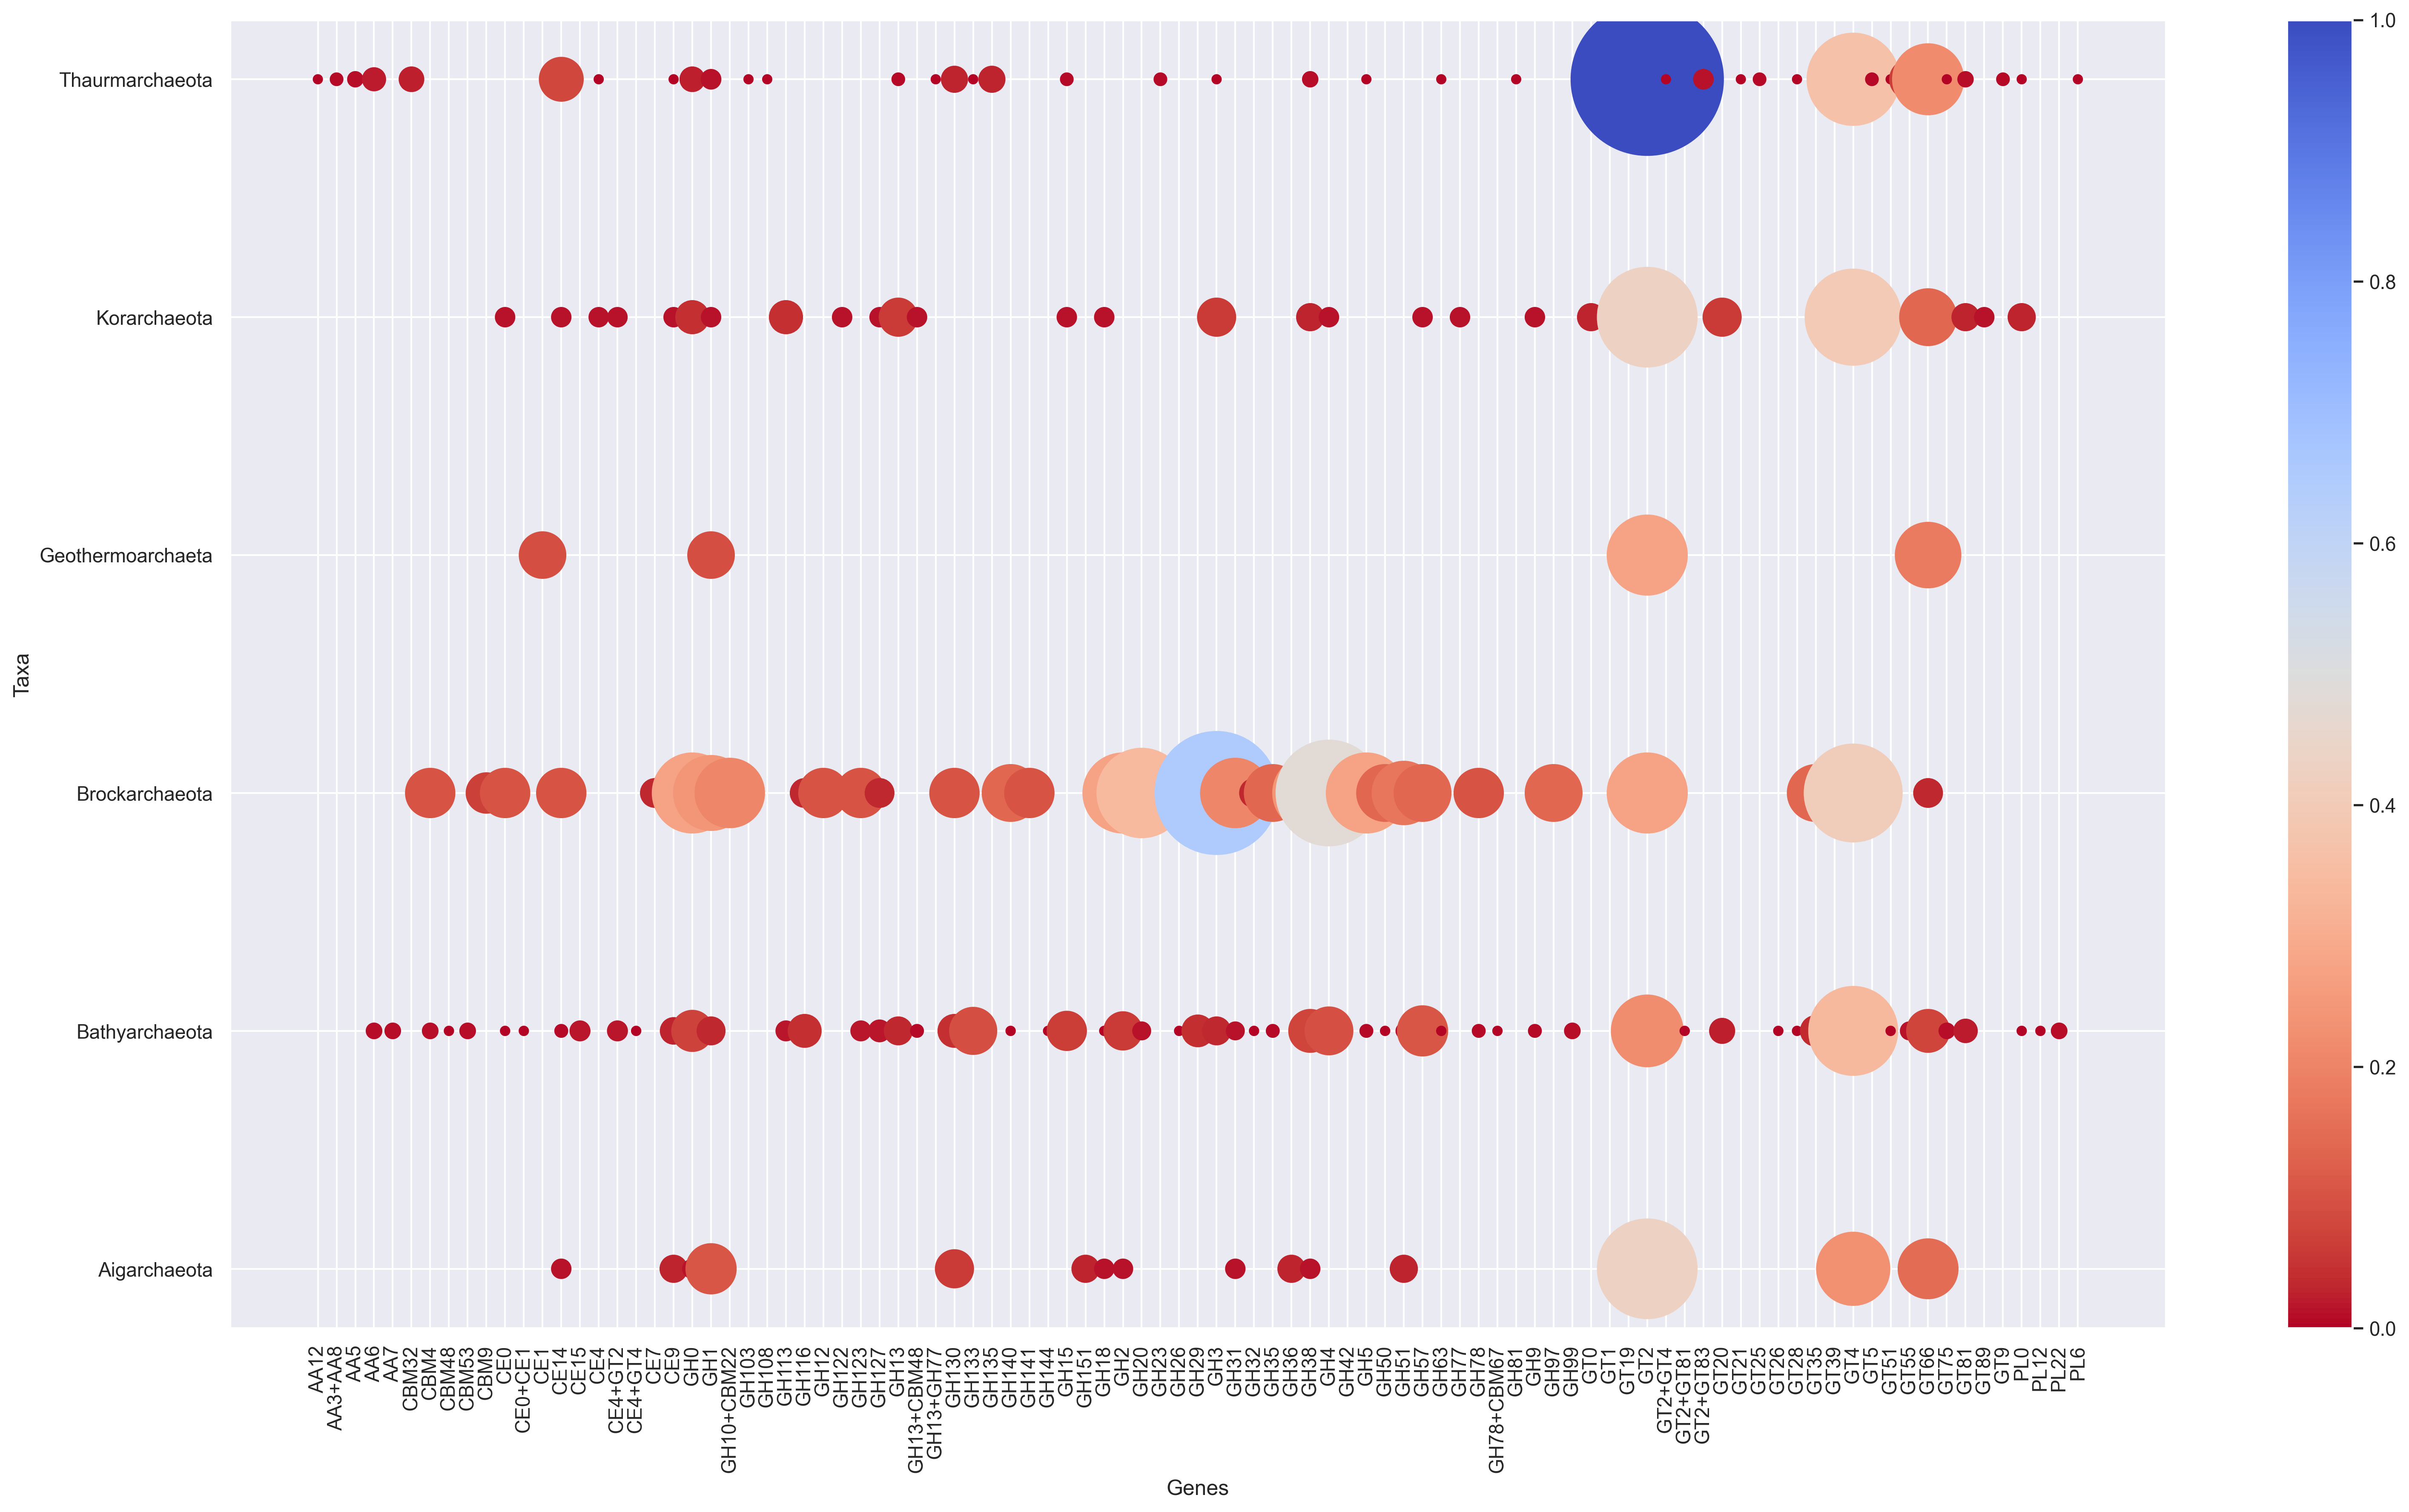
Scrip to create a bubble chart from any dataframe contanining either normalized or absolute values.
usage: bubble_chart.py [-h] [-im_format {png,pdf,ps,eps,svg,tif,jpg}]
                       [--im_res dpi]
                       filename

positional arguments:
  filename              Input file dataframe i.e abundances profile

optional arguments:
  -h, --help            show this help message and exit
  -im_format {png,pdf,ps,eps,svg,tif,jpg}, -f {png,pdf,ps,eps,svg,tif,jpg}
                        Output format for images [png].
  --im_res dpi, -r dpi  Output resolution for images in dot per inch (dpi)
                        [dpi].
Running Bubble plot with example data
python3 bubble_chart.py data_bubbleplot.tab -f png -r 300Customize your script
sns.set(font_scale=1) #change font size
sns.set_style("whitegrid") #whitegrid to change background to white
plt.figure(figsize=(21,12)) #inches, modify to widen (x) or lengthen (y) --> original was 21,12
plt.tight_layout() #keeps axes names in same figure
bubble_super_mega_and_simpe_plot(df, 20, cmap='bone_r', ylabel='Tax Group (# of genomes)', xlabel='Genes',alpha=0.05)
# alpha = transparency
#cmap= color palete see below

#Recomended colors

cmap='bone_r'
cmap='plasma'
cmap='coolwarm_r'

#cmap python = see https://matplotlib.org/3.1.0/tutorials/colors/colormaps.html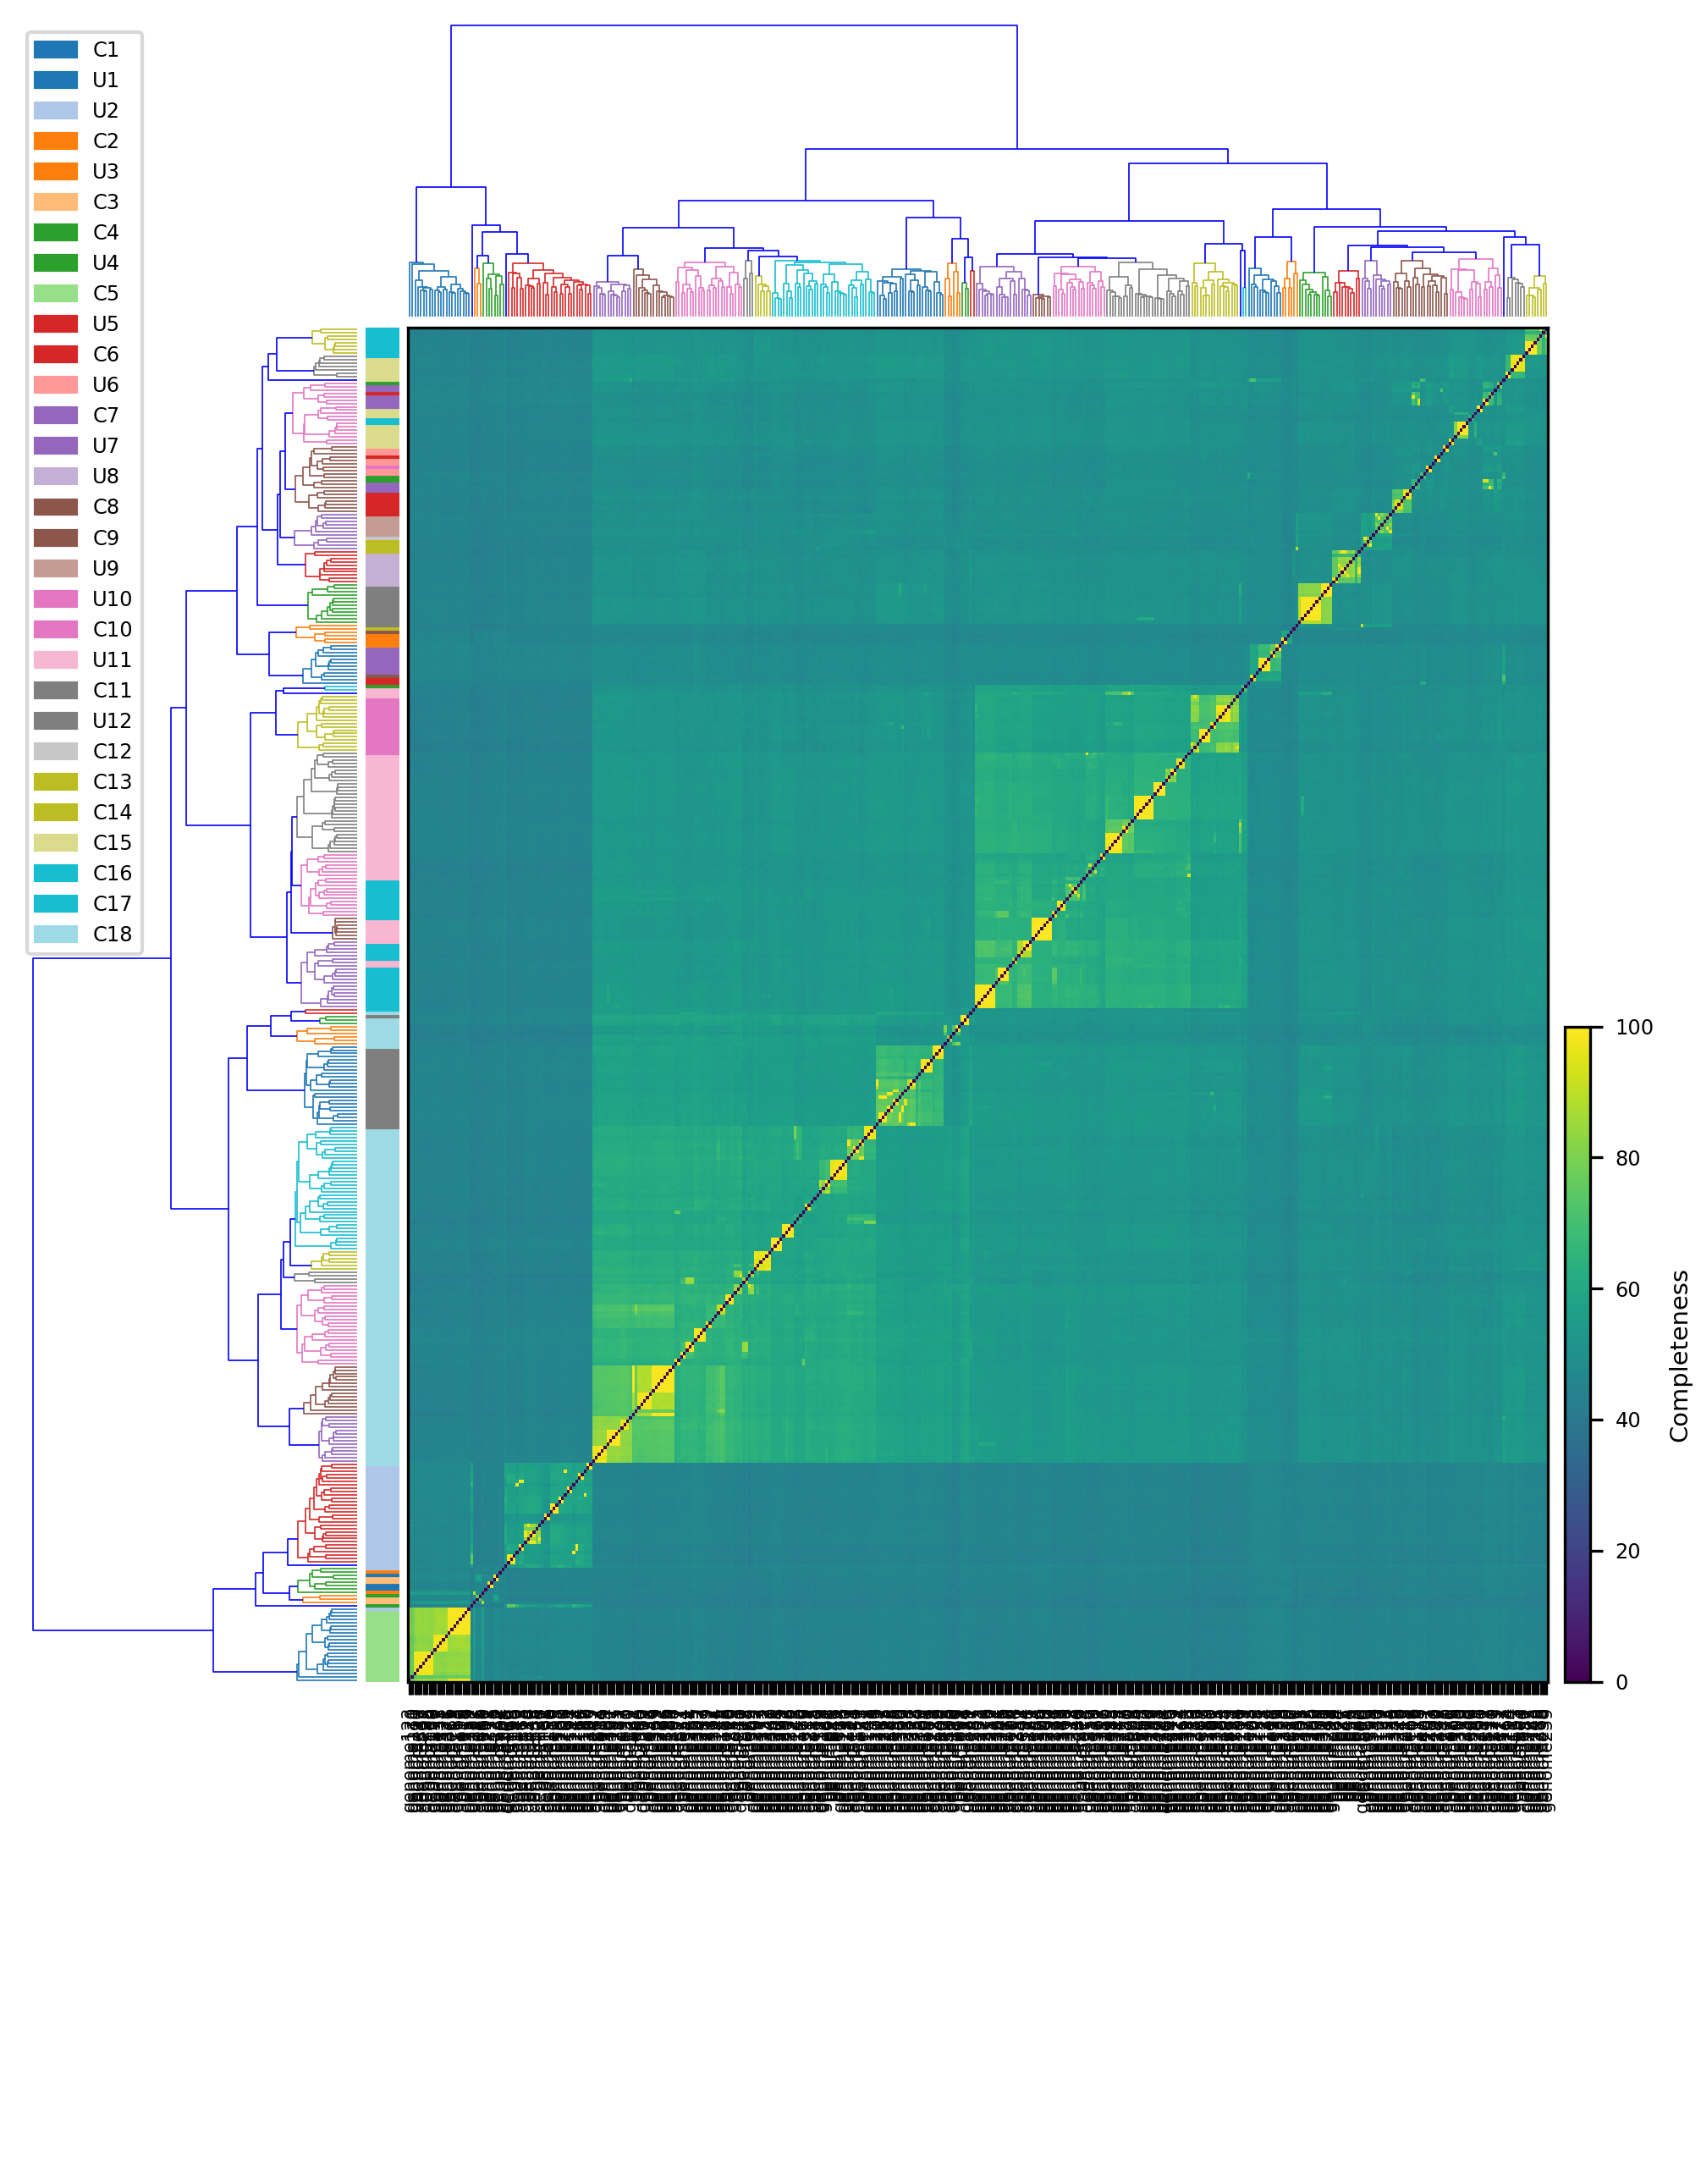
python3 heatmap.py -h

usage: heatmap.py [-h] [-f {png,pdf,ps,eps,svg,tif,jpg}] [-r dpi] filename

 This script create a cluster map

positional arguments:
  filename              Input file derived mebs_output with classification

optional arguments:
  -h, --help            show this help message and exit
  -f {png,pdf,ps,eps,svg,tif,jpg}, --im_format {png,pdf,ps,eps,svg,tif,jpg}
                        Output format for images [png].
  -r dpi, --im_res dpi  Output resolution for images in dot per inch (dpi)
                        [dpi].

Example:
    $  python3 heatmap.py data.heatmap.tsv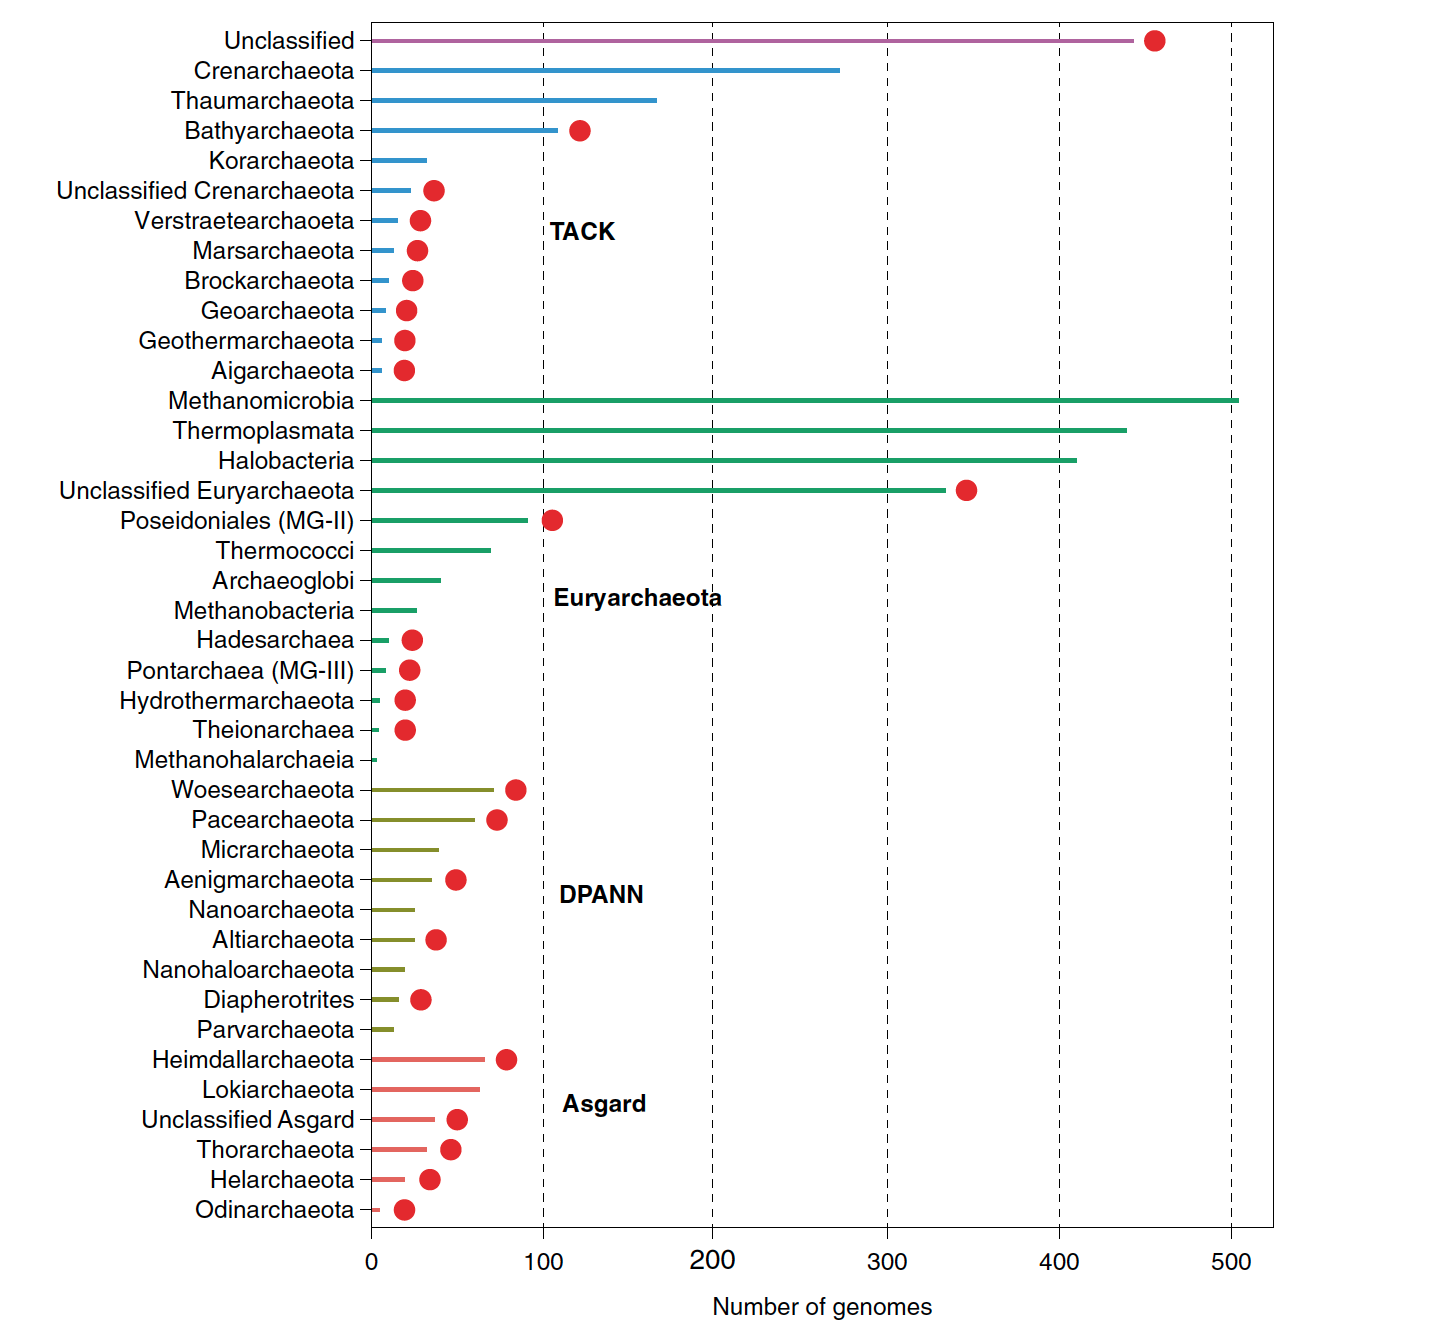
R script that was used to plot the number of achaeal genomes by taxonomy described in Baker et al., 2020
The input data data_barplot.tab, looks like this, the scripts keeps the specific order that you want your data to sorted. Dr. Craig Connolly provided valuable input to generate the script.
Phylum	Superphylum	Number of genomes
Heimdallarchaeota	Asgard	66
Lokiarchaeota 	Asgard	63
Unclassified_Asgard	Asgard	37
Thorarchaeota	Asgard	32
Helarchaeota	Asgard	19
barplot.R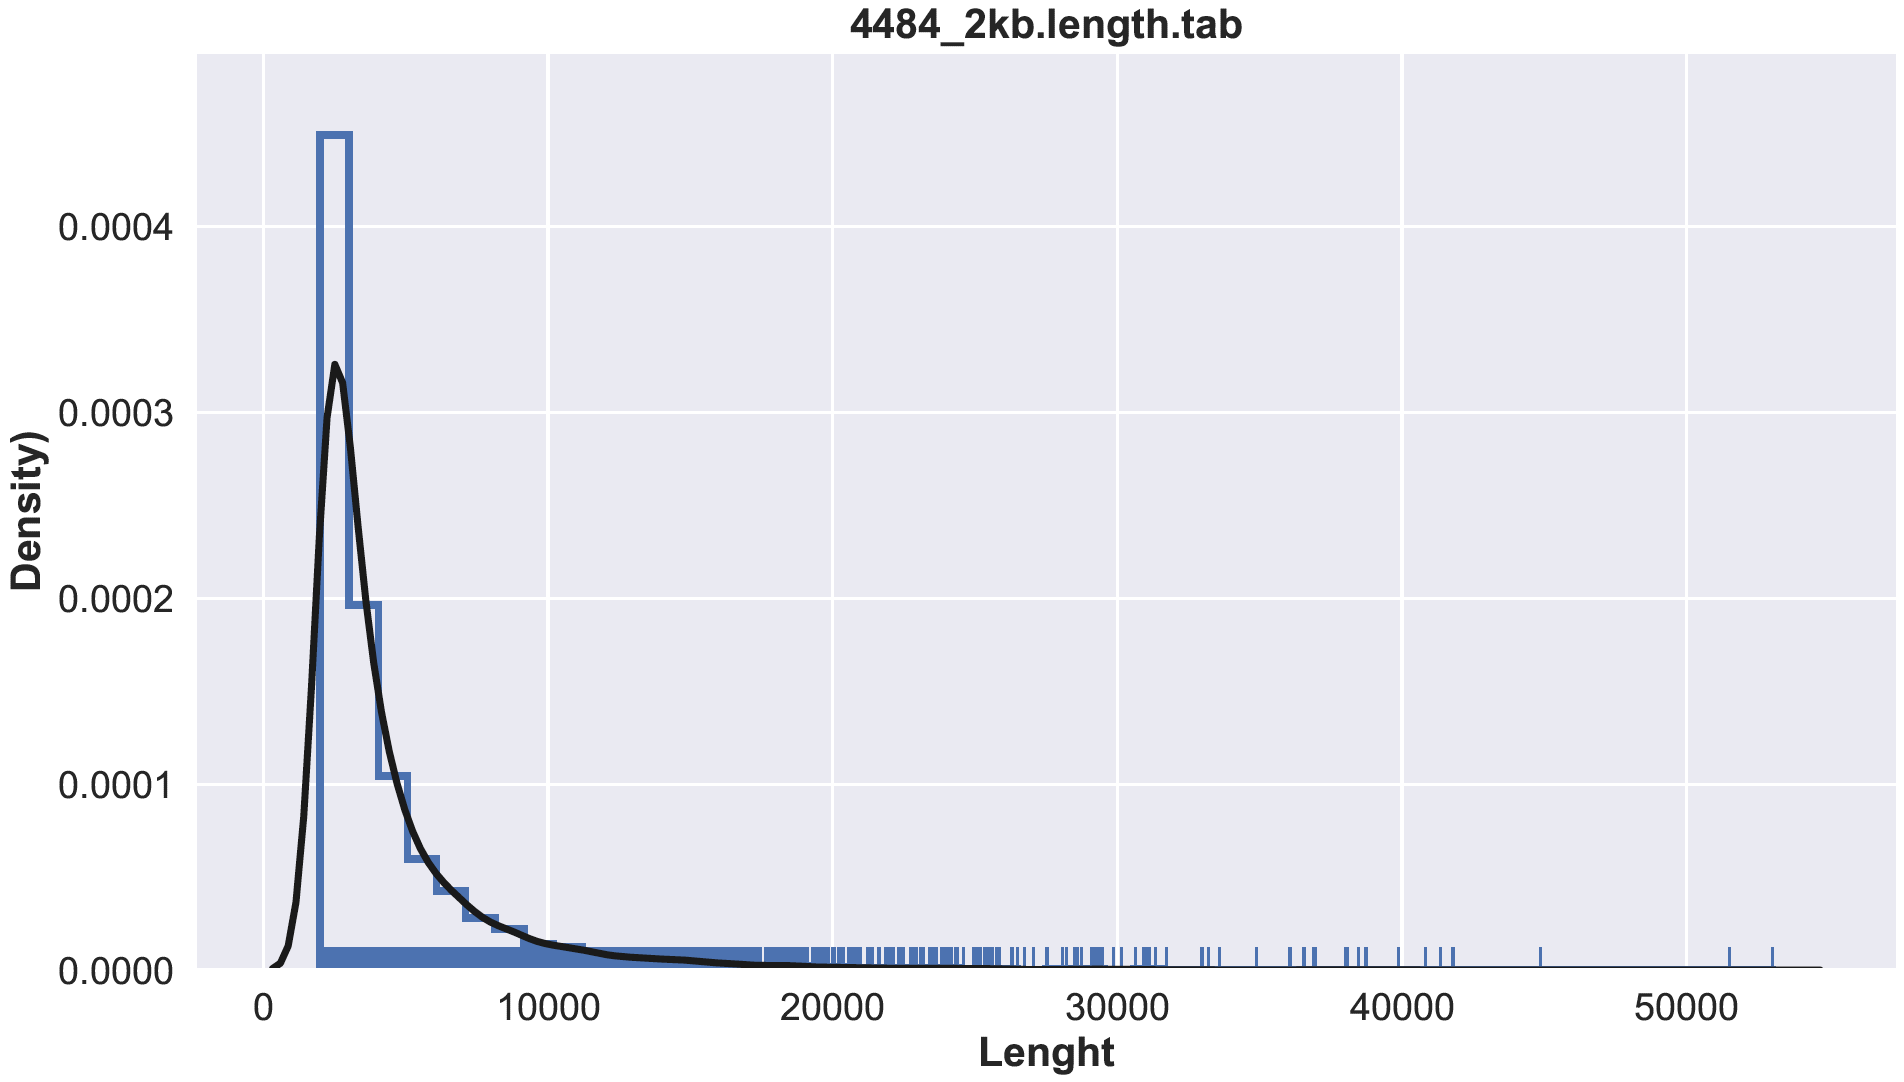
Compute the lenght
seqkit fx2tab --length --name --header-line sample.contigs.fa >> sample.length.tab
less sample.lenght.tab

name    length
4484_scaffold_11179     2148
4484_scaffold_8359      2609
4484_scaffold_3616      4460
4484_scaffold_7824      2728
4484_scaffold_6736      3024
4484_scaffold_9058      2482
4484_scaffold_8774      2534
4484_scaffold_4047      4173
4484_scaffold_9826      2344
usage: hist.py [-h] [-im_format {png,pdf,ps,eps,svg,tif,jpg}] [--im_res dpi]
               filename

positional arguments:
  filename              lenght file

optional arguments:
  -h, --help            show this help message and exit
  -im_format {png,pdf,ps,eps,svg,tif,jpg}, -f {png,pdf,ps,eps,svg,tif,jpg}
                        Output format for images [pdf].
  --im_res dpi, -r dpi  Output resolution for images in dot per inch (dpi)
                        [dpi].

Example:
$  python3 histplot.py  sample.lenght tab
perl Replace_tree_names.pl mapping_file tree > renamed_treeRequires biopython
pip3 install biopythonScript that is useful if you have a large fasta file and you want to split it into small files of the same size
python3 split_fasta.py

usage: split_fasta.py [-h] [-p PARTS] fastafile

Split a fasta file according in almost equal parts based on total base/residue
count. Stores a numpy array that contains the lengths of the sequences in the
file

positional arguments:
  fastafile             Fasta file to split

optional arguments:
  -h, --help            show this help message and exit
  -p PARTS, --parts PARTS
Number of parts to slice the file [10]If you have a directory contanining fasta files (fa: either faa or fna) compute several stats, that are important when describing MAGs See Table 1 Preprint De Anda et al., 2020
for i in *.fa; do seqkit stat $i  >> stats; done
for i in *.fa ; do perl gc.pl $i >$i.gc.tab ; done

#Sum the scaffold GC and get the average

for i in *.tab; do awk '{sum+= $2; n++ } END { if (n > 0) print sum / n; }' $i > $i.GC.average ; done
Option 1 awk
Obtained from here
cat file.fa | awk '$0 ~ ">" {if (NR > 1) {print c;} c=0;printf substr($0,2,100) "\t"; } $0 !~ ">" {c+=length($0);} END { print c; }' awk '$0 ~ ">" {if (NR > 1) {print c;} c=0;printf substr($0,2,100) "\t"; } $0 !~ ">" {c+=length($0);} END { print c; }' file.faOption 2 Seqkit
seqkit fx2tab --length --name --header-line file.fa >> file.lenght Option3 samtools
samtools faidx file.fa | cut -f1-2 file.fa.fai > file.lenght.tabFrom this
> header 1
ATGCAATGCATG
ATGCCCGGTAGT
TTATAGAGATAG
to this
> header 1
ATGCAATGCATGATGCCCGGTAGTTTATAGAGATAG
perl -lne 'if(/^(>.*)/){ $head=$1 } else { $fa{$head} .= $_ } END{ foreach $s (sort(keys(%fa))){ print "$s\n$fa{$s}\n" }}' file.fa > file1ne.fa perl -lne 'if(/^(>.*)/){$h=$1}else{$fa{$h}.=$_} END{ foreach $h (keys(%fa)){$m+=length($fa{$h})}; printf("%1.0f\t",$m/scalar(keys(%fa))) }' file.faIn this case we are keeping sequences >100 bp
perl -lne 'if(/^(>.*)/){ $head=$1 } else { $fa{$head} .= $_ } END{ foreach $s (keys(%fa)){ print "$s\n$fa{$s}\n" if(length($fa{$s})>100) }}' file.fa > file100.fa perl -lne 'if(/^>(\S+)/){ print ">$ARGV $1"} else{ print }' file.fa > file_renamed.fa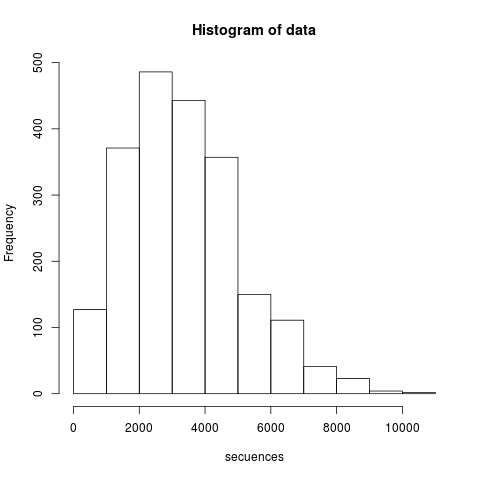
Let's suppose that you have thousands of genomes and you want to compare the total number of sequences in your genomic dataset. If all your genomes are either .faa or .fna extension, you can use the following one-line command to count the number of sequences and generate a histogram. You can change the figure to pdf, just change pdf("seq.pdf");
grep -c ">" *.faa | sed 's/:/\t/g' | cut -f 2 | Rscript -e 'data=abs(scan(file="stdin")); png("seq.png"); hist(data,xlab="secuences")'It requires a list of headeres to remove from a fasta file
Option 1 python script
python3 remove_sequences.py file.fa sequence_to_remove.txt > file_filtered.fa Option 2 grep
grep -v -f sequence_to_remove.txt file.fa > file_filtered.fa Option 1 pullseq
pullseq -i file.fa -n sequences_to_extract.txt > extracted_sequences.faOption 2 samtools
cat sequences_to_extract.txt | xargs -n 1 samtools faidx file.fa >> extracted_sequences.fa Option 3 bedtools
Extract fasta with coordinates
sreformat fasta file.fa > file.reformat.fna
bedtools getfasta -fi file.reformat.fna -bed sequences_to_extract_coordinates.tab -fo file_out.fa- Create a list of PFAM identifiers
head identifiers.txt

PF13243
PF13249
PF02458- Run the following commands, originally created by Dr. Carlos Cantalapiedra and incorporated in MEBS
cat identifieres.txt | while read  pfam; do
desc=$(curl http://pfam.xfam.org/family/"$pfam"/desc | head -1);
printf "$pfam\t";
printf "$desc\n";
done 2> /dev/null \
> identifiers.desc.tabTake a column of 1 file and another column from another file and create a new file with those columns No need for matching column
paste <(awk '{print $1}' file1.txt ) <(awk '{print $2}' file2.txt ) > file3.txtfor next in $(cat ftp_GCA_download.txt); do wget "$next"; done
or you can do wget -i ftp_GCA_download.txtawk 'x[$1]++ == 1 { print $1 " is duplicated"}'cut -f2,3 file1.txt > file2.txtsed '/pattern/ s/^/replace_pattern/' file.txtsed 's/pattern/replace_pattern/2' file.txtThis is very useful if you have a long header in fasta sequences and you want to get rid of all the characters that aren't useful
sed 's/\s.*$//' file.fa > file2.faIn a file of 2 columns, if 2nd column of file is blank, print 1st column followed by "Your Words", otherwise print 1st and 2nd column, create new file of all this output
awk '{if (!$2) {print $1,"YourWords"} else {print $1, $2}}' > file.tsvGenome browse overview https://www.ncbi.nlm.nih.gov/genome/browse/#!/overview/
Genbank assembly summary file
wget http://ftp.ncbi.nlm.nih.gov/genomes/genbank/assembly_summary_genbank.txtGet the complete and latest genomes from assembly summary genbank
awk -F "\t" '$12=="Complete Genome" && $11=="latest"{print $20}' assembly_summary_genbank.txtConda is required to use Entrez this way.
#Create an environment in which you can add Entrez Direct
conda create --name entrez

#Activate this new environment
conda activate entrez

#Install Entrez
conda install -c bioconda entrez-direct

#Compile a list of Accession numbers from NCBI (PROTEINS)

less list.txt

ABO08866.1
AFA39020.1
AFA39042.1
AFI78392.1
AOQ24367.1
APC08827.1
ATY72478.1

#Change file to comma separated instead of column
cat list.txt | tr "\n" "," | sed 's/,$//' > list.csv

less list.csv

ABO08866.1,AFA39020.1,AFA39042.1,AFI78392.1,AOQ24367.1,APC08827.1,ATY72478.1

#Make a usable script from the list

sed 's/^/efetch -db protein -format fasta -id /' list.csv > list.sh

less list.sh

efetch -db protein -format fasta -id ABO08866.1,AFA39020.1,AFA39042.1,AFI78392.1,AOQ24367.1,APC08827.1,ATY72478.1

#Run the new script
bash list.sh > list.faModified from Huan Fan's github
- Create an alias in your .bash_profile or .bashrc file with the information of your server
alias server_jupyter='ssh -p XX -L 8000:localhost:8888 [email protected]. XXX'- Once in your server set a secure password to acess your notebooks
jupyter notebook password
- Start jupyter on the remote server
jupyter notebook
- It asks you whether you “Accepting one-time-token-authenticated connection from 127.0.0.1”. I answered ‘__A__laways’ but next time it kept asking me… Then it complains:
	Jupyter Notebook requires JavaScript.
   		Please enable it to proceed.
- Just ingore it buy entering Q. Then your token would be given on the last line, some thing like:
http://localhost:8888/?token=5640c991ffc0c0c6071e9f0d0100d7204e4b05a6d400c440
- Access from your local browser Replace 8888 with 8000, since the later is the port we opened for your local machine, so go to
http://localhost:8000/?token=5640c991ffc0c0c6071e9f0d0100d7204e4b05a6d400c440
on your local browser and you are ready to go!
You can use
or
After searching several options including this package in R, I came across a super friendly to use plattfrom taxonkit - A Cross-platform and Efficient NCBI Taxonomy Toolkit
After installing it, download and uncompress these NCBI taxonoomy file
ftp://ftp.ncbi.nih.gov/pub/taxonomy/taxdump.tar.gz
I downloaded and tar -xvzf the directory in /home/valdeanda/DB/TAXID
Your input file, in this case IDs.txt should look like this
02125
1111708
111780
111781
1147
1284629
165597
1666905
1807358
1827144
1920663
1925591
1933929
To run taxonkit run this
taxonkit lineage --data-dir /home/valdeanda/DB/TAXID/ IDs.txt > IDs.taxonomy.tab
Many options are available here, the one that works for me is this one
while read line
do
    if [[ ${line:0:1} == '>' ]]
    then
        outfile=${line:1:11}.fa
        echo $line > $outfile
    else
        echo $line >> $outfile
    fi
done < myseq.fa