Giter Site home page Giter Site logo

fastplotlib / fastplotlib Goto Github PK

View Code? Open in Web Editor NEW
325.0 8.0 33.0 19.38 MB

Next-gen fast plotting library running on WGPU using the pygfx rendering engine

Home Page: https://fastplotlib.readthedocs.io/

License: Apache License 2.0

Python 100.00%
gpu scientific-visualization visualization vulkan webgpu wgpu pygfx interactive-visualizations fast-visualization

fastplotlib's Introduction

logo


CI PyPI version Documentation Status

Installation | GPU Drivers | Documentation | Examples | Contributing

Next-gen plotting library built using the pygfx rendering engine that can utilize Vulkan, DX12, or Metal via WGPU, so it is very fast! fastplotlib also aims to be an expressive plotting library that enables rapid prototyping for large scale explorative scientific visualization.

scipy-fpl

SciPy 2023 Talk

fpl_thumbnail

Note that the API is currently evolving quickly. We recommend using the latest notebooks from the repo but the general concepts are similar to those from the API shown in the video.

Supported frameworks

fastplotlib can run on anything that pygfx can also run, this includes:

✔️ Jupyter lab, using jupyter_rfb
✔️ PyQt and PySide
✔️ glfw
✔️ wxPython

Notes:
✔️ Non-blocking Qt/PySide output is supported in ipython and notebooks by using %gui qt. This must be called before importing fastplotlib! :grey_exclamation: We do not officially support jupyter notebook through jupyter_rfb, this may change with notebook v7
😞 jupyter_rfb does not work in collab, see vispy/jupyter_rfb#77

Note

fastplotlib is currently in the alpha stage with breaking changes every ~month, but you're welcome to try it out or contribute! See our Roadmap. See this for a discussion on API stability: #121

Documentation

http://fastplotlib.readthedocs.io/

The Quickstart guide is not interactive. We recommend cloning/downloading the repo and trying out the desktop or notebook examples: https://github.com/kushalkolar/fastplotlib/tree/main/examples

If someone wants to integrate pyodide with pygfx we would be able to have live interactive examples! 😃

Questions, issues, ideas? Post an issue or post on the discussion forum!

Installation

Install using pip.

Minimal, use with your own Qt or glfw applications

pip install fastplotlib

This does not give you Qt or glfw, you will have to install one of them yourself depending on your preference.

Notebook

pip install "fastplotlib[notebook]"

Recommended: install simplejpeg for much faster notebook visualization, this requires you to first install libjpeg-turbo

pip install simplejpeg

Note

fastplotlib and pygfx are fast evolving projects, the version available through pip might be outdated, you will need to follow the "For developers" instructions below if you want the latest features. You can find the release history on pypi here: https://pypi.org/project/fastplotlib/#history

For developers

git clone https://github.com/fastplotlib/fastplotlib.git
cd fastplotlib

# install all extras in place
pip install -e ".[notebook,docs,tests]"

Examples

Note

fastplotlib and pygfx are fast evolving, you may require the latest pygfx and fastplotlib from github to use the examples in the main branch.

Note that fastplotlib code is basically identical between desktop and notebook usage. The differences are:

  • Running in glfw requires a fastplotlib.run() call (which is really just a wgpu run() call)
  • To use it in Qt you must encapsulate it within a QApplication, see examples/qt
  • Notebooks plots have ipywidget-based toolbars and widgets 😄

Desktop examples using glfw or Qt

GLFW examples are here. GLFW is a "minimal" desktop framework.

https://github.com/fastplotlib/fastplotlib/tree/main/examples/desktop

Qt examples are here:

https://github.com/fastplotlib/fastplotlib/tree/main/examples/qt

Some of the examples require imageio:

pip install imageio

Notebook examples

Notebook examples are here:

https://github.com/fastplotlib/fastplotlib/tree/main/examples/notebooks

Start with simple.ipynb.

Some of the examples require imageio:

pip install imageio

Video

Our SciPy 2023 talk walks through numerous demos: https://github.com/fastplotlib/fastplotlib#scipy-talk

Graphics drivers

You will need a relatively modern GPU (newer integrated GPUs in CPUs are usually fine). Generally if your GPU is from 2017 or later it should be fine.

For more information see: https://wgpu-py.readthedocs.io/en/stable/start.html#platform-requirements

Windows:

Vulkan drivers should be installed by default on Windows 11, but you will need to install your GPU manufacturer's driver package (Nvidia or AMD). If you have an integrated GPU within your CPU, you might still need to install a driver package too, check your CPU manufacturer's info.

Linux:

You will generally need a linux distro that is from ~2020 or newer (ex. Ubuntu 18.04 won't work), this is due to the glibc requirements of the wgpu-native binary.

Debian based distros:

sudo apt install mesa-vulkan-drivers
# for better performance with the remote frame buffer install libjpeg-turbo
sudo apt install libjpeg-turbo

For other distros install the appropriate vulkan driver package, and optionally the corresponding libjpeg-turbo package for better remote-frame-buffer performance in jupyter notebooks.

CPU/software rendering (Lavapipe)

If you do not have a GPU you can perform limited software rendering using lavapipe. This should get you everything you need for that on Debian or Ubuntu based distros:

sudo apt install llvm-dev libturbojpeg* libgl1-mesa-dev libgl1-mesa-glx libglapi-mesa libglx-mesa0 mesa-common-dev mesa-vulkan-drivers

Mac OSX:

WGPU uses Metal instead of Vulkan on Mac. You will need at least Mac OSX 10.13. The OS should come with Metal pre-installed so you should be good to go!

❤️ Contributing

We welcome contributions! See the contributing guide: https://github.com/kushalkolar/fastplotlib/blob/main/CONTRIBUTING.md

You can also take a look at our Roadmap for 2025 and Issues for ideas on how to contribute!

fastplotlib's People

Contributors

almarklein avatar balzaniedoardo avatar clewis7 avatar davidvfiumano avatar ericthomson avatar garrettblair avatar happyqiu avatar kianmeng avatar kushalkolar avatar mathematicalmichael avatar tlambert03 avatar

Stargazers

 avatar  avatar  avatar  avatar  avatar  avatar  avatar  avatar  avatar  avatar  avatar  avatar  avatar  avatar  avatar  avatar  avatar  avatar  avatar  avatar  avatar  avatar  avatar  avatar  avatar  avatar  avatar  avatar  avatar  avatar  avatar  avatar  avatar  avatar  avatar  avatar  avatar  avatar  avatar  avatar  avatar  avatar  avatar  avatar  avatar  avatar  avatar  avatar  avatar  avatar  avatar  avatar  avatar  avatar  avatar  avatar  avatar  avatar  avatar  avatar  avatar  avatar  avatar  avatar  avatar  avatar  avatar  avatar  avatar  avatar  avatar  avatar  avatar  avatar  avatar  avatar  avatar  avatar  avatar  avatar  avatar  avatar  avatar  avatar  avatar  avatar  avatar  avatar  avatar  avatar  avatar  avatar  avatar  avatar  avatar  avatar  avatar  avatar  avatar  avatar

Watchers

 avatar  avatar  avatar  avatar  avatar  avatar  avatar  avatar

fastplotlib's Issues

Naming subplots and graphics

  • __getitem__ for GridPlot, index the subplots using tuple of int or str by giving subplots names. Subplot has name attribute. #27

    gridplot[0, 0] # returns Subplot at [0, 0]
    gridplot[0, 0].name = "bah"
    gridplot["bah"] # returns Subplot at 0, 0
  • each Graphic can also be given a name attribute for referencing it. Subplot.__getitem__ can take str to reference the Graphic items.

  • implement a way to get Graphic instances from a subplot.

  • We can also create a useful __repr__ for Gridplot, Subplot and Graphic.

simplification ideas

  • gridplot args, done in #45

    • allow passing in nested list of list for camera and controller kwargs and then make it a numpy array
    • controllers args
      • "sync" - everything gets synced
  • #36

broad ideas for features

  • resize indivual grid plots or compositions of subplots within a canvas. Similar to Qt QSplitter
  • dynamically change controllers across subplots

better organization of Graphics

  1. We will soon have LineCollection so we should probably add a class attribute to each Graphic subclass which is used by Plot when attaching all the graphic names as methods, since we'd want plot.line_collection() rather than plot.linecollection() and it maintains pep8 standards
  2. It would be useful for Subplot.get_graphics() to return a dict instead of a list, where the keys are the object class.
    example:
from fastlotlib.graphics import ImageGraphic

graphics_in_subplot = gp[0, 0].get_graphics() 

graphics_in_subplot[ImageGraphic] # list of all `ImageGraphic` graphic instances within the subplot

@clewis7 thoughts?

Selector objects

  • LinearRegionSelector - similar to pyqtgraph LinearRegionItem
  • RectangleRegionSelection
  • PolygonRegionSelection

implementation ideas:

use get_world_bounding_box(), iterate through all Graphic objects in a PlotArea, get the Graphic.world_object.get_world_bounding_box() to determine overlaps and then find the data slice that does overlap.

workshop todo

stuff to try and finish before the workshop:

  • #91
  • docs
  • demo with the following, a gridplot and an ImageWidget
    • gridplot:
      • behavior side and front, heatmap, stacked lineplot, single lineplot which shows only the current selection, stacked lineplot where each line is a trial of the selected component, PCA, downstream analysis
    • imagewidget:
      • mcorr, RCM, etc. with contours that interact with the stacked lineplot, single lineplot and heatmap
  • high level interactivity, #93
  • autoscale camera for data w.r.t. data bounds
  • See how "big_camera" settings work as the default with not-so-large near & far planes, #62
    • setting PlotArea.controller.distance = 0 seems to have fixed it, it was merged in #80
  • Heatmap with tiling pygfx.Image, pygfx/pygfx#360
  • API renaming where necessary
  • better handling of color args to Graphic objects
  • LineStack
  • Make LineCollection better
  • very long LineGraphic object that changes position with a slider. Can just make a widget which takes an existing IntSlider as an argument and automatically connects the observe to itself. Exclude in scene bbox calculation, or put it in a diff scene. Make it an overlay of 2 lines, thick with low alpha and thin with high alpha on top.
  • LinearSelector and/or RectangleSelector, see for ideas: #62
  • histogram widget for images (needs RectangleSelector) - we have vmin vmax sliders for now

raw movie viewer

Some sort of basic raw movie viewer would also be useful.

Usage idea:

  • give it a list of paths
  • creates a list widget
  • can multi select and generate gridplot to display the raw video
  • have some place to set the reader, options like pims, append-tiff, etc.

Line handling of nans

When data contains nans rendering doesn't work for line objects. Images work (i.e., the nans just show up as zeros).

xs = np.linspace(0, 30, 500)
ys = np.sin(xs)
ys[30:50] = np.nan
data1 = np.dstack([xs, ys])[0]

plot_l = Plot()
plot_l.line(data=data1, size=2, cmap="jet")
plot_l.show()

Compare to following which shows up fine (line renders except the nans which are just blank -- obviously could be handled differently this is just one option):

import matplotlib.pyplot as plt
plt.plot(xs, ys)

In practice this comes up frequently as the caiman coordinates have nans in them fairly often (right now I just filter out those nan-containing rows).

high level API ideas

GridPlot makes its own canvas and renderer if not provided

Independent user-end subplot (without GridPlot) that can be stacked using custom layouts, like VStack, HStack etc.
-> Similarly, user-end subplot also makes it own canvas if not provided

Simple high level plot (non-subplots) which also makes it own canvas etc.

import fastplotlib as fpl

plot = fpl.Plot(canvas=None, renderer=None)  # default kwargs
# returns a high-level Plot which makes a new canvas as a read-only property
# Plot automatically registers all graphic types somehow...

img_plot = plot.image(data=...)
# creates user-end subplot with an Image graphic
# returns itself

plot.show()  # return Plot.canvas

# another jupyter cell

plot = fpl.Plot()

plot.image(data=...)
plot.line(data=...)
plot.scatter(data=...)
# all the above get put on the same subplot

plot.show()

# another jupyter cell

from fpl.layouts import VStack, HStack, compose

plot_left = fpl.SubPlot()  # does not make its own canvas and renderer
plot_right = fpl.SubPlot()

img_plot = plot_left.image(data=...)
scatter_plot = plot_right.scatter(data=...)

compose(HStack[img_plot, scatter_plot])  # compose makes the canvas and renderer, and returns the canvas

notes from meeting with `pygfx` devs

  1. Probably a solution to auto-scaling the camera w.r.t. data bounds of WorldObject:
  • can set width and height of camera using bbox of WorldObjects
  • render axes and ticks etc. in one scene with a camera, and render the data in another scene with a different camera. See scene_overlay example.
  1. Should probably just always use the current "big_camera" option as default. near and far planes don't have to be so large.
  2. Getting the indices of WorldObjects under an arbitrary shape is not a trivial problem. For now just support a using a "RectangleSelector" that is aligned with the axes and use its bbox to find WorldObjects that are within this bbox and then the indices of that WorldObject within that bbox.
  3. pygfx.Image tiling for Heatmap
  4. For arbitrary Polygons look into triangulation algorithms, https://docs.scipy.org/doc/scipy/reference/generated/scipy.spatial.Delaunay.html

Roadmap 2025

This is our roadmap for 2024 and 2025. The goal is that when this roadmap is complete, or nearly complete, we will have a near-stable beta v1.0.0 release of fastplotlib. The roadmap is subject to change as the project grows and evolves, but we think that the items laid out here are the core components for fastplotlib to become a fully fledged and unique scientific plotting library.

We are always looking for new contributors! Items marked with a 🟢 are easy first PRs for newcomers with all levels of experience! If you have other ideas, or better ideas, feel free to open an issue or PR 😄 !

API basics

  • module reorganization, #53
  • arrive at a stable API for a v1.0.0 beta, related #121
  • Use matplotlib-like names for some aspects of the API, like vmin vmax for familiarity #88
  • 🟢 #384
  • UI elements, explore pyimgui, kivy, etc. Will probably have to be implemented in pygfx

Layouts

  • Arbitrary subplot sizes and positions, with resizable separators between them, some ideas in #315
    • pyimgui might help with this too
  • Add a row or column to existing Gridplot

Graphics

  • #129
  • better handling of color args, done in #78
  • Heatmap needs to work with larger array, see pygfx/pygfx#360
  • #389
  • #487
    • Some selector tools could just inhereit from this and BaseSelector
  • 3D Graphics
    • Polyhedron
    • Ellipsoid
    • Volume #50
    • Arbitrary polyhedrons and surface meshes
    • Unfirom API for non-orthogonal slicing for all 3D graphics
  • Graphic Collections
    • LineCollection
    • LineStack
    • PolygonCollection

Interactivity tools and events

  • interactivity to define events between Graphics #93
  • more complex interactivity defined in in #100
  • Selectors #142
    • LinearSelector
    • LinearRegionSelector
    • 🟢 RectangleRegionSelection
    • PolygonRegionSelection
    • Volume selector tools, cubes and slices
  • #456
  • 🟢 #380

More Text control

  • Decide on API
  • Size of text for plot titles, etc.

Subplot/View area

  • refactor Subplot, create a new class ViewArea which is used by both Subplot and DockedViewport #30
  • Axes with ticks and labels, waiting for pygfx/pygfx#492
  • #80
  • "Docked" viewports #30
  • 🟢 toolbar buttons to change controllers and camera FOV for subplots, maybe an "advanced" options area with even more toolbar-accessbile configurations (theme, log axes, etc.).

Things in docked viewports

  • Lineplot that displays histogram with LinearRegionSelector to adjust vmin vmax for image data
  • #403

Widgets

  • #51
  • Do we need more types of widgets? Line plots? Scatter plots? The ImageWidget is due to the complex n-dimensional nature of imaging data.
    • I think the answer to this is something like a seaborn-type API, higher level than graphics, related #395
      • neurowidgets library is also kinda related but tailored to neuroscience
  • #149

Test suite

  • basics framework to run desktop examples and notebook examples with screenshots
  • 🟢 notebook tests for everything
  • meta issue - #229
  • emulate Events #374
  • selectors
  • think about #362

Docs, tutorials and examples

  • basic docs, #49
  • #316
  • #292
  • #486
  • 🟢 more docs
  • 🟢 nbsphinx for remaining demo notebooks
  • 🟢 #339
  • 🟢 tutorials: the basics within jupyter, using in ipython with %gui qt, use to make Qt applications
    • domain specific tutorials, within this repo so that it's maintained under one CI roof
    • neuroscience with pynapple with a smaller dataset, or stream from DANDI, adapt from: https://github.com/fastplotlib/fastplotlib-sfn2023
    • deeplabcut and other behavior tools
    • developmental biology
    • general fluorescence microscopy
    • astronomy
    • displaying live data streams from acquisition devices using zmq or multiprocessing

Project Website

  • home page for newcomers to learn about us, how to contribute, our documentation, and community involvement
  • host our previous talks/tutorials

pygfx wishlist:

  • LOD - Level of detail
  • render bundles

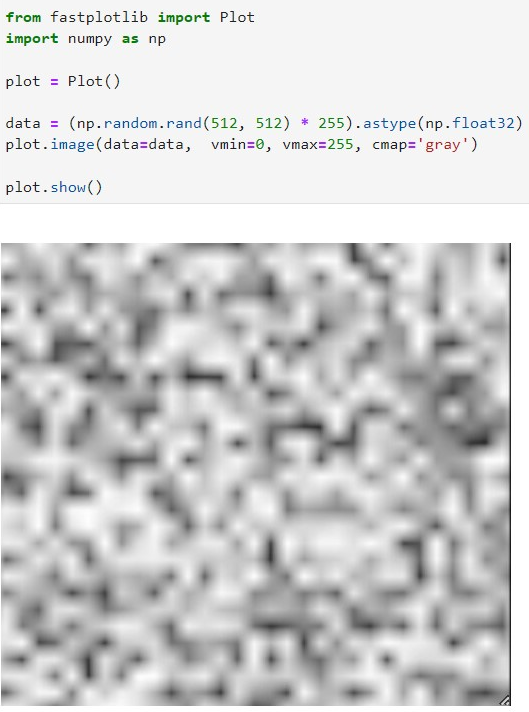
image seems to be interpolated with the image function

from fastplotlib import Plot
import numpy as np

plot = Plot()

data = (np.random.rand(512, 512) * 255).astype(np.float32)
plot.image(data=data,  vmin=0, vmax=255, cmap='gray')

plot.show()

image

The above pic shows a random image zoomed in. It's expected to see sharp corners for the black and white pixels, but it's not there so I guess there is default interpolation? Is there a way to turn it off? I did a quicky search but I couldn't find a way in either fastplotlib or pygfx.

High level widgets

Takes numpy array-like (such as pims objects), choose axes to have sliders on, displays plot. Could also have gridplot where multiple numpy arrays are given and sliders are synced across plots.

something like:

from fastplotlib.widgets import ImageWidget
import cv2
import pims

a = pims.open("img.tiff") # array-like of shape [n_frames, x, y]
vid = pims.open("vid.avi") # array-like of shape [n_frames, x, y, rgb_channels]

# produces a slider for each axis passed to `slider_axes`
# additional kwargs are passed to `graphics.Image`, such as `cmap`
iw = ImageWidget(data=a, slider_axes=0, axis_order="txy", **kwargs)
# could also specify slider axis from one of the axis_order indicators
# this could be the default kwarg for slider_axes
iw = ImageWidget(data=a, slider_axes="t", axis_order="txy", **kwargs)
iw.show() # returns `VBox` of `ImageWidget` and `ipywidgets.IntSlider`

# multiple sliders
iw = ImageWidget(data=a, slider_axes=["t", "z"], axis_order="tzxy", **kwargs)

# pass a frame apply function that is applied to the frame array when `update_frame()` is called
to_gray = lambda rgb_frame: cv2.cvtColor(rgb_frame, cv2.COLOR_BGR2GRAY)
iw_vid = ImageWidget(data=b, slider_axes=0, frame_apply=to_gray)

# Same widget but with gridplot, pass list of array-like
iw_grid = ImageWidget(
    data=[a, b], 
    slider_axes=0,  # use 0th axis for a single slider for both arrays
    frame_apply={b: to_gray}
)
iw_grid.show()

# if a.shape[0] != b.shape[0] it can print a warning and just not update `a` when it goes out of bounds for it, but continue updating `b`

# create multiple sliders for different dimensions
iw_grid_async = ImageWidget(
    data=[a, b],
    slider_axes=["t", "z"],
    axes_order={a: "tzxy", b: "xyzt"},
    slice_avg={"t": 10, "z": 1},  # window size for slice averaging along some axes
    frame_apply={b: to_gray}
)
iw_grid_async.show()

composite widget ideas

Module with "composite" widgets, basically specific combinations of graphics that can be placed within a subplot

  • similar to pyqtgraph ImageView widget with histogram and vmin-vmax setting.

very high level interactivity API

Just a vague idea for now. Currently basic interactivity is implemented with the pygfx events system for the Heatmap. We can think of a high level interactivity API where certain features across Graphic can linked together by a selection of built-in interactivity.

Usage example:

hm_data = np.random.rand(100, 20)
data_indices = np.arange(20)

contours = # get 20 contours

hm_graphic = plot.heatmap(hm_data, indices=data_indices)

# plot the other graphic in the same or some other scene

contour_graphic = plot.multi_line(contours, indices=data_indices)

hm_options = dict(
    feature="row",
    update_color=[1, 1, 1, 0.5],
    update_data=None,  # can change the data if desired
    event="double_click"
)

contour_options = dict(
    feature="line",
    update_color=[1, 1, 1, 1],
    update_data=None,  # if desired
    event="click"
)

# bi-directional linking
# heatmap -> contours
linker = hm_graphic.link(source_options=hm_options, target=contour_graphic, target_options=contour_options)

# contours -> heatmap
linker2 = contour_graphic.link(source_options=contour_options, target=hm_graphic, target_options=hm_options)

# to unlink
hm_graphic.unlink(linker)

Also allow custom indices mapper to make the data from graphics where the indices don't directly map onto the indices of another graphic. For examples Image -> Contour

# continue from above, so the previous heatmap is also present somewhere in the renderer/canvas

img_data = np.random.rand(512, 512)

image_graphic = plot.image(img_data)

def get_closest_contour(indices) -> np.array:
    # convert source graphic indices to target graphic indices
    # stuff to map image indices -> contour indices
    return contour_indices

image_options = dict(
    feature="pixel",
    update_data=None, # we don't want to change anything in the image
    event="click",
    indices_mapper=get_closest_contour,
)

contour_options_img = dict(
    feature="line",
    update_color=[1, 1, 1, 1],
    event=None,
    chain_event=True, # this graphic will pass on the source's event to its target if a target exists
)

linker_img = image_graphic.link(source_options=image_options, target=contour_graphic, target_options=contour_options_img)

When image_graphic gets a click event it triggers the contour_graphic to change its "line" feature, but since we set chain_event=True for contour_options_img, the contour_graphic will pass along the click event to anything that it is linked to downstream.

make GridPlot more flexible

Allow setting either nrows or ncols as a constant, and passing a list to the other which defines how to split each corresponding row/col

Example for 3 cols on top, 2 on bottom:
nrows = 2, ncols=(3, 2)

demo ideas

images larger than 1179 x 1178 don't appear

minimal code to reproduce:

plot = Plot()

# shows up
data = np.random.rand(1179, 1178) * 255
plot.image(data=data,  vmin=0, vmax=255, cmap='viridis')

plot2 = Plot()

# doesn't show
data2 = np.random.rand(1179, 1179) * 255
plot2.image(data=data2,  vmin=0, vmax=255, cmap='viridis')

HBox([plot.show(), plot2.show()])

image

new graphics to add

  • Heatmap, #32
  • Histogram, change bin sizes and stuff
    • box geometry, simple mesh material
    • mapping histogram values to widths and heights of rectangles
    • get the x-axis center of mass of the rectangles in graphics coordinates, set that as 0 in graphics world
    • bottom of the rectangles sit at the bottom of the scene
  • raster plot, create a single horizontal line for each neuron. Set colors for each vertex based on activity at each timepoint. this is basically a heatmap

module reorganization

Currently everything is basically imported at top level, it could get messy if we expand to include more widgets for example. Currently Image and ImageWidget exist.

Only the following should exist at the top level:

  • graphics
  • layouts
  • Plot
  • widgets

For quick simple plots they just use Plot(), for everything else they do something like:

from fastplotlib.graphics import Image, Line
from fastplotlib.layouts import GridPlot

# or for widget plots
from fastplotlib.widgets import ImageWidget

@EricThomson thoughts?

image histogram UI

Ideas for creating a histogram UI to adjust vmin-vmax of image graphic similar to pyqtgraph HistogramLUTWidget

  • When used, the viewport in the Subplot needs to be split so that a thin rectangular "sub-viewport" can be used for the histogram LUT widget.
  • Colorbar next to histogram

Movie is showing up as binarized, and resizing parts (depending on dtype)

I'm generating a movie of synthetic calcium data (either as uint8 or float), in Windows 10 (note: subsequently confirmed on Ubuntu so this doesn't seem to be an OS-specific thing), and things are looking weird. Note code examples to reproduce are all below.

I roughly expect it to look like this (created using opencv, saved from uint8):

opencv_save.mp4

When a component is activated, it is bright, and then activity slowly decays. And each component is a 2d Gaussian, so has a bright center that gradually falls off as you move off from its center.

Using fastplotlib, the way it looks when I view with slider as original float data:

recreate_float.mp4

The way it looks as uint8 from fastplotlib:

recreate_uint8.mp4

This is better in the sense of no strange balloon artifacts, but still binarized (note it's qualitatively the same when cmap is gray, but I used viridis here it doesn't matter for the effect).

I've confirmed this on another Windows machine, and same behavior on Ubuntu 20.04.

Code

Create movie array

import numpy as np
import matplotlib.pyplot as plt
from scipy.stats import multivariate_normal

# set up gaussians centered at component_centers
num_frames = 1000
image_size = 200
frame_shape = np.array([image_size, image_size])
component_centers = np.array([[40, 40],
                              [110, 90],
                              [180, 55],
                              [60, 135],
                              [140, 140]]);
num_components = component_centers.shape[0]

# create component images: stack of images one for ech component
sigma = 20
x, y = np.meshgrid(np.arange(0, image_size), 
                   np.arange(0, image_size)) 
pos = np.dstack((x, y))
component_sigma = np.array([[sigma, 0],[0, sigma]])
component_images = []
for component_num in np.arange(num_components):
    component_mean = component_centers[component_num]
    gauss_rep = multivariate_normal(component_mean, component_sigma)
    gauss_img = gauss_rep.pdf(pos)
    component_images.append(gauss_img)
component_images = np.array(component_images)


# generate traces
tau = 10
max_amp = 255  # just to make saving as uint8 in opencv simple
amps_all = []

for component_num in np.arange(num_components):
    amps = []
    amp = 0
    for time_step in np.arange(num_frames):
        if np.random.uniform(0,1) > 0.98:
            amp = max_amp
        else:
            amp = np.max(np.array([amp - amp/tau, 0]));
        amps.append(amp)
    amps = np.array(amps)
    amps_all.append(amps)
amps_all = np.array(amps_all)

# create movie
movie = np.zeros((num_frames, image_size, image_size))
for frame_num in np.arange(num_frames):
    component0 = amps_all[0][frame_num]*component_images[0]
    component1 = amps_all[1][frame_num]*component_images[1]
    component2 = amps_all[2][frame_num]*component_images[2]
    component3 = amps_all[3][frame_num]*component_images[3]
    component4 = amps_all[4][frame_num]*component_images[4]
    movie[frame_num] = component0 + component1 + component2 + component3 + component4 

Show in fastplotlib (as float)

plot = Plot()
image = plot.image(data=movie[0], cmap='viridis')

movie_slider = IntSlider(value=0, min=0, max=movie.shape[0]-1, step=1) 

previous_index = 0

def update_frame():
    global previous_index
    if movie_slider.value == previous_index:
        return
    image.update_data(data=movie[movie_slider.value])
    
plot.add_animations([update_frame])
VBox([plot.show(), movie_slider])

Save using opencv

import cv2
# convert to uint8
movie2 = movie.copy()
movie2 = movie2 / np.max(movie2) # normalize the data to 1 max
movie2 = 255* movie2
movie2 = movie2.astype(np.uint8)
fps = 25
out = cv2.VideoWriter('synthetic_ca.mp4', 
                      cv2.VideoWriter_fourcc(*'DIVX'),  #mp4v (encoding)
                      fps, 
                      (image_size, image_size), 
                      False) # is_color
for frame in movie2:
    out.write(frame)
out.release()

Show uint8 version in fastplotlib

plot2 = Plot()
image2 = plot2.image(data=movie2[0], cmap='viridis')

movie_slider2 = IntSlider(value=0, min=0, max=movie2.shape[0]-1, step=1) 

previous_index = 0

def update_frame2():
    global previous_index
    if movie_slider2.value == previous_index:
        return
    image2.update_data(data=movie2[movie_slider2.value])
    
plot2.add_animations([update_frame2])
VBox([plot2.show(), movie_slider2])

LineStack

Just realized what's probably the best way to do this:

Every Graphic sets world_object.position after init based on a position kwarg (probably expose position as a user settable attribute, maybe start making worldobject itself private).
In LineStack, as we iterate through adding each Line, we set position.y as the previous position.y + data[:, 1].max() + separation_height

handling colors and other modifiable attributes

The way colors are handled by Graphic is kinda of wonky now, I'm thinking of making a base class GraphicAttribute which is indexable, this would allow intuitive fine grained color control. It would probably also fix the current wonkyness of ScatterGraphic.

example:

plot = Plot()

line_graphic = plot.line(data=<sine_wave>)

line_graphic.colors[50:100] = "red"
line_graphic.colors[100:] = (0, 1, 0, 1)
line_graphic.colors = "w"
...

This would basically call pygfx geometry/material colors.data and the update_range() for only the indices modified

@EricThomson @clewis7 thoughts?

@clewis7 this will get rid of all the current update_<graphic_attr> methods, but we can change that later. For interactivity we can just allow anything that is a GraphicAttribute instance to be a modifiable feature.

parent or top level object for plots

plots (simple plots, subplot and gridplot) should traverse up a hierarchy of parents to get things like canvas, renderer, position (of itself), parent_dims, etc. If it is a top-level plot, it instantiates canvas, renderer etc. for itself and sets position = (0, 0) etc.

API things, names, consistency, etc.

currently the simple Plot API attaches methods like plot.image, plot.line etc which adds a graphic to the plot. This is kinda matplotlib inspired but could quickly get polluted (i.e. matlab inspired) . What if we prefix these methods with "add", so it becomes plot.add_image, plot.add_line etc. Because then I could also add add this behavior to the GridPlot API to remove the add_graphic step which is just boilerplate, while keeping the api clean. All add_ methods must add something to the plot or Subplot.

@EricThomson thoughts?

Creating plot object generates TypeError: module not callable

Working with most recent update (updated few days ago, and I also just updated today):

from fastplotlib import Plot
plot = Plot()

Returns TypeError: 'module' object is not callable.

Other things are working fine (e.g., ImageGraphic). I'm on Windows 10.

aesthetic luxuries

  • set background in subplots, maybe subplots should keep an instance of a class that's just used for theme-stuff.
    • Something like subplot.theme.set_background(color='w')
    • @clewis7 easy first contrib for you 😄

Colormaps not found (Windows install)

After installing on Windows using:

pip install git+https://github.com/kushalkolar/fastplotlib.git

When I try to create simple plots:

plot = Plot()

data = np.random.rand(512, 512) * 255
plot.image(data=data,  vmin=0, vmax=255, cmap='viridis')

I get the following:

FileNotFoundError: C:\Users\Eric\miniconda3\envs\ds\lib\site-packages\fastplotlib\colormaps\viridis not found.

It turns out the install isn't generating the colormaps directory, so my workaround is to create such a directory in the local repo, and copy/paste all the colormap files in from fastplotlib into that directory (using download directory. It's a puzzle why the pip installer isn't working correctly.

I've seen this on both of my Windows computers, and when I install on my Ubuntu machine things work fine.

docs

We are still very early alpha but we can start putting doc strings, basic user docs, and diagrams. Aim to have something basic by mid January before the Caiman-Mesmerize workshop

example with pims

from fastplotlib import Plot
import pims
from ipywidgets.widgets import IntSlider

stack = pims.open("YOUR_IMAGING_FILE")
slider = IntSlider(value=0, min=0, max=stack.shape[0] - 1, step=1)

plot = Plot()

image_graphic = plot.image(data=stack[slider.value], cmap='gray')
plot.camera.scale.y = -1

previous_slider_ix = 0
def update_frame():
    global previous_slider_ix
    if previous_slider_ix == slider.value:
        return
    
    image_graphic.update_data(stack[slider.value])
    
plot.add_animations([update_frame])

plot.show()


slider

Update names of graphic classes

Since we now have #51, it could get confusing to have a class which is just called "Image". We should rename all the graphic classes to have the "Graphic" suffix.

text

now that text is merged in pygfx we can start implementing it here 😄

  • Subplot titles, can be displayed in the "top" docked viewport #30
  • ticks and axes labels
  • Labelling graphics with their names
    • labelling graphic collections with their indices

@EricThomson, welcome to add more use cases

How to measure timing of rendering?

Is there a way to time how long initial rendering takes? When I use the usual cell magic like %%time it shows how long the Python code takes to run, but it typically takes a while longer before the graphical elements from fastplotlib display. Are there any profiling tools to time these types of things?

Recommend Projects

  • React photo React

    A declarative, efficient, and flexible JavaScript library for building user interfaces.

  • Vue.js photo Vue.js

    🖖 Vue.js is a progressive, incrementally-adoptable JavaScript framework for building UI on the web.

  • Typescript photo Typescript

    TypeScript is a superset of JavaScript that compiles to clean JavaScript output.

  • TensorFlow photo TensorFlow

    An Open Source Machine Learning Framework for Everyone

  • Django photo Django

    The Web framework for perfectionists with deadlines.

  • D3 photo D3

    Bring data to life with SVG, Canvas and HTML. 📊📈🎉

Recommend Topics

  • javascript

    JavaScript (JS) is a lightweight interpreted programming language with first-class functions.

  • web

    Some thing interesting about web. New door for the world.

  • server

    A server is a program made to process requests and deliver data to clients.

  • Machine learning

    Machine learning is a way of modeling and interpreting data that allows a piece of software to respond intelligently.

  • Game

    Some thing interesting about game, make everyone happy.

Recommend Org

  • Facebook photo Facebook

    We are working to build community through open source technology. NB: members must have two-factor auth.

  • Microsoft photo Microsoft

    Open source projects and samples from Microsoft.

  • Google photo Google

    Google ❤️ Open Source for everyone.

  • D3 photo D3

    Data-Driven Documents codes.