Giter Site home page Giter Site logo

greenelab / tybalt Goto Github PK

View Code? Open in Web Editor NEW
159.0 10.0 62.0 101.72 MB

Training and evaluating a variational autoencoder for pan-cancer gene expression data

License: BSD 3-Clause "New" or "Revised" License

Shell 0.02% Jupyter Notebook 41.16% Python 3.95% R 0.68% HTML 54.18%
cancer-genomics deep-learning unsupervised-learning gene-expression variational-autoencoder script tool analysis autoencoder variational-autoencoders

tybalt's Introduction

Tybalt 😼

A Variational Autoencoder trained on Pan-Cancer Gene Expression

Gregory Way and Casey Greene 2017

DOI

The repository stores scripts to train, evaluate, and extract knowledge from a variational autoencoder (VAE) trained on 33 different cancer-types from The Cancer Genome Atlas (TCGA).

The specific VAE model is named Tybalt after an instigative, cat-like character in Shakespeare's "Romeo and Juliet". Just as the character Tybalt sets off the series of events in the play, the model Tybalt begins the foray of VAE manifold learning in transcriptomics. Also, deep unsupervised learning likes cats.

We discuss the training and evaluation of Tybalt in our PSB paper:

Extracting a Biologically Relevant Latent Space from Cancer Transcriptomes with Variational Autoencoders.

Citation

Way, GP, Greene, CS. 2018. Extracting a biologically relevant latent space from cancer transcriptomes with variational autoencoders. Pacific Symposium on Biocomputing 23:80-91. doi:10.1142/9789813235533_0008

Notes

As discovered by @enricoferrero, the preprint text (section 2.2) states that the top median absolute deviation (MAD) genes were selected for subsetting, when the data processing code (process_data.ipynb) actually outputs the top mean absolute deviation genes. We discuss this discrepancy and its potential impact in issue #99.

git-lfs (https://git-lfs.github.com/) must be installed prior to cloning the repository. If it is not installed, run git lfs install

The Data

TCGA has collected numerous different genomic measurements from over 10,000 different tumors spanning 33 different cancer-types. In this repository, we extract cancer signatures from gene expression data (RNA-seq).

The RNA-seq data serves as a measurement describing the high-dimensional state of each tumor. As a highly heterogeneous disease, cancer exists in several different combination of states. Our goal is to extract these different states using high capacity models capable of identifying common signatures in gene expression data across different cancer-types.

The Model

We present a variational autoencoder (VAE) applied to cancer gene expression data. A VAE is a deep generative model introduced by Kingma and Welling in 2013. The model has two direct benefits of modeling cancer gene expression data.

  1. Automatically engineer non-linear features
  2. Learning the reduced dimension manifold of cancer expression space

As a generative model, the reduced dimension features can be sampled from to simulate data. The manifold can also be interpolated to interrogate trajectories and transitions between states.

VAEs have typically been applied to image data and have demonstrated remarkable generative capacity and modeling flexibility. VAEs are different from deterministic autoencoders because of the added constraint of normally distributed feature activations per sample. This constraint not only regularizes the model, but also provides the interpretable manifold.

Below is a t-SNE visualization of the VAE encoded features (p = 100) for all tumors.

VAE t-SNE

Training

The current model training is explained in this notebook.

Tybalt dependencies are listed in environment.yml. To download and activate this environment run:

# conda version 4.4.10
conda env create --force --file environment.yml

# activate environment
conda activate tybalt

Tybalt is also configured to train on GPUs using gpu-environment.yml. To activate this environment run:

# conda version 4.4.10
conda env create --force --file gpu-environment.yml

# activate environment
conda activate tybalt-gpu

For a complete pipeline with reproducibility instructions, refer to run_pipeline.sh. Note that scripts originally written in Jupyter notebooks were ported to the scripts folder for pipeline purposes with:

jupyter nbconvert --to=script --FilesWriter.build_directory=scripts/nbconverted *.ipynb

Architecture

We select the top 5,000 most variably expressed genes by median absolute deviation. We compress this 5,000 vector of gene expression (for all samples) into two vectors of length 100; one representing the a mean and the other the variance. This vector can be sampled from to generate samples from an approximation of the data generating function. This hidden layer is then reconstructed back to the original dimensions. We use batch normalization and relu activation layers in the compression steps to prevent dead nodes and positive weights. We use a sigmoid activation in the decoder. We use the Keras library with a TensorFlow backend for training.

VAE Architecture

Parameter sweep

In order to select the most optimal parameters for the model, we ran a parameter search over a small grid of parameters. See parameter_sweep.md for more details.

Overall, we selected optimal learning rate = 0.0005, batch size = 50, and epochs = 100. Because training did not improve much between 50 and 100 epochs, we used a 50 epoch model. Training and validation loss across 50 training epochs for the optimal model is shown below.

Training Performance

Model Evaluation

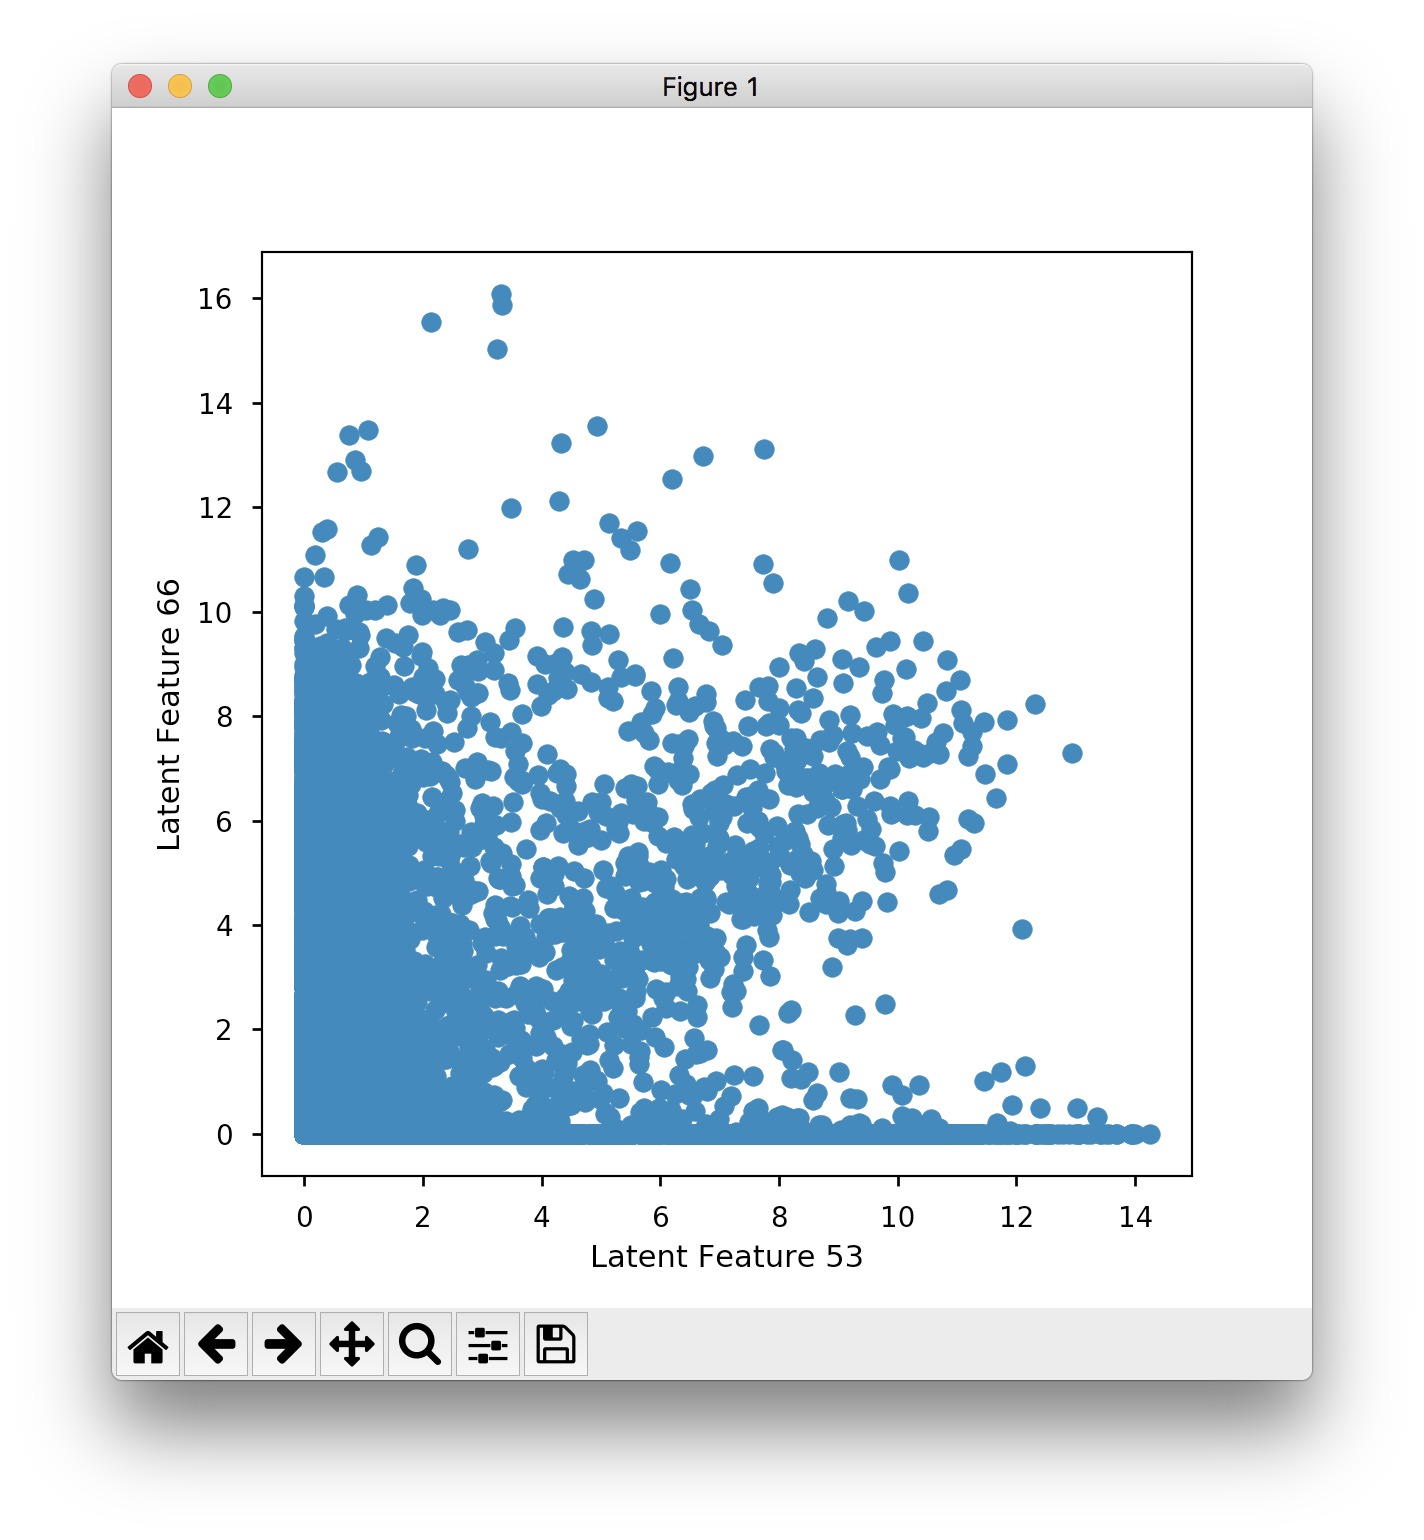
After training with optimal hyper parameters, the unsupervised model can be interpreted. For example, we can observe the distribution of activation patterns for all tumors across specific nodes. The first 10 nodes (of 100) are visualized below.

Node Activation

In this scenario, each node activation pattern contributes uniquely to each tumor and may represent specific gene expression signatures of biological significance. The distribution is heavily right skewed, with some nodes capturing slightly bimodal attributes.

tybalt's People

Contributors

gwaybio avatar

Stargazers

 avatar  avatar  avatar  avatar  avatar  avatar  avatar  avatar  avatar  avatar  avatar  avatar  avatar  avatar  avatar  avatar  avatar  avatar  avatar  avatar  avatar  avatar  avatar  avatar  avatar  avatar  avatar  avatar  avatar  avatar  avatar  avatar  avatar  avatar  avatar  avatar  avatar  avatar  avatar  avatar  avatar  avatar  avatar  avatar  avatar  avatar  avatar  avatar  avatar  avatar  avatar  avatar  avatar  avatar  avatar  avatar  avatar  avatar  avatar  avatar  avatar  avatar  avatar  avatar  avatar  avatar  avatar  avatar  avatar  avatar  avatar  avatar  avatar  avatar  avatar  avatar  avatar  avatar  avatar  avatar  avatar  avatar  avatar  avatar  avatar  avatar  avatar  avatar  avatar  avatar  avatar  avatar  avatar  avatar  avatar  avatar  avatar  avatar  avatar  avatar

Watchers

 avatar  avatar  avatar  avatar  avatar  avatar  avatar  avatar  avatar  avatar

tybalt's Issues

Features that represent biological signals

Hi,
I’m interested in the part that you have investigated the biological relevance of extracted latent features. However, I have not been bale to figure where you find the dimensions that are say most important in distinguishing patients' sex. It appears that this is feature 82. Is this feature 82 (out of 100) in the latent space of VAEs with one hidden layer, or two hidden layer? I’m guessing it’s the latter, which is why I was looking into tybalt_twohidden.ipynb. However, here only weights for all samples are extracted based on multiplying the weights of the two hidden layers. So the question I was hoping you can help me with is in the vae with two hidden layer, how the latent feature(s) that distinguishes patients's sex is identified as 82?

Reproducing separation

Hi Greg,

Thanks for all the work in putting this together. I'm trying to reproduce some of the results, and can't quite seem to get the separation that is shown in the paper.

At the simplest, I'm loading the existing results saved in encoded_rnaseq_onehidden_warmup_batchnorm.tsv, and then plotting:

plt.figure(figsize=(6, 6))
plt.scatter(encoded_rnaseq_df.iloc[:, 1], encoded_rnaseq_df.iloc[:, 2])
plt.xlabel('Latent Feature 1')
plt.ylabel('Latent Feature 2');

(assuming line 4 above should be plt.ylabel) which produces:

screen shot 2018-03-30 at 10 38 50 am

Which seems to have less separation than the sanity check in the IPython notebook. Similarly when I plot feature 53 against 66:
screen shot 2018-03-30 at 12 50 44 am

You can kind of see the cluster, but there is less separation than what is produced in Fig. 3B in the paper. When I train the model from scratch to produce the embeddings, I get similar separation to the saved results, and not the clear separation that you see in the papers.

Am I missing something?

Refactoring Tybalt VAE Code

Code is getting unwieldy with the same functions and classes being defined in multiple places. There is also necessarily a lot of customization required to run each model. This issue will include information on how a refactoring should be performed.

Points to consider:

  1. VAE custom classes require specific input but must also communicate to a new tybalt class
  2. tybalt class should have various methods for training, transforming, and evaluating performance metrics
    b. training should allow multiple architecture and hyper parameter setting and getting
    a. performance metrics include: avg sample reconstruction, per cancer-type reconstruction, training history visualization, etc.

Brainstorm: Capabilities

I'll use a couple issues to discuss capabilities/challenges/evaluation tactics

  • Encodes gene expression representation into less dimensions (i.e. dimensionality reduction)
    • Nonlinear feature generation
      • What do the feature represent? What about intermediate layers?
    • The representation is a reflection of the data generating manifold
      • Possibility of exploring/observing samples along data manifold
        • Where are various covariates?
        • Where are expression sigatures? (TP53, Ras/NF1?)
        • Provide metric for sample similarity along expression signatures (HGSC subtypes?)
  • Provides ability to generate samples
    • Can this help with adding more data to other learning tasks?
    • Some sort of in silico drug response to hypothetical sample analysis?

High Weigh Genes Outliers

In #95 I removed outliers from visualizations to focus on areas of highest density. I defined outliers by > 3 z score for skew or kurtosis. The features appear to be identifiying similar biological processes across algorithms (e.g. patient sex). I need to decide if focusing on biological assignment for these features should be handled separately than other features.

Error when setting up environment

Hi Dr. Greg,

I tried to implement your code but was trapped when creating environment using environment.yml you provided. There are some conflicts for the dependency. I am not sure whether it is rasied by the reason the version might be too old. Will you update the dependencies?

Thanks
yurui

Passing list-likes to .loc or [] with any missing label will raise KeyError in the future, you can use .reindex() as an alternative.

Dear Dr. Greg,

I was trying to run your process_data.py script in nbconverted scripts. This resulted in an error, which I believe was because of the missing column 'hugoSymbol' in tsg_df and also because that indexing with list with missing labels is deprecated. Please find the exact output below. The documentation says:

Changed in version 1.0.0.

Using .loc or [] with a list with one or more missing labels will no longer reindex, in favor of .reindex.

Could I simply use .reindex() instead of .loc() here in this case? I would be very grateful for your help with this issue. Thank you.

Kind regards,
Yagmur

Passing list-likes to .loc or [] with any missing label will raise
KeyError in the future, you can use .reindex() as an alternative.

See the documentation here:
http://pandas.pydata.org/pandas-docs/stable/indexing.html#deprecate-loc-reindex-listlike
  status_gain = copy_gain_df.loc[:, oncogenes_df['hugoSymbol']]
/mnt/lsf-nas-1/os-shared/anaconda3/envs/tybalt/lib/python3.5/site-packages/pandas/core/indexing.py:1367: FutureWarning:
Passing list-likes to .loc or [] with any missing label will raise
KeyError in the future, you can use .reindex() as an alternative.

See the documentation here:
http://pandas.pydata.org/pandas-docs/stable/indexing.html#deprecate-loc-reindex-listlike
  return self._getitem_tuple(key)
tybalt/scripts/nbconverted/process_data.py:255: FutureWarning:
Passing list-likes to .loc or [] with any missing label will raise
KeyError in the future, you can use .reindex() as an alternative.

See the documentation here:
http://pandas.pydata.org/pandas-docs/stable/indexing.html#deprecate-loc-reindex-listlike
  status_loss = copy_loss_df.loc[:, tsg_df['hugoSymbol']]
tybalt/scripts/nbconverted/process_data.py:270: FutureWarning:
Passing list-likes to .loc or [] with any missing label will raise
KeyError in the future, you can use .reindex() as an alternative.

See the documentation here:
http://pandas.pydata.org/pandas-docs/stable/indexing.html#deprecate-loc-reindex-listlike
  copy_status = copy_status.loc[:, mutation_status.columns].fillna(0).astype(int)```

logging folder

add logging solution for std out and std err output for pmacs

Sampling distriubtions

Sorry for all the Issues, but this should be the last one for a while:

Is there an efficient manner to sample the latent space? I'm currently just randomly sampling the range of min/max for each feature, and having the decoder give the proper representation for that latent feature set, but not sure if thats the best route.

EDIT: To clarify, I have a classifier that can distinguish two populations based on rnaseq data. I would like to iteratively go through each gene in my model and see what happens when it is changed/lowered to a specific range. To do this, I'd like to sample the target distribution (for that given gene; likely just a 1sigma interval of 'normal' expression) and then run my classifier on the backend. Given the non-linear dependency of all the other genes on the target gene, the idea is to just randomly sample the latent space(and the learned distributions for each gene), and just select those vectors whose values meet my 1sigma criterion (on a per-gene basis, and hope that the representations of the other genes "respond" to the change in expression on my target gene).

t-SNT visualization

hi,
Which part of the code is to achieve T-SNE visualization of all tumor VAE coding features? I didn't find it in the project.

write scripts/vae_pancancer.py

this will be the workhorse of the repository - will need to take in command arguments and run through model training and preliminary evaluation.

By preliminary evaluation, I mean it will need to determine quickly which parameter combination is best, and output some sort of metric. I am thinking the metrics should be a combination of lowest loss and biological interpretability.

Modify Tybalt to handle missing values for incomplete data

Dear Dr. Greg,

Firstly, thank you very much for this well-documented research. This is not an issue but a feature that I need for my thesis. I would like to modify this model so that it can handle missing values in the test and training data. Because the data set I want to use in the future contains missing values in every sample. Imputing missing values before the training e.g. with zeros is not an option as this would introduce bias and the value zero has a meaning in our data set. Therefore I started with replacing the reconstruction error function with my custom binary cross-entropy function that can handle missing values. I tested this function in another notebook and it seemed to work. However, I observe NaN loss values in the training, also even after only using the reconstruction error. If you have any tips for me regarding how to handle missing values in the model, I would be very grateful for your help.

Kind regards,
Yagmur Onay

Zero'd out training

Hello,

I've essentially copied your tybalt_vae.ipynb file line for line in a new file to train on some of my own data, but after training on my dataset, it appears the training isn't occurring at all:

  1. The plot of the loss over the iterations is blank
  2. The encoded batchnorm file is zero'd out

However, the code seems to function as intended otherwise (e..g no errors). I've noted that your training data is scaled [0,1], while mine is scaled to be centered on 0, with unit variance (e.g. not [0,1])--could this be the issue?

Replace data in encoded_adage_features.tsv

The file (encoded_adage_features.tsv) as stored on git is only three lines. tsne_tybalt_features.ipynb expects a true tsv file and throws a value error. I ran adage_training.ipynb on my machine and it made a working copy of the file.

Pathway Coverage Evaluation

A good indicator of "how much biology did the model learn" is based on a pathway coverage test. I need to see how this was done in the eADAGE paper and then perform the pathway coverage on Pan-Cancer data for dimensionality reduction algorithms: PCA, ICA, NMF, ADAGE, and Tybalt.

Is there a better pathway database for cancer? Perhaps something like KEGG cancer?

Brainstorm: Improving Model

I'll use a couple issues to discuss capabilities/challenges/evaluation tactics

  • Read more VAE papers and code
    • Archive and discuss in new issues?
  • Define appropriate parameter sweep strategy
  • Determine how to test a "better" model
    • Visualization performance scripts during training
    • Fake vs. Real data classifier
    • Reconstruction against adversarial examples
    • Identify easy to identify signatures (e.g. sex, tumor/normal)

Matching pancancer expression to metadata

Hi @gwaygenomics @cgreene
I would like to map samples (index values) in pancan_scaled_rnaseq.tsv.gz to the metadata tcga-clinical_data.tsv.

Currently the index values for the rnaseq are not unique and I am unable to match them to the metadata.

Could you please advise on how, for example, I could subset the pancancer data to just a single cancer subtype (tying it to the metadata).

Separate Diagnostic Notebook

tybalt_vae.ipynb currently trains a VAE on pancan data and outputs the latent layer along with compiled Keras models.

the notebook also does a few sanity checks to ensure the model is actually learning something. This includes ensuring there are no zeroed out features and a quick check on reconstruction fidelity.

A more thorough diagnostic notebook would help ensure robust training. I will use this issue to discuss what should be included in the future nb.

  1. Cancer-type specific reconstruction - possibly point to needing to update batches in training

Reorganize repository

Distinct analyses are becoming confusing to follow. There are many parameter sweeps and simulation evaluations spanning compression models and latent space dimensionality.

The tybalt folder will become a standalone package, and the analyses that live in this repository must be easier to understand, especially as the project expands.

Sampling space for specific genes

Hey, great work on this project! I'm try to re-purpose this for something a little different. After training the VAE, I would like to focus on particular genes, and sample around a specific range, and see how that affects other gene distributions. Is that at all possible?

Top n - High Weight Selection Method

High weight gene selection performed naively by selecting the top n weight genes.

as @jaclyn-taroni pointed out in #95 - this method should be implemented in module tybalt.genes.high_weight_genes and be evaluated in upstream pathway analyses.

ADAGE Implementation Issues

Initial ADAGE models allowed encoder and decoder weights to vary independently. This resulted in relatively poor performance in comparison to other models in simulated and real data reconstruction tasks.

Recent implementations (#123 , #126) have added an option to tie ADAGE weights together (decoder weights are transposed encoder weights). This improved performance. However, the optimal noise parameter observed in a parameter sweep for the pancanatlas data is noise = 0.

z_parameter_adage_remove_sparsity_tiedweights

Based on previous observations, this should not be the case! We need to look into this in more detail. Currently, my thoughts are either:

  1. the implementation is incorrect and doesn't match https://github.com/greenelab/adage
  2. we do not sweep over enough noise parameters (i.e. the optimal noise is somewhere between 0 and 0.1)

ERROR: VAE Model reconstruct the gene expression data

Hi Gregory,

I am very happy to see how you have detailed the steps for gene expression VAE based model. I am doing some analysis on gene expression prediction model to classify dementia. I started learning teh applications of VAE model/ machine learning models in omic prediction models. Also I am new to Tensorflow/Keras.

I successfully implemented your code using your gene expression data after disabling the eager execution to make your program work in Tensorflow 2. But when we use our gene expression data (which is log 2 cpm normalized data), I am getting all the reconstructed values as 1.0 so my gene_mean and gene_summary remains same. I evaluated your data distribution ( it looks gene expression data in the range of 0-1).

Could you let me know if you can think of any issue with my input data shape.

Input:

Dimension: (3045, 10956)
data:

XXbac-BPG248L24.12 TTN RP11-290D2.6 JSRP1 RP11-115D19.1 HCG4P5 AC114271.2 RP3-394A18.1 ABALON KB-1208A12.3 ... LNPK NBPF15 ATP8B4 AC005522.7 CHID1 ARFRP1 NAPB CTB-133G6.2 SPATA24 POU2F2
12.988314 12.83923 12.576047 12.136305 11.978625 12.494600 12.583452 12.415211 10.807796 11.77091 ... 3.774915 3.350120 3.774915 2.310416 1.684627 2.745442 3.350120 2.745442 2.310416 3.350120
12.641275 12.56024 12.252506 12.576744 12.883745 12.327777 11.751295 11.776363 12.345054 11.64166 ... 2.240370 2.953526 3.618031

input_rnaseq_reconstruct.head(2):

XXbac-BPG248L24.12 TTN RP11-290D2.6 JSRP1 RP11-115D19.1 HCG4P5 AC114271.2 RP3-394A18.1 ABALON KB-1208A12.3 ... LNPK NBPF15 ATP8B4 AC005522.7 CHID1 ARFRP1 NAPB CTB-133G6.2 SPATA24 POU2F2
1.0 1.0 1.0 1.0 1.0 1.0 1.0 1.0 1.0 1.0 ... 1.0 1.0 1.0 1.0 1.0 1.0 1.0 1.0 1.0 1.0
1.0 1.0 1.0 1.0 1.0 1.0 1.0 1.0 1.0 1.0 ... 1.0 1.0 1.0 1.0  

gene_summary:

gene mean gene abs(sum)
11.867037 11.867037
11.774692 11.774692
11.622958 11.622958
11.489614 11.489614
11.474622 11.474622

Extract High Weight Genes for All Features

I will need to determine a consistent file format to extract all high weight genes from each feature encoding.

This will help to facilitate some sort of pathway coverage analysis aiding in an alternative dimensionality reduction algorithm eval.

Parameter Sweep

I will use this issue to discuss which parameter combos to sweep over

Something wrong in extracting weights?

In extract_tybalt_weights.ipynb notebook, you defined a function output_high_weight_genes.

At a certain point you have these 2 lines:
hw_pos_df = pd.DataFrame(encoding_df[encoding_df > encoding_df.std() * thresh])
hw_neg_df = pd.DataFrame(encoding_df[encoding_df < -encoding_df.std() * thresh])

It seems like you are trying to get the most extreme values away from the mean, but you don't really have the mean here. Shouldn't it be something like this?
hw_pos_df = pd.DataFrame(encoding_df[encoding_df > encoding_df.mean() + encoding_df.std() * thresh])
hw_neg_df = pd.DataFrame(encoding_df[encoding_df < encoding_df.mean() - encoding_df.std() * thresh])

Add reconstruction based analysis

I need to perform a dimesionality reduction algorithm analysis of reconstruction costs. I will slowly increase the number of latent space features and observe how this relates to reconstruction cost for several algorithms.

This is much easier to do for PCA, ICA, and NMF. It will require a substantial refactoring of tybalt (see #74) and adage in order to facilitate these keras based models

Simulation Experiments

Introduced in #103 - a simulation experiment is worth exploring. Currently, the simulation experiment samples the following signals (copy and pasted from #103):

  1. Groups (based on different normal distributions along given across axes)
  2. Nonlinear functions (any transformation to a randomly sampled vector)
  3. Cell-types (based on a different proportions of normal distributions across given axes)
  4. Presence/absence (random determination if feature is present)
  5. Random noise features

As mentioned, some of the evals envisioned include:

  1. Ability to distinguish groups
  2. Identify nonlinear but continuous patterns
  3. Robust to noise injection
  4. Latent space arithmetic (e.g. Group 1: Yes Feature - Group 1: No Feature + Group 2: No Feature = Group 2: Yes Feature?)
  5. Generative ability of models

As suggested by @jaclyn-taroni, we will use this issue to track important citations and discuss rationale for the simulations and evals.

Recommend Projects

  • React photo React

    A declarative, efficient, and flexible JavaScript library for building user interfaces.

  • Vue.js photo Vue.js

    🖖 Vue.js is a progressive, incrementally-adoptable JavaScript framework for building UI on the web.

  • Typescript photo Typescript

    TypeScript is a superset of JavaScript that compiles to clean JavaScript output.

  • TensorFlow photo TensorFlow

    An Open Source Machine Learning Framework for Everyone

  • Django photo Django

    The Web framework for perfectionists with deadlines.

  • D3 photo D3

    Bring data to life with SVG, Canvas and HTML. 📊📈🎉

Recommend Topics

  • javascript

    JavaScript (JS) is a lightweight interpreted programming language with first-class functions.

  • web

    Some thing interesting about web. New door for the world.

  • server

    A server is a program made to process requests and deliver data to clients.

  • Machine learning

    Machine learning is a way of modeling and interpreting data that allows a piece of software to respond intelligently.

  • Game

    Some thing interesting about game, make everyone happy.

Recommend Org

  • Facebook photo Facebook

    We are working to build community through open source technology. NB: members must have two-factor auth.

  • Microsoft photo Microsoft

    Open source projects and samples from Microsoft.

  • Google photo Google

    Google ❤️ Open Source for everyone.

  • D3 photo D3

    Data-Driven Documents codes.