I'm sure this is my fault, but I can't see what I'm doing wrong.
Given the following simple program, when the input is a 440Hz sine wave, I expect to see a single peak in the frequency domain. Giving the same input to an online FFT calculator, the expected output is obtained.
Can you point out my mistake, or is go-dsp doing something strange?
The Program
package main

import (
    "bufio"
    "fmt"
    "github.com/mjibson/go-dsp/fft"
    "github.com/mjibson/go-dsp/window"
    "math"
    "os"
    "strconv"
)

func main() {
    file, err := os.Open(os.Args[1])
    if err != nil {
        panic(err)
    }

    scanner := bufio.NewScanner(file)
    values := make([]float64, 0)
    for scanner.Scan() {
        line := scanner.Text()
        value, e := strconv.ParseFloat(line, 64)
        if e != nil {
            panic(e)
        }
        values = append(values, value)
    }

    fftComplex := doFft(values)
    fftReal := realize(fftComplex)

    for _, freq := range fftReal {
        fmt.Println(freq)
    }
}

func doFft(data []float64) []complex128 {
    window.Apply(data, window.Hamming)
    return fft.FFTReal(data)
}

func realize(data []complex128) []float64 {
    realVals := make([]float64, len(data))
    for i, comp := range data {
        rel := math.Pow(real(comp), 2)
        img := math.Pow(imag(comp), 2)
        realVals[i] = math.Sqrt(rel + img)
    }
    return realVals
}
It's run like:
go run fft.go awave.dat > awave-dsp.fft
The Input
Data is here, it's 440Hz sine. Plotted it looks like:

gnuplot -e "plot 'awave.dat'; pause -1"
The Output
Data is here. Plotted it looks like:
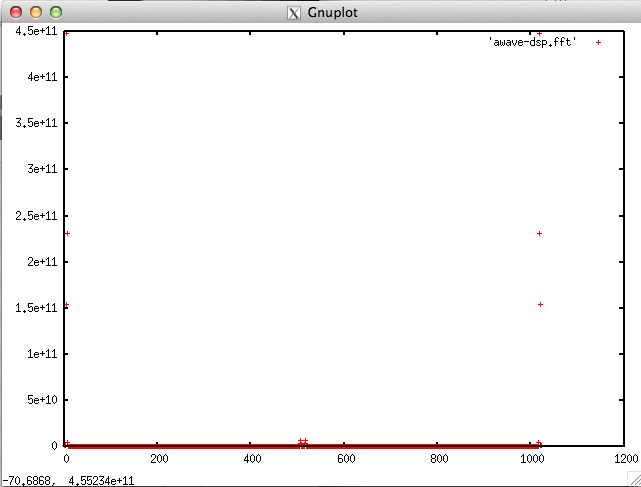
The x-scale here isn't Hz, it's just the bin numbers from FFTReal.
gnuplot -e "plot 'awave-dsp.fft'; pause -1"
Expected Output
Using the same input, and the online FFT mentioned above, I get the expected output:


