Giter Site home page Giter Site logo

redisgrafana / grafana-redis-datasource Goto Github PK

View Code? Open in Web Editor NEW
144.0 13.0 38.0 48.52 MB

Redis Data Source for @Grafana allows connecting to any @Redis database On-Premises and in the Cloud.

Home Page: https://redisgrafana.github.io

License: Apache License 2.0

JavaScript 0.18% Go 64.79% TypeScript 34.83% Dockerfile 0.10% Shell 0.10%
grafana grafana-datasource grafana-plugin redis redis-database

grafana-redis-datasource's Introduction

Redis Data Source for Grafana

Dashboard

Grafana 8 Redis Data Source Redis Application plugin Redis Explorer plugin Go Report Card CI codecov Language grade: JavaScript

Introduction

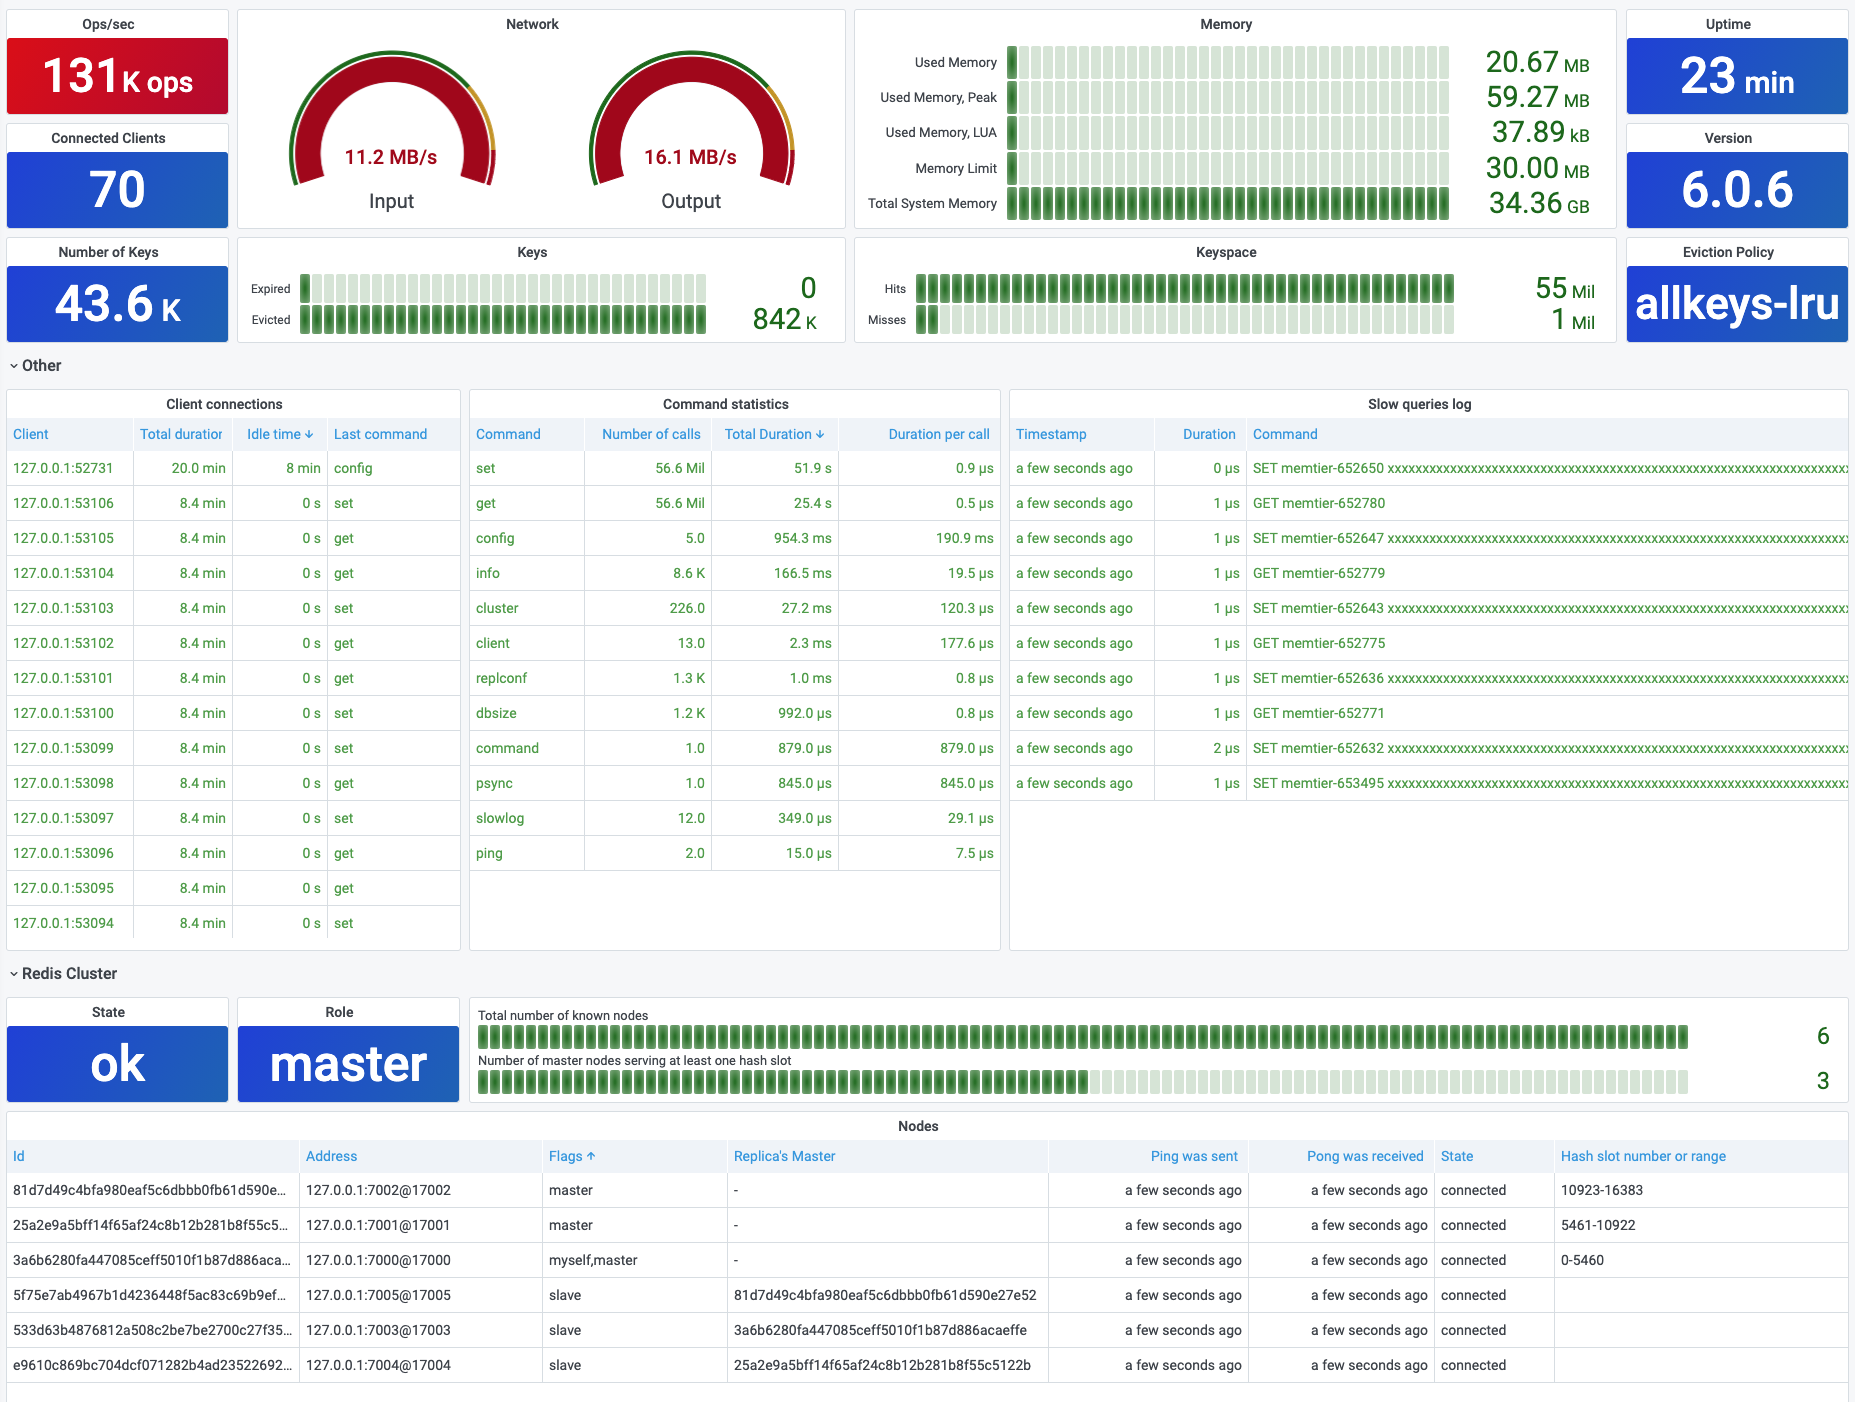
The Redis Data Source for Grafana is a plugin that allows users to connect to any Redis database On-Premises and in the Cloud. It provides out-of-the-box predefined dashboards and lets you build customized dashboards to monitor Redis and application data.

Demo

Demo is available on demo.volkovlabs.io:

Requirements

  • Grafana 8.0+ is required for Redis Data Source 2.X.
  • Grafana 7.1+ is required for Redis Data Source 1.X.

Redis Application plugin

You can add as many data sources as you want to support multiple Redis databases. Redis Application plugin helps manage various Redis Data Sources and provides Custom panels.

Getting Started

Redis Data Source can be installed from the Grafana Marketplace or use the grafana-cli tool to install from the command line:

grafana-cli plugins install redis-datasource

Grafana Marketplace

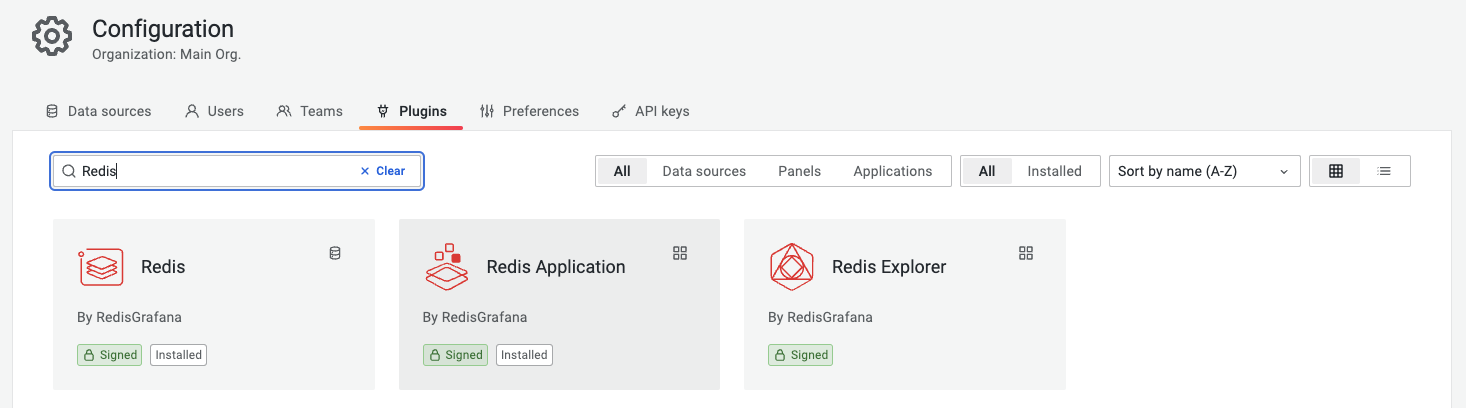
For Docker instructions and installation without Internet access, follow the Quickstart page.

Configuration

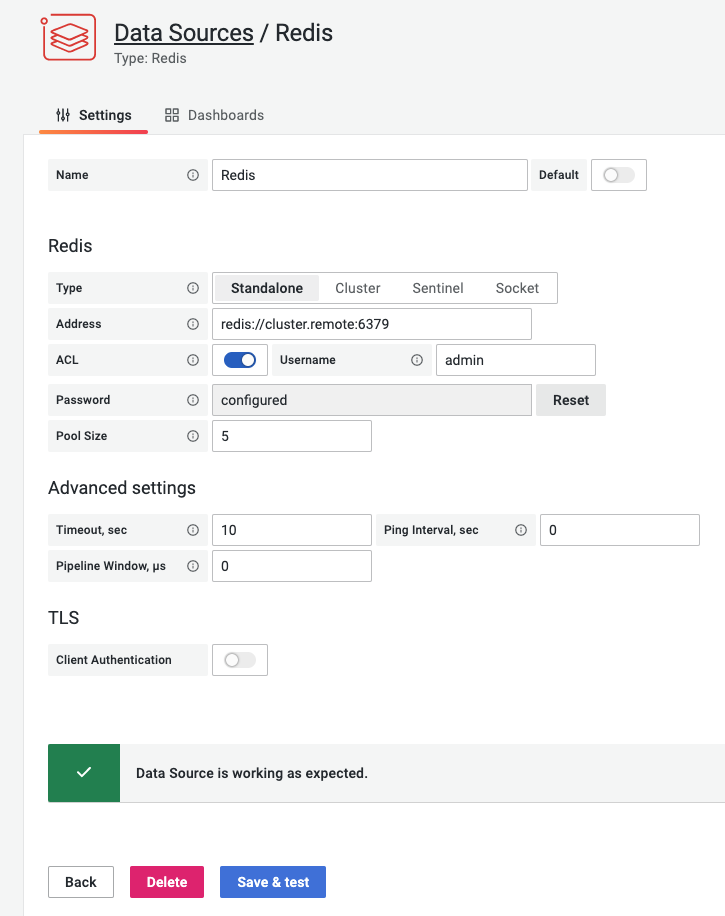
Data Source allows to connect to Redis using TCP port, Unix socket, Cluster, Sentinel and supports SSL/TLS authentication. For detailed information, take a look at the Configuration page.

Datasource

Documentation

Please take a look at the Documentation to learn more about plugin and features.

Supported commands

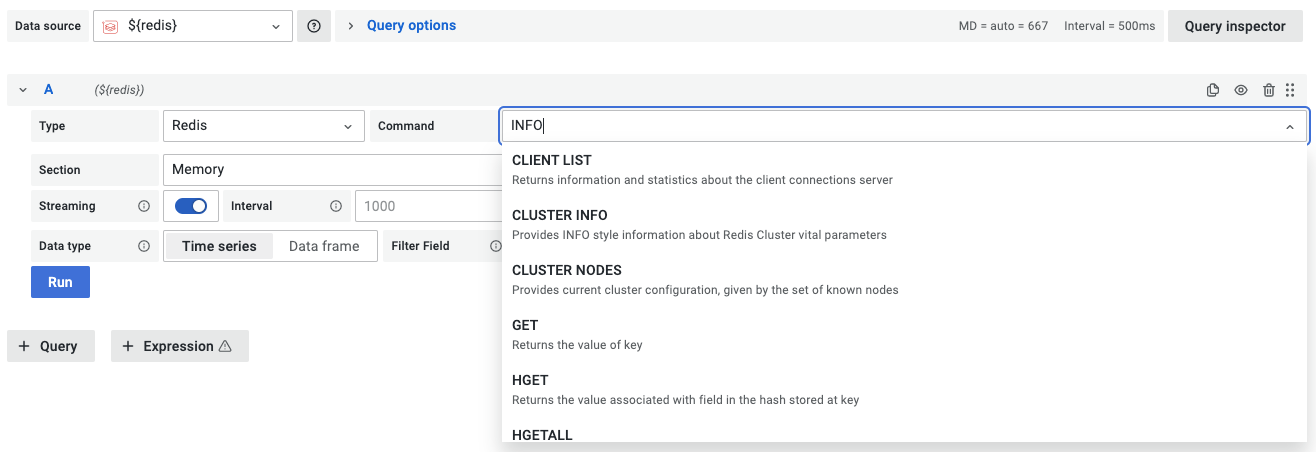
List of all supported commands and how to use them with examples you can find in the Commands section.

Query

Development

Developing Redis Data Source page provides instructions on building the data source.

Are you interested in the latest features and updates? Start nightly built Docker image for Redis Application plugin, including Redis Data Source.

Feedback

We love to hear from users, developers, and the whole community interested in this plugin. These are various ways to get in touch with us:

  • Ask a question, request a new feature, and file a bug with GitHub issues.
  • Star the repository to show your support.

Contributing

  • Fork the repository.
  • Find an issue to work on and submit a pull request.
  • Could not find an issue? Look for documentation, bugs, typos, and missing features.

License

  • Apache License Version 2.0, see LICENSE.

grafana-redis-datasource's People

Contributors

asimonok avatar banker avatar burmisov avatar danni-m avatar dependabot[bot] avatar dpipemazo avatar filipecosta90 avatar itamarhaber avatar michael-michalski avatar mikhail-vl avatar ryantxu avatar santriseus avatar slorello89 avatar ultraseamus avatar viragtripathi avatar yongs2 avatar

Stargazers

 avatar  avatar  avatar  avatar  avatar  avatar  avatar  avatar  avatar  avatar  avatar  avatar  avatar  avatar  avatar  avatar  avatar  avatar  avatar  avatar  avatar  avatar  avatar  avatar  avatar  avatar  avatar  avatar  avatar  avatar  avatar  avatar  avatar  avatar  avatar  avatar  avatar  avatar  avatar  avatar  avatar  avatar  avatar  avatar  avatar  avatar  avatar  avatar  avatar  avatar  avatar  avatar  avatar  avatar  avatar  avatar  avatar  avatar  avatar  avatar  avatar  avatar  avatar  avatar  avatar  avatar  avatar  avatar  avatar  avatar  avatar  avatar  avatar  avatar  avatar  avatar  avatar  avatar  avatar  avatar  avatar  avatar  avatar  avatar  avatar  avatar  avatar  avatar  avatar  avatar  avatar  avatar  avatar  avatar  avatar  avatar  avatar  avatar  avatar  avatar

Watchers

 avatar  avatar  avatar  avatar  avatar  avatar  avatar  avatar  avatar  avatar  avatar  avatar  avatar

grafana-redis-datasource's Issues

Ploting LRANGE

Summary

I’m working using redis’ lists, in my case I get the value with the query (CLI) “LRANGE key idx idx”. I can’t chart it but I can see in a table. It's possible support LRANGE for ploting? Best regards.

imagen

imagen

Unable to connect to redis-datasource

Summary

I'm seeing error while connecting to redis-data source running on docker. /api/datasources/1/health is failing with HTTP 503 after 2.5 minutes. This may need some timeout set.

Snapshot

grafana_redis_timeout

Support Connecting to Redis via Unix Socket

Is your enhancement related to a problem? Please describe.

It would be nice to support connecting to and querying redis via a unix socket. We use this form of communicating with Redis frequently at Elementary since we run redis on the edge on our robots. We are currently spinning up our grafana server also on the edge for local development and it makes our docker-compose configuration cleaner if we don't have to map ports onto the host or assume container/service names.

Describe the solution you'd like

Allow for something like below:

Screenshot from 2020-08-27 12-03-26

Describe alternatives you've considered

We can (and currently do) support connection via TCP. When running grafana in its own container though the data source either needs to be:

  1. localhost:port, in which case we need to map the port from the redis container onto the host machine. This adds a potentially preventable port mapping
  2. container_name:port in which case we're hardcoding a dependency that our redis is launched with a certain container name which is not ideal.

Thanks for taking a look and apologies for filing so many issues in the past week or so. The grafana integration is really fantastic as-is and this would just make it a bit better for us. I do realize this is a fairly niche use case.

Timeseries data time stamp truncated to seconds

Using the timeseries commands to perform tasks.range queries the corresponding data frame built has the milliseconds truncated.

Reviewing the code this makes sense as the conversion from epoch to go time object using time.Unix has nanoseconds set to zero and seconds value divided by 1000.

There may be a reason for this, but effectively this means that data at higher resolutions than 1 second are displayed at the same time point.

If someone could please confirm if this is by design or an improvement that could be made?

Slowlog returns 'No data' for Redis 3.0.6

image

slowlog get has results

image

----------------------------------------------------------------------------------------------------
if slowlog get is empty list
image
it will be normal
My Redis version is 3.0.6 ,grafana version is 7.0.3

Redis Timeseries only 30 seconds of data displayed on Raspberry Pi

Summary

Hi guys
Firstly thanks for your hard work on building this software. I am a newbie to both grafana and redis. So please forgive my ignorance. I have tried to read manuals and follow guidance notes as much as possible.
I have a Redis instance receiving interrupt drive updates from a heading sensor, so only updates when sensor changes heading. I am using the Timeseries module with TS.MADD to input data into Redis which looks like it is working as designed.

I have built a grafana dashboard with a panel to output heading. Everything appears to work as expected for about 30 seconds then the output repeats the value that was read at the 30 second point in time. Looking at the output from the grafana data source query it build s three ts.range queries that cover the 30 second time period, then no longer changes the unix time in the ts.range query which sort corresponds to why I see the same data repeating.

When dashboard refreshed get another 30seconds of activity.

Is there a parameter I can change to make the panel span a wider time window without repeating the same value?

image

Relevant information

Raspberry Pi4
Linux bopeep 5.4.72-v7l+ #1356 SMP Thu Oct 22 13:57:51 BST 2020 armv7l GNU/Linux
pi@bopeep:~$ grafana-server -v
Version 7.2.2 (commit: ad9d408ac2, branch: HEAD)
with plugins
Reids Datasource v1.2.1
Redis-app v1.01

pi@bopeep:~$ redis-server -v
25417:C 25 Oct 2020 19:26:39.594 # oO0OoO0OoO0Oo Redis is starting oO0OoO0OoO0Oo
25417:C 25 Oct 2020 19:26:39.595 # Redis version=6.0.8, bits=32, commit=00000000, modified=0, pid=25417, just started

with modules RedisTimeseries and RedisGears installed
Client
Ubuntiu 20.4 (64bit) Firefox 82.1(64bit)

log extrat to show repeating "ts.range" "master:bopeep:hull:imu:euler_headinguires which don ot increament the unixtime from to parameters -

1603655052.511886 [0 127.0.0.1:39574] "ts.range" "master:bopeep:hull:imu:euler_heading" "1603654738875" "1603655038876"
1603655052.518000 [0 127.0.0.1:39574] "ts.range" "master:bopeep:hull:tpa:base_air_pressure" "1603654738876" "1603655038877"
1603655052.521343 [0 127.0.0.1:39574] "ts.range" "master:bopeep:hull:imu:euler_heading" "1603654738877" "1603655038877"
1603655052.540356 [0 127.0.0.1:39574] "info" "stats"
1603655052.940467 [0 127.0.0.1:39574] "ts.range" "master:bopeep:hull:imu:euler_heading" "1603654738875" "1603655038876"
1603655052.963840 [0 127.0.0.1:39574] "ts.range" "master:bopeep:hull:tpa:base_air_pressure" "1603654738876" "1603655038877"
1603655052.997358 [0 127.0.0.1:39574] "ts.range" "master:bopeep:hull:imu:euler_heading" "1603654738877" "1603655038877"
1603655054.600913 [0 127.0.0.1:39578] "SELECT" "0"
1603655054.601426 [0 127.0.0.1:39578] "info" "stats"
1603655054.602670 [0 127.0.0.1:39578] "ts.range" "master:bopeep:hull:imu:euler_heading" "1603654738875" "1603655038876"
1603655054.606709 [0 127.0.0.1:39578] "ts.range" "master:bopeep:hull:tpa:base_air_pressure" "1603654738876" "1603655038877"
1603655054.610233 [0 127.0.0.1:39578] "ts.range" "master:bopeep:hull:imu:euler_heading" "1603654738877" "1603655038877"
1603655054.617163 [0 127.0.0.1:39578] "info" "stats"
1603655054.935549 [0 127.0.0.1:39578] "ts.range" "master:bopeep:hull:imu:euler_heading" "1603654738875" "1603655038876"
1603655054.991245 [0 127.0.0.1:39578] "ts.range" "master:bopeep:hull:tpa:base_air_pressure" "1603654738876" "1603655038877"
1603655054.998787 [0 127.0.0.1:39578] "ts.range" "master:bopeep:hull:imu:euler_heading" "1603654738877" "1603655038877"

getInstance error: ERR command is not allowed

Summary

When adding Redis Cluster datasource to Grafana, we are getting the following error message:
getInstance error: ERR command is not allowed

Relevant information

Error:
image

Connection string from:
image

redis://redis-14224.rediscluster.qa.xxxxxxxx.com:14224

following error:
getInstance error: ERR command is not allowed

Also trying a connection string (note the difference of '/9' at end of URL):
redis://redis-14224.rediscluster.qa.xxxxxxxx.com:14224/9

produces the following message:
getInstance error: no pools available

Can you please help or advise on configuration of Redis Cluster datasource?

Thanks,
A.

Connection issue to redis deployed in k8s

Summary

Connection issue to redis deployed in k8s.

Relevant information

I have setup a redis-sentinel database using bitnami/redis helm chart. However, on connecting to it, it always say plugin health check failed. No helpful logs as well to debug this issue.

yarn build fail

⠋ Compiling...  Trace: EACCES: permission denied, open '/home/guy/redisclients/grafana-redis-datasource/dist/module.js'
      at /home/guy/redisclients/grafana-redis-datasource/node_modules/@grafana/toolkit/src/cli/utils/useSpinner.js:24:29
      at step (/home/guy/redisclients/grafana-redis-datasource/node_modules/@grafana/toolkit/node_modules/tslib/tslib.js:136:27)
      at Object.throw (/home/guy/redisclients/grafana-redis-datasource/node_modules/@grafana/toolkit/node_modules/tslib/tslib.js:117:57)
      at rejected (/home/guy/redisclients/grafana-redis-datasource/node_modules/@grafana/toolkit/node_modules/tslib/tslib.js:108:69)
✖ EACCES: permission denied, open '/home/guy/redisclients/grafana-redis-datasource/dist/module.js'
error Command failed with exit code 1.
info Visit https://yarnpkg.com/en/docs/cli/run for documentation about this command.

TimeSeries timestamp seems to be truncated by plugin

Describe the bug

I am a noob so if this is not a bug but user error then I apologise in advance.
I am adding data to a timeseries. The data looks correct when queried using redis-cli, but when i try to query using the grafana plugin, it appears that the timestamps are being truncated so that the date shows way in the past.
e.g.
from redis-cli:

ts.get order:revenue

  1. (integer) 1602675285 (which translates to 14 October 2020 11:34:45)
  2. 3927.09

from grafana query inspector:
time
value
1970-01-19 14:11:15
3927

If you convert "1970-01-19 14:11:15" into an integer it's 1602675 which is the first 7 values of the value in the database.

Version

plugin version 1.2.0
grafana version 7.2.1
hosted redis version 6.0.5
RedisTimeSeries Ver 1.2.7

Steps to reproduce

Expected behavior

Screenshots

Additional context

Data outside time range in Grafana when doing `TS.MRANGE`

Describe the bug

When using the TS.MRANGE query in grafana we are frequently seeing "Data out of time range" appear. This unfortunately can't be turned off in grafana.

Screenshot from 2020-08-25 16-51-32

For the example shown, the graph query and config can be seen here:

Screenshot from 2020-08-25 16-52-21

We're doing a time-based query here over per-process data, i.e. there will be an entry for each process in the system. The issue seems to be coming from when there is a particular process which does not have any data in the given window, but existed at an earlier time:

Screenshot from 2020-08-25 16-53-15

Here, we see that the time window for the query was 16:47 - 16:52 but this kworker process which likely only existed well before then returns a single 0 value with a timestamp of 15.46.

I've verified the query being generated to redis time series is correct (the timestamps are in 5m intervals in the example shown).

Screenshot from 2020-08-25 16-56-08

Version

Running:

  • Redis 6.04
  • grafana-redis-datasource on commit d0476c26e67e9737c6039e5c5d03187464b05634
  • Grafana latest from Docker Hub.
  • Redis Time Series 1.2.7

Steps to reproduce

Can actually be reproduced quite effectively through just running our open-source project. Building and launching this will start up a redis, logger that uses psutil to parse filesystem stats and log them to redis time series, and a grafana instance with a new-ish build of this plugin

  1. Clone the atom repo
git clone https://github.com/elementary-robotics/atom/tree/353/metrics_redis_time_series
  1. Update + init submodules
git submodule update --init --recursive
  1. Build
docker-compose -f docker-compose-dev.yml build
  1. Launch
docker-compose -f docker-compose-dev.yml up -d

After this, you should be able to log into grafana at localhost:3001 in your browser and click into any of the dashboards from the home dashboard. The memory-live dashboard is the one with this particular graph but it shows up on most of them.

Otherwise please find a .zip file with a RDB backup + JSON dashboard configuration that should allow you to reproduce as well.

redistimeseries.zip

Expected behavior

For some metrics (which are more deterministic, have entries for each time bucket) I do not see this message. Desired behavior is not to see this message.

Graph data from HGETALL

Summary

I have a hash of days to counts stored in redis using HSET. I'm getting that data out with HGETALL. I can see it as a table, but there appears to be no way to actually graph it.

Screen Shot 2020-10-14 at 3 22 57 PM

And when I try to switch the visualization to graph I just get:

Screen Shot 2020-10-14 at 3 24 17 PM

Relevant information

There doesn't seem to be any way to switch my x-axis to use the Day values and my y-axis to the counts.

The data as stored in redis is simply a hash like:

{
    "2020-07-23": 8,
    "2020-07-26": 1,
    "2020-07-27": 1,
    "2020-07-28": 33,
    "2020-07-29": 1,
    "2020-07-30": 54,
    "2020-07-31": 40,
    "2020-08-01": 42,
    "2020-08-02": 53,
    "2020-08-04": 1,
    "2020-08-10": 2,
    "2020-08-13": 2,
    "2020-08-14": 3,
    "2020-08-18": 3,
    "2020-08-19": 2,
    "2020-08-20": 2,
    "2020-08-21": 4,
    "2020-08-22": 78,
    "2020-08-23": 19,
    "2020-08-24": 43,
    "2020-08-25": 5,
    "2020-08-26": 2,
    "2020-08-27": 4,
    "2020-08-28": 1,
    "2020-08-31": 3,
    "2020-09-02": 1,
    "2020-09-04": 1,
    "2020-09-09": 1,
    "2020-09-10": 14,
}

Redis Datasource is Unsigned. K8S+Helm installation

Describe the bug

On installation of this plugin, I have an error:
Failed to load plugin logger=plugins error="plugin "redis-datasource" is unsigned" pluginPath=/var/lib/grafana/plugins/redis-datasource/dist

Version

v1.1.1

Steps to reproduce

  1. Add redis-datasource, on plugins section
  2. Relaunch grafana deployment
  3. Got an error on log, error="plugin "redis-datasource" is unsigned"

Expected behavior

It should be installed and visible on my grafana instance.

Additional context

Grafana is installed on a Kubernetes 1.16 instance, with helm 3.

SLOWLOG GET only returns 10 rows

In Plugin, SLOWLOG GET returns only 10 Rows with timestamp, duration and command. I need the data of more than 10. Eg. 128 Slowlog.
I also tried SLOWLOG GET 128 in custom command option, However in that case it's not showing like the field wise.

Is it not supported or If anyone can help.

Return 0 for all buckets with 0 count on time-series `TS.RANGE` queries

Is your enhancement related to a problem? Please describe.

When using redis time series TS.RANGE commands with COUNT aggregation, grafana will show us interpolated lines between data samples:

Screenshot from 2020-08-21 08-20-19

Looking at the data from the query, the data source is returning a sparse set of data, which makes sense.

Screenshot from 2020-08-21 08-20-38

Describe the solution you'd like

It would be ideal to be able to clearly see time buckets with 0 data logged and have grafana show "0" for those buckets. I don't see the setting grafana-side and I see that some other grafana data sources have query "fill" options that will fill in blank time buckets with null values.

Describe alternatives you've considered

An alternative would be to file this grafana-side -- seems to be something they should support a bit more natively. I also might be missing something.

Additional context

This is using the latest grafana/grafana image launched with "GF_INSTALL_PLUGINS=redis-datasource". Redis 6.0.4 with Redis Time series 1.2.7 compiled from source.

How to connect to Redislabs cluster?

Summary

How do we connect to Redislabs cluster? If cluster FQDN is clusterA.production.int, default cluster port is 9443, and database port is customized to 15000 for example, what is the connection URL?

We're keep getting this error: getInstance error: no pools available

This is not community Redis where the default port is 6379.

The screenshot in the doc is not correct for connecting to a real Redis cluster.

Relevant information

Support fetching from RedisJSON datasource

Is your enhancement related to a problem? Please describe.

Ability to display data stored in RedisJSON in Grafana. Most notably for the table plugin.

Describe the solution you'd like

Ability to connect to a ReidsJSON datastore, query, search, filter and display data Grafana.

Describe alternatives you've considered

JSON API Grafana datasource which connects to http JSON PATH compliant APIs.

Additional context

Plugin executable missing for arm64 architecture

Describe the bug

ARM64 executable missing.

Version

Redis plugin for Grafana v1.1.2
Grafana v7.1.3
Ubuntu focal v20.04 (arm64)

Steps to reproduce

  1. Install plugin using sudo grafana-cli plugins install redis-datasource;
  2. Restart grafana-server service;
  3. Service status shows error: lvl=eror msg="Failed to start plugin" logger=plugins.backend pluginId=redis-datasource error="fork/exec /var/lib/grafana/plugins/redis-datasource/redis-datasource_linux_arm64: no such file or directory";
  4. When saving datasource error is shown: Plugin health check failed.

Expected behavior

Error should not be shown in service status and plugin should work.

I believe executable for arm64 is expected in /var/lib/grafana/plugins/redis-datasource. Currently it contains only following:

redis-datasource_darwin_amd64
redis-datasource_linux_amd64
redis-datasource_windows_amd64.exe

Store streaming data from Redis Enterprise Cloud

Summary

We are using Redis Enterprise Cloud on GCP. Since this is a managed service, we can only use the default Enterprise Cloud console for monitoring. The data on Enterprise Console is not granular enough and it cannot send different alerts to us. This plugin's Redis Streaming dashboard might be a solution for us. However, it seems like this plugin can only display live data, is it? Once I refresh my Grafana browser, it re-collects the display data. Is there any methods that we can store these streaming data locally for history searching? As far as I know, we cannot use Prometheus directly with Redis Enterprise Cloud.

Relevant information

This plugin is awesome though, very handy to use for testing Redis database. 😄

Cannot specify more than 6 addresses in cluster configuration

Describe the bug

Cannot specify more than 6 addresses in cluster configuration

Version

1.2.1

Steps to reproduce

In one of our setups we are using version 1.2.0 of redis plugin and can successfully add more that 6 redis node addresses into a datasource. However, in 1.2.1 version whenever more that 6 addresses a provided, there is an error (see the screenshot). All of the addresses are actually working, i.e. if provided in different combinations and less than 6 in total.

Version of grafana is same in both instances: v7.1.1 (3039f9c3bd)

Expected behavior

It should be possible to provide more than 6 addresses for redis cluster

Improve INFO CommandStats for Redis 6.2

Describe the solution you'd like

Redis 6.2 extends INFO COMMANDSTATS to have:

  • failed_calls in - so we can keep track of errors that happen from the command itself, broken by command.
  • rejected_calls - so we can keep track of errors that were triggered outside the command processing per se ( example of wrong arity, oom, etc... )

Additional context

Sample ( notice rejected_calls ):

127.0.0.1:6379> set k 
(error) ERR wrong number of arguments for 'set' command
127.0.0.1:6379> info commandstats
# Commandstats
cmdstat_set:calls=0,usec=0,usec_per_call=0.00,rejected_calls=1,failed_calls=0
cmdstat_info:calls=8,usec=1077,usec_per_call=134.62,rejected_calls=0,failed_calls=0

Thanks to @filipecosta90 for pointing it out.

ts.mrange returns no data when label has spaces within

ts.mrange returns no data when label has spaces within

Example command: ts.mrange - + WITHLABELS FILTER location="New Paltz" metric=feels_like mode=hourly
redis-cli output:

1) 1) "weather:New Paltz:hourly:feels_like"
   2) 1) 1) "location"
         2) "New Paltz"
      2) 1) "metric"
         2) "feels_like"
      3) 1) "mode"
         2) "hourly"
   3)  1) 1) (integer) 1597770000000
          2) 77.72
       2) 1) (integer) 1597773600000
          2) 77.92
...

Grafana query:

{
  "request": {
    "url": "api/ds/query",
    "method": "POST",
    "data": {
      "queries": [
        {
          "command": "ts.mrange",
          "filter": "location=\"New Paltz\" metric=feels_like mode=hourly",
          "hide": false,
          "legend": "location",
          "query": "",
          "refId": "B",
          "type": "timeSeries",
          "value": "metric",
          "datasource": "Redis",
          "key": "",
          "datasourceId": 1,
          "intervalMs": 300000,
          "maxDataPoints": 1458,
          "orgId": 1
        }
      ],
      "range": {
        "from": "2020-08-18T15:52:27.427Z",
        "to": "2020-08-24T00:00:00.000Z",
        "raw": {
          "from": "now-6h",
          "to": "2020-08-24T00:00:00.000Z"
        }
      },
      "from": "1597765947427",
      "to": "1598227200000"
    }
  },
  "response": {
    "results": {
      "B": {
        "refId": "B",
        "series": null,
        "tables": null,
        "dataframes": null
      }
    }
  }
}

Allow to run queries from [Explore] tab in grafana

Cannot run query from Expore tab in grafana.

  1. Example of get command (cannot edit the key at all):
    image

  2. Also cannot run clusterINFO command
    image

Describe the solution you'd like

To be able to run queries from Expore tab the same as inside grafana dashboard widgets.

Additional context

It works well in dashboard widgets but not with the expore mode.

Thanks

Multi-value variables with redis datasource

Summary

Hi, I started using this datasource recently and I had a special use case that I don't know is feasible or not.
I have a first grafana variable that is a multi-value select. Its source is a Redis instance.
If I select more than one value the result is stored in the variable as {1,2,3} (if I selected 1,2 and 3 in first select)
My goal is to use these values to get multiple keys in another grafana redis variable.

Is there something I didn't understand or is it impossible?

Thank you in advance

Graph data from HMGET by using streaming

Summary

I have a hash data like this and update value each 10 seconds.

test1        10
test2        20
test3        30
test4        40

I want to get that data out with HMGET and monitor by streaming like this.
image

Relevant information

Grafana: v7.2.1 windows
ReidsDatasource: v1.2.0

When I try to switch the visualization to graph I can't get.
And when I set streaming at visual of table, I get only last data of hash.
image

redis_datasource_darwin_amd64 cannot be opened because the developer cannot be verified

Problem

Ran into issue while opening grafana (standalone) with redis-datasource plugin installed. Pop-up was prompted saying - "redis_datasource_darwin_amd64 cannot be opened because the developer cannot be verified"

Solution

System Preferences > Security & Privacy -> set to allow redis-datasource_darwin_amd64

Error Message

Screen Shot 2020-11-25 at 12 46 30 AM

Note

This should be common issue for people installing Redis-datasource. We need to address this issue in any of documentation. Any thoughts?

All Redis Datasource timeout when one is not reachable

Describe the bug

All Datasource timeout when one is not reachable

Version

1.2.0

Steps to reproduce

  1. Create more than one redis datasource, one that isn't reachable
  2. Create dashboard for each datasource.
  3. Goto the reachable datasource's dashboard and refresh -> Dashboard is updated with metrics
  4. Goto the unreachable datasource's dashboard and refresh -> Dashboard freezes.
  5. Go back to reachable datasource's dashboard and refresh -> Dashboard freezes.

Expected behavior

Dashboard with reachable datasource should fetch metrics indifferently of other datasource's state.

Redis Datasource Plugin Failing Health Check on Grafana

Summary

I am trying to connect my Redis server to Grafana using the plugin and am getting a plugin health check failure message when I try to save and test my datasource.

Relevant information

My Redis server is running locally on the default localhost and port(127.0.0.1:6379.) I have installed the plugin and can see it on my list of available plugins on the Grafana dashboard as well as through the grafana-cli command. I have tried many url combinations(such as localhost:6379/0, http://localhost:6379, 127.0.0.1:6379, etc.) and had no luck. Here is an image of the dashboard page that is causing the issue:

pluginhealth1

Thanks in advance for your help and guidance.

Add Unit test for Golang Backend

Is your enhancement related to a problem? Please describe.

Describe the solution you'd like

Describe alternatives you've considered

Additional context

Confused about usage of bucket parameter for aggregation queries

Hi, great work on the plugin. I have a question though. What is the purpose of the bucket input for aggregation? I feel like this is not explained well in the docs.

It was my assumption than any query that uses TS.RANGE uses the global time range as set by the dashboard. Aggregation is the only redis query where I see this aggregation bucket parameter. Also the input does not allow usage of grafana variables (it only accepts numbers). Why would global time range be a different value than the aggregation bucket? I assume bucket here means the time from now until the time you want to aggregate.

Could you please provide information on the purpose of this parameter and how to use it effectively?

Experiencing memory leak in Grafana docker seemingly stemming from this plugin

Hi I have Grafana running in a docker container (grafana/grafana) in ECS Fargate Service on AWS and I have been getting memory leaks when I (incorrectly?) enter custom redis commands in grafana.

Context

When I enter a custom command in redis timeseries datasource, there seems to be a memory leak that occurs immediately afterwards. Memory consumption goes from 20% to 95% in a few minutes while spitting out this log message. This is the log from ECS the moment before and while it happens:

t=2020-12-28T07:07:26+0000 
lvl=eror 
msg=PANIC 
logger=plugins.backend 
pluginId=redis-datasource 
command="should never get here" 
query="TS.RANGE stream:9DoF_0001:* 1609139215082 1609139245082"

I traced the error output it to this line of code:

log.DefaultLogger.Error("PANIC", "command", err, "query", qm.Query)

Is there any insight in what might be going on here? I may have written a bad query to redis timeseries (the query obviously doesn't accept wildcards) however I don't think the result should be such a severe memory leak... so I thought I'd bring up this issue.

How to query a specific db inside same redis single node

Summary

We are testing this data source with a single redis node with two DBs (db1 and db2).
When running SCARD command for several KEYS in a new panel we don't know against which db is executing the command either db1 or db2.
We would like to set a specific db to run the command/query against.

Relevant information

Grafana 7.1.1
Imported dashboard is the one that comes with datasource
A new panel inside this dashboard has been created to run command and show SCARD results.

Please do let me know if you need any additional information.
Regards,

Get "NOAUTH Authentication required" error with sentinel

I have redis/sentinel cluster. Redis and sentinel have 'requirepass' param in config (password equal).

When I configure datasource for sentinel I get error "NOAUTH Authentication required", but if I set standalone plugin works.

111

Add INFO ERRORSTATS command for Redis 6.2

Describe the solution you'd like

Redis 6.2 adds a new section to INFO, named ERRORSTATS that enables keeping track of the different errors that occur within Redis based upon the reply Error Prefix ( The first word after the "-", up to the first space ).

Additional context

Sample:

127.0.0.1:6379> auth a
(error) ERR AUTH <password> called without any password configured for the default user. Are you sure your configuration is correct?
127.0.0.1:6379> set k
(error) ERR wrong number of arguments for 'set' command
127.0.0.1:6379> ACL SETUSER alice on >p1pp0 ~cached:* +get +info
OK
127.0.0.1:6379> auth alice p1pp0
OK
127.0.0.1:6379> set a b
(error) NOPERM this user has no permissions to run the 'set' command or its subcommand
127.0.0.1:6379> info errorstats
# Errorstats
errorstat_ERR:count=2
errorstat_NOPERM:count=1

Plugin health check failed for ARM on Linux

Hi,

I would like to setup a redisTimeSeries server to be monitored by a Grafana interface, on a raspberry PI.
I was able to install a Grafana instance and a redis server.
I installed and loaded the RedisTimeSeries module and the redis-datasource plugin.
When I create the data source in Grafana and Save&Test it, I get a Plugin health check failed error.

Describe the bug

When I create the data source in Grafana and Save&Test it, I get a Plugin health check failed error.
The datasource is saved but no actual connection is executed

Version

I am running a Raspbian GNU/Linux 10 (buster), on a Raspberry Pi4
The Grafana version is the v7.1.5 (9893b8c53d) (installed via apt)
The redis version (from INFO command):
redis_version:6.0.7
redis_git_sha1:dbea5f7a
redis_git_dirty:0
redis_build_id:dfdff42c1b78b208
redis_mode:standalone
os:Linux 5.4.51-v7l+ armv7l
arch_bits:32
Redis is using the standard port: 6379
RedisTimeSeries, is the latest version cloned from the github repository.
redis-datasource plugin, is the v 1.2.0, installed via grafana-cli (I used the grafana user to install the plugin)

Steps to reproduce

Just try to create a datasource in a Grafana vanilla installation.

Expected behavior

Screenshots

Additional context

thanks a lot in advance for your help.
Francesco

How to retain matrices.

I am using this plugin to fetch data from Redis Cloud endpoints in grafana. I have entered multiple Redis datasources with datasource as variable and realtime graphs are getting plotted. But if I change datasource or refresh "streaming dashboard", Old matrices vanishes. How can I retain streaming dashboard data to get historical data in grafana.

Redis Plugin Failing Health Check on Grafana Data Source Settings

Summary

I am trying to connect my Redis server to Grafana using the plugin and am getting a plugin health check failure message when I try to save and test my datasource.

Relevant information

My Redis server is running locally on the default localhost and port(127.0.0.1:6379.) I have installed the plugin and can see it on my list of available plugins on the Grafana dashboard as well as through the grafana-cli command. I have tried many url combinations(such as localhost:6379/0, http://localhost:6379, 127.0.0.1:6379, etc.) and had no luck. Here is an image of the dashboard page that is causing the issue:
pluginhealth1

Thanks in advance for your help and guidance.

Recommend Projects

  • React photo React

    A declarative, efficient, and flexible JavaScript library for building user interfaces.

  • Vue.js photo Vue.js

    🖖 Vue.js is a progressive, incrementally-adoptable JavaScript framework for building UI on the web.

  • Typescript photo Typescript

    TypeScript is a superset of JavaScript that compiles to clean JavaScript output.

  • TensorFlow photo TensorFlow

    An Open Source Machine Learning Framework for Everyone

  • Django photo Django

    The Web framework for perfectionists with deadlines.

  • D3 photo D3

    Bring data to life with SVG, Canvas and HTML. 📊📈🎉

Recommend Topics

  • javascript

    JavaScript (JS) is a lightweight interpreted programming language with first-class functions.

  • web

    Some thing interesting about web. New door for the world.

  • server

    A server is a program made to process requests and deliver data to clients.

  • Machine learning

    Machine learning is a way of modeling and interpreting data that allows a piece of software to respond intelligently.

  • Game

    Some thing interesting about game, make everyone happy.

Recommend Org

  • Facebook photo Facebook

    We are working to build community through open source technology. NB: members must have two-factor auth.

  • Microsoft photo Microsoft

    Open source projects and samples from Microsoft.

  • Google photo Google

    Google ❤️ Open Source for everyone.

  • D3 photo D3

    Data-Driven Documents codes.