Giter Site home page Giter Site logo

glimma's Introduction

Master Devel
Build Status Build Status
codecov codecov

Glimma

Welcome to Glimma, a R package for creating interactive plots for differential expression analysis.

User suggestions are very welcome, please start an issue for usability improvements or features you'd like to see!

Installation

Using BioConductor

This is the recommended method for installing Glimma. The release version can be installed by running the code below:

source("https://bioconductor.org/biocLite.R")
biocLite("Glimma")

If a more recent version is required the developmental version:

source("https://bioconductor.org/biocLite.R")
useDevel()
biocLite("Glimma")

Bug reports

If you find bugs please let me know by submitting an issue to this project. If possible please provide a small runnable example demonstrating the bug, operating system and R version.

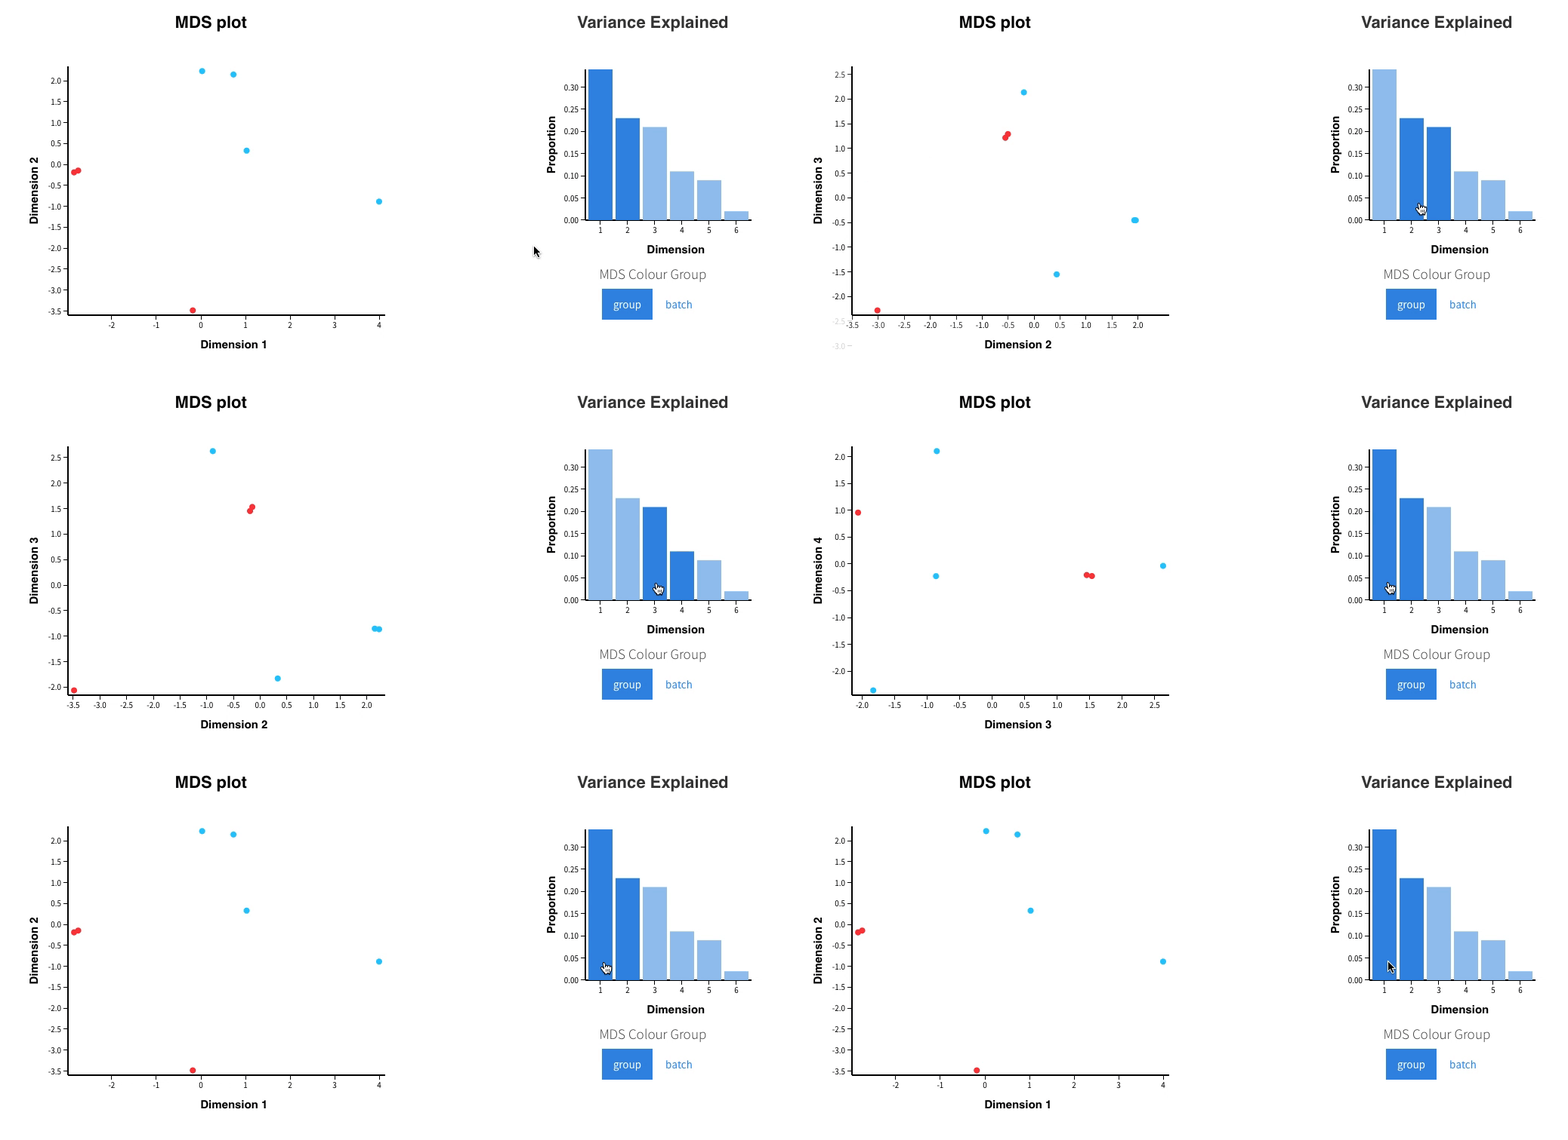
Features

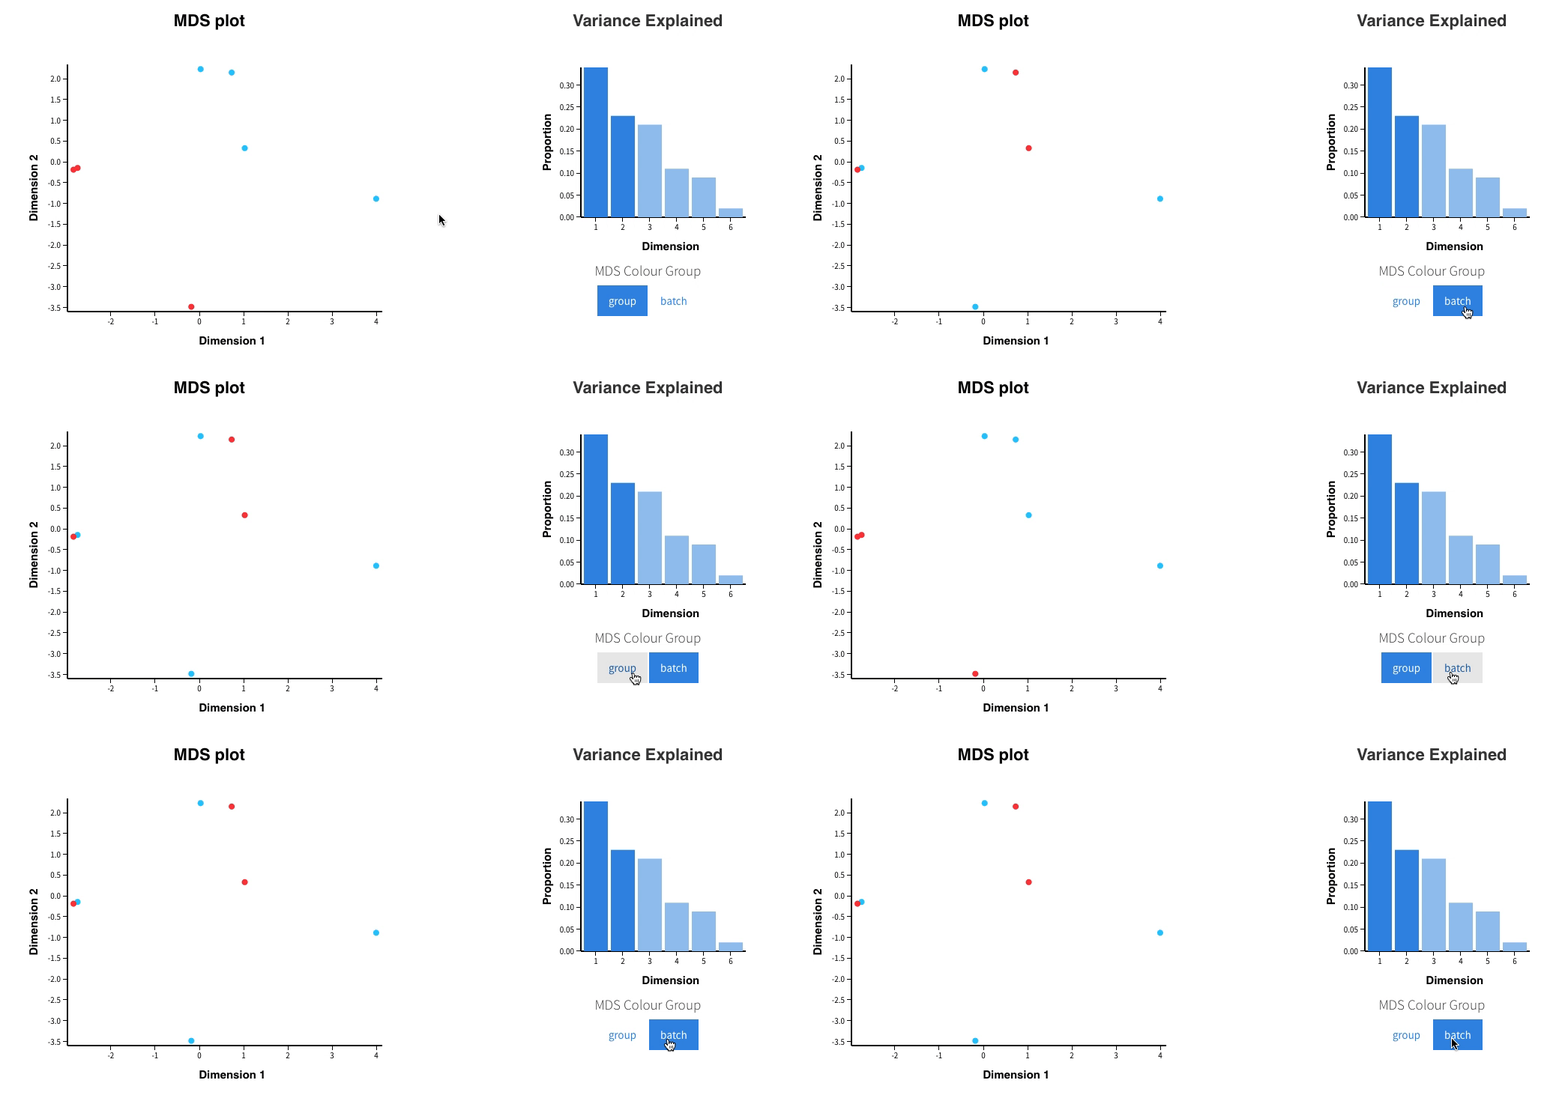
MDS Plots

Changing dimensions to plots

bar-click

Changing conditions to colour by

groups

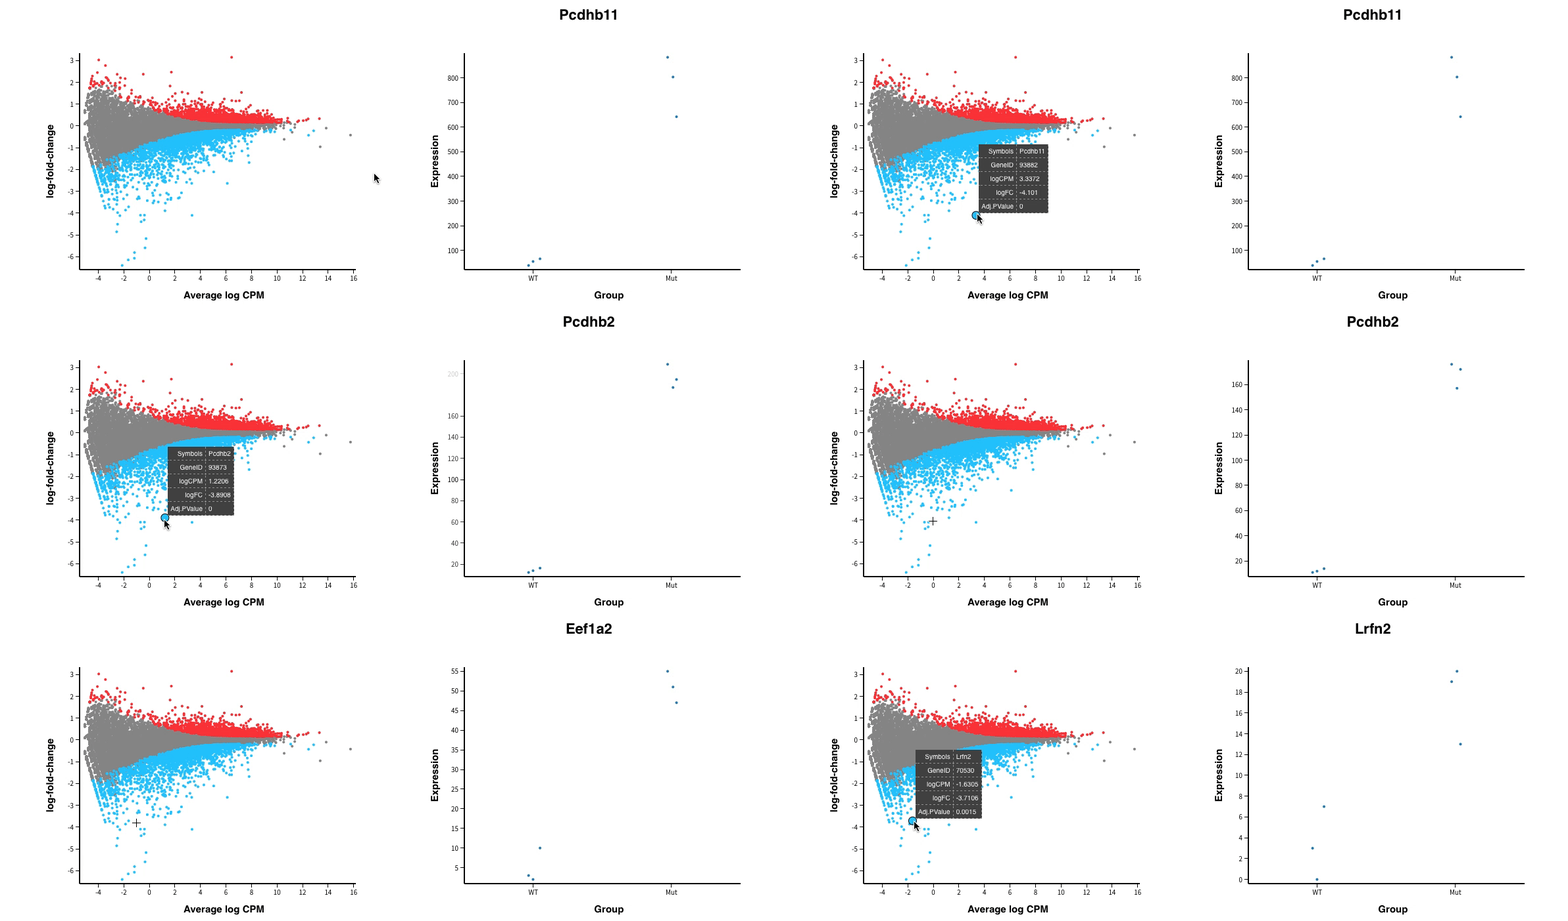
MD Plot

Hovering over points

points-hover

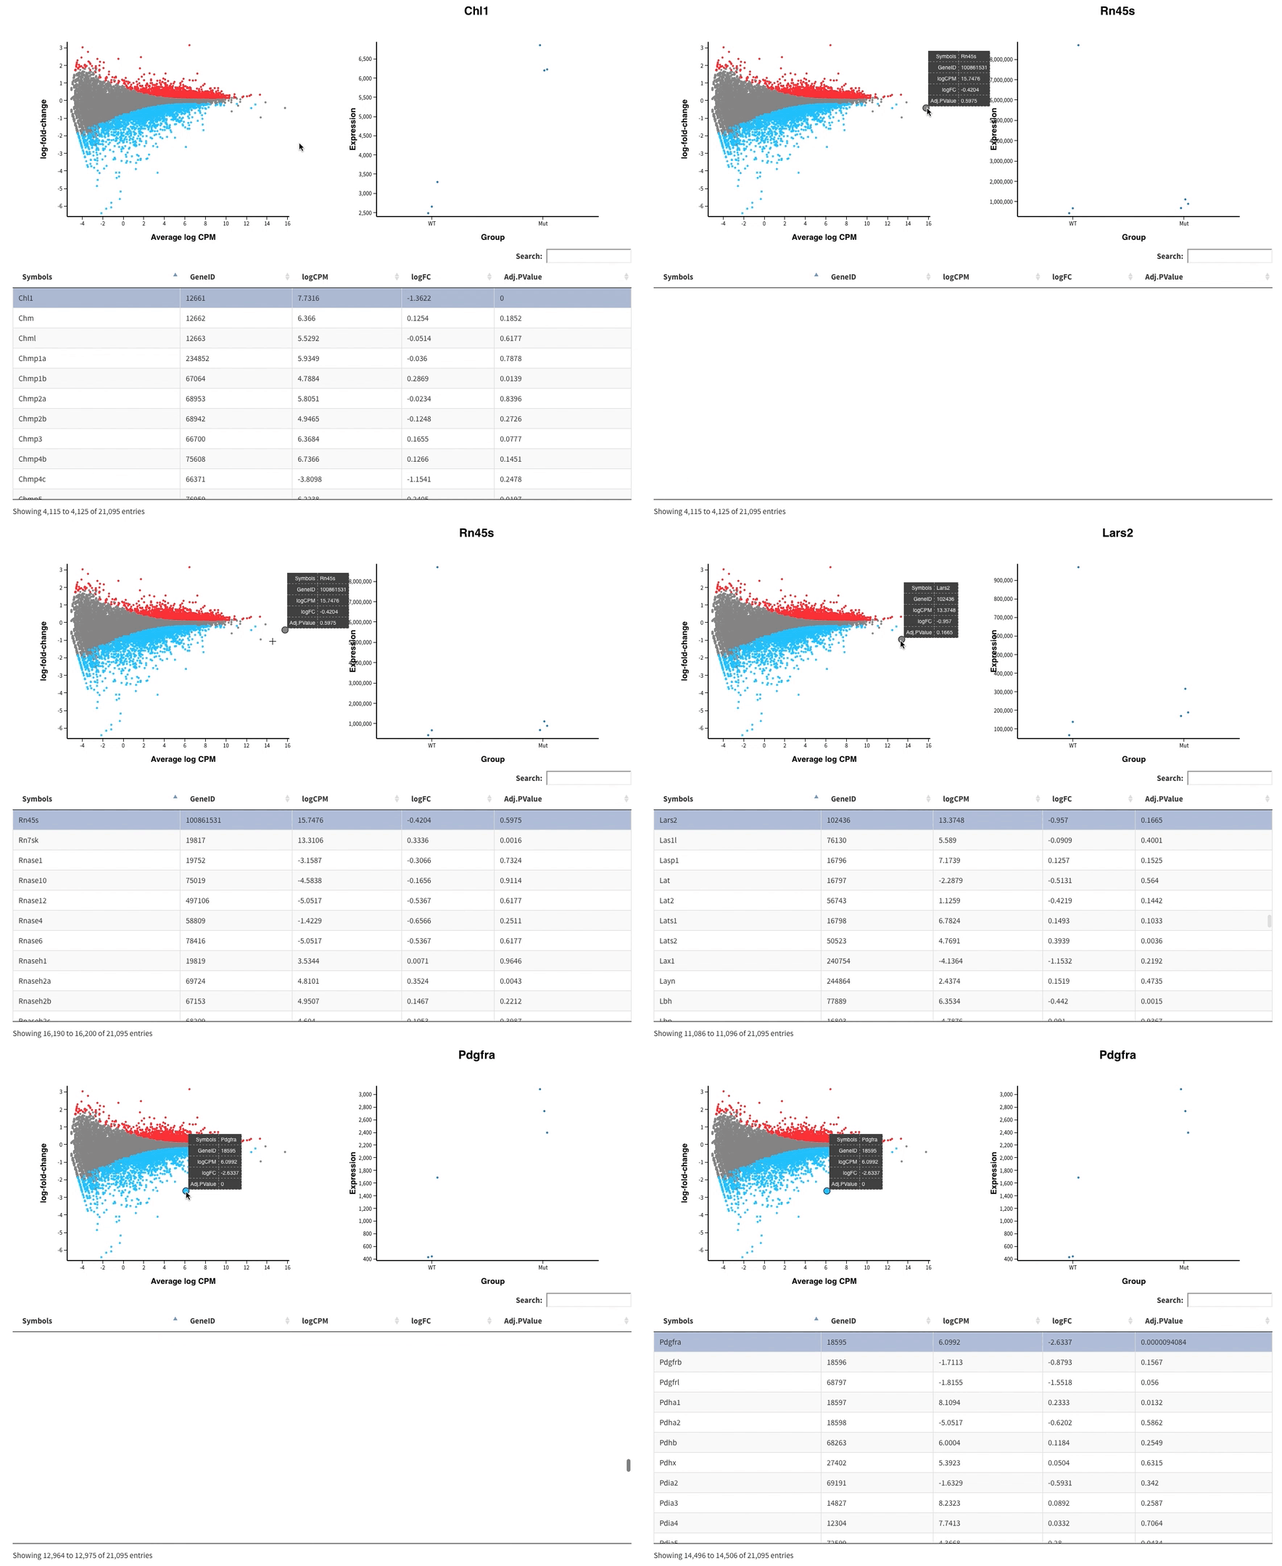
Clicking points

points-click

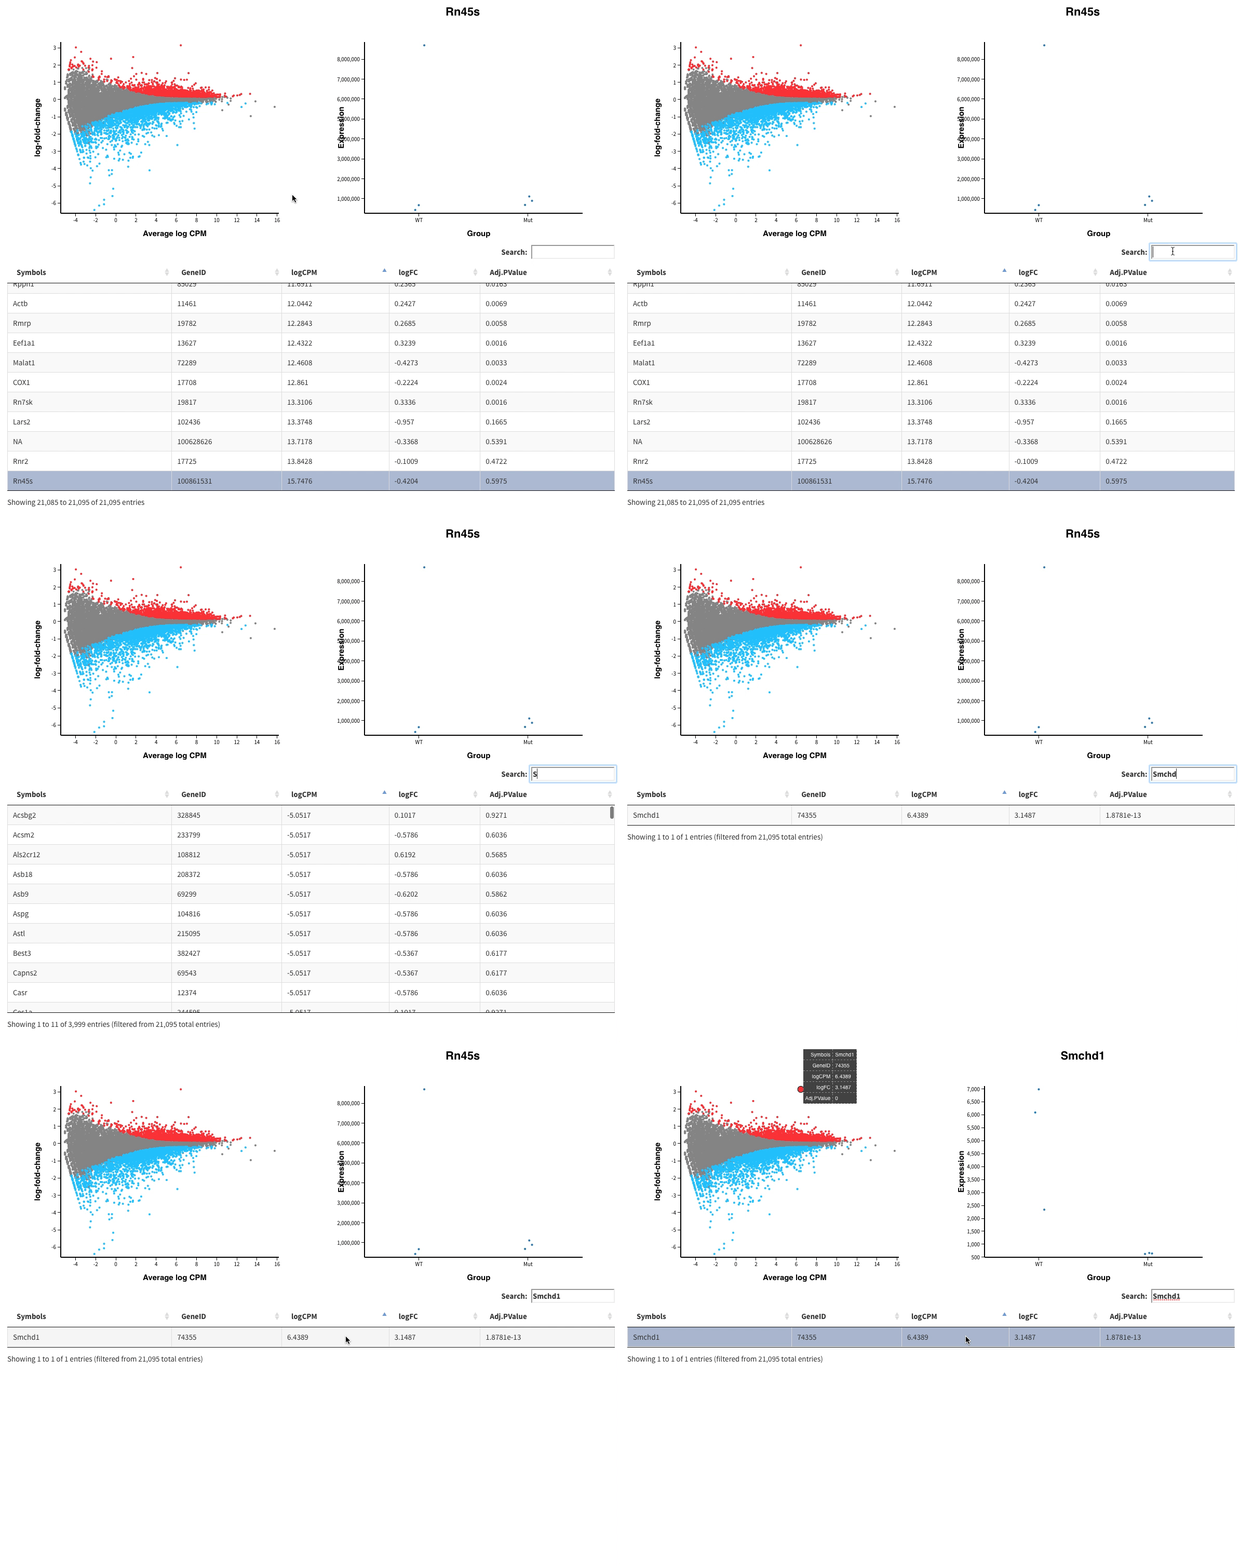
Clicking on table entries

table-click

glimma's People

Contributors

charitylaw avatar ivirshup avatar jdrnevich avatar mritchie avatar shians avatar

Stargazers

 avatar  avatar  avatar  avatar  avatar  avatar  avatar  avatar  avatar  avatar  avatar  avatar  avatar  avatar  avatar  avatar  avatar  avatar  avatar  avatar  avatar  avatar  avatar  avatar  avatar  avatar  avatar  avatar  avatar  avatar  avatar  avatar  avatar  avatar  avatar  avatar  avatar  avatar  avatar  avatar  avatar  avatar  avatar  avatar  avatar  avatar  avatar  avatar  avatar  avatar

Watchers

 avatar  avatar  avatar  avatar  avatar  avatar  avatar

glimma's Issues

top option does not change glMDSPlot results

First, the package is incredibly useful and very well documented. Thank you!

My issue is that the output from glMDSPlot does not change regardless of the value passed to option -top. I'm using Glimma version 1.4.0

Loaded rnaseq and groups exactly as in Figure 2 of the vignette

This recreates Figure 2 of the vignette as expected

glMDSPlot(rnaseq, groups=groups)

Each of these images is exactly the same as Figure 2.

glMDSplot(rnaseq,top=2,groups=groups)
glMDSPlot(rnaseq, top=5, groups=groups)
glMDSPlot(rnaseq, top=5000,groups=groups)

Similarly, gene.selection="common" does not seem to change the results

glMDSPlot(rnaseq, gene.selection = "common", groups=groups)

wrong assignment of ids to values in glMDPlot() HTML

Hi Glimma developers,

Maybe you can help,
When using glMDPlot based on the DEseq2 data, the right HTML panel (samples groups vs. FPM values) gives values that do not correspond to the selected gene of the MA plot on the left. Importantly, this problems happens only when the 'status' argument is added (the 1,-1,0 values that correspond to the FPM and the DE data, in the same order). Once the status argument is omitted, there are no apparent problems.

would be grateful your help,
Assaf

glMDSplot should invisibly return MDS values

I'd like to request glMDSplot to be able to return the MDS values for all samples/dimensions. Other plotting functions often do this "invisibly". It would be useful to have them to correlate with continuous covariates. Thanks!

Gridlines

Should add options for gridlines on x and y axis to get better sense of scale. Feature particularly requested for side plot in glMDPlot.

Implement shared counts data

Issue

Currently each MD plot carries its own instance of the counts matrix, this is very expensive when multiple contrasts each have their own MD plot.

Implementation details

  • Data is passed into HTML page via execution of .js file. Direct reading of local json is not allowed so a js is required to declare/inject the data.
  • Each HTML has its own .js file in order for them to share a folder without clobbering each other's data. The html name and its associated js filename is declared in the glMDPlot(html=) option.

Possible solution

  • Produce a single html that can be toggled between contrasts.
  • Produce a separate JS file for counts and remaining information, add argument in R to declare a shared count file.

Multiple colouring groups in MDS plot

MDS plot only colours by the levels of a single group, it would be useful to be able to use multiple different groups for colouring and be able to switch between them interactively.

Continuous scale for MDS colours

Feature proposal

Add continuous colouring options to MDS plot

Use case

  • Plotting intensity of expression of certain genes

Possible implementation

  • Recognise numeric argument on R side and pass information onto Javascript. See handling of numeric/categorical groups for MD expression plot's x axis for reference.

Final dimension in MDS plot produces broken graph

When clicking on the final dimension in the bar-plot on the MDS plots, a graph is plotted when it should not be, the (n+1)th dimension does not exist so plotting the n vs (n+1)th dimensions produces a non-sensical plot.

Reduce footprint of data.js / increase speed

Thanks for a great package!

When creating a MD plot for ~500 samples, across ~20000 geneids -- it takes about 1 min on my fully specced 2013 macbook pro. It also creates a js-file of >320mb, which makes the html to load slowly aswell.

I see in #70 that you opt to merge the anno argument to fit$genes. Is there a particular reason for this?

By supplying a minimal anno and doing fit$genes <- NULL it will reduce the js-file with about 60mb in my case. And the function runs ~10s faster.

Other suggestions for improving run speeds are most welcome!

y-axis for the MDplot

Hi @Shians

Thanks for making this useful package.

I found that for some of the genes, the logCPM plot (right hand side) of the MDplot doesn't show the values on the y-axis properly. Some problem related to visualization, since the numbers are either stuck to the top or the bottom.I can't figure out what. (examples attached)

1
2

extend plotting options

such as ability to connect points in per sample plot in glMDPlot, change point size or style (moving to plotly may solve this)

Issue when side.main column contains NA

Issue Description

When side.main column contains NA values glMDPlot encounters NA values in side.main column it will not place point on plot or be able to plot expression values.

User fix

Ensure that the side.main column does not contain NA and that all values are unique.

Developer fix

Add code to handle this. Potential fixes:

  • Add checking and return error when NA are detected.
  • Append sequence to NA such that it becomes NA.1, NA.2, etc...

glMDplot changes numeric columns with NAs to character in bottom table

When you have a numeric column in your annotation that has NA values, it somehow gets changed to character in the bottom table in a glMDPlot, so that sorting on it ends up with 1, 10, 100, 101, 102, etc. I couldn't find where this was occurring. Anyway to fix this so clicking on the table will sort properly as 1, 2, 3, etc?
Thanks!

Allow pre-normalized expression values instead of internally computing cpm on counts

I'd like to request the ability to pass the counts argument of glMDPlot a matrix of normalized expression values and turn off the internal computation of cpm values. This would broaden the package to any limma analysis, not just RNA-Seq data. Also, there are times when I'm removing a batch effect from my RNA-Seq data, and I'd like the expression values shown on the right side to also have the batch effect removed. I routinely do this for other visualizations, like heatmaps. Thanks!

Unable to set xlab argument using glMDPlot.MArrayLM()

Hi,

When using glMDPlot on a microarray data set, I seem to be unable to modify the labels on the left panel (since expression data is not logCPM). It works well without setting the xlab argument, but when I try to change this label, I get the following error:

Error in glMDPlot.hidden(plotting.data, sample.exp, display.columns, search.by, :
formal argument "xlab" matched by multiple actual arguments

I can provide data if needed.

Thanks,
JP

call (works if I exclude the xlab line) :
glMDPlot(fit.all_v2, status=res2, anno=fData(eset.norm), coef=1, display.columns = fvarLabels(eset.norm)[c(2,4,6,9,10)],
xlab='Average log2 intensity',
id.column = 'Probe_Id', folder=paste0('Glimma-',colnames(fit.all_v2)[1]), groups=pData(eset.norm)$Class,
counts=exprs(eset.norm), side.ylab = 'Normalized log intensity',
transform = FALSE, samples=sampleNames(eset.norm))

Table in glMDPlot not showing all columns

I just upgraded to the github Glimma version 1.5.1 and now I'm having an issue where the table at the bottom is not showing all the columns. I like to put in longer gene names / descriptions in the table, and the release version of Glimma (1.4.0) would make sure all columns were visible by fixing the widths of all columns and wrapping any longer entries on another line. Now, the column widths change depending on the genes in memory, stretching so all all long entries are on one line. This pushes other columns off to the right, and while there is a slider bar at the bottom, sliding only works on the values in the table and not the table headers, so I can't see nor sort on the missing columns. Plus, if I use the new version and put it in the same folder as a glMDPlot from the old version, it corrupts the old version as well! Screen shots below (hopefully).

I think I'll delete the github version and go back to the release version until this is fixed - the problem with improper rounding of p-values (issue #124) is less bothersome than this, But still an amazing package - thanks so much for it!!!

version 1.4.0, with fixed column sizes and text wrapping:
image

version 1.5.1, same genes shown; no text wrapping and adj.P.Val column not visible:
image

version 1.5.1, same as above but scrolled to the right. adj.P.Vals shown in table, but not column headers:
image

Easy way to adjust order of groups in top right plot of glMDPlot?

I have a factor group for my samples where the samples are not in the same order as the levels:

group
[1] s61 s61 s61 s63 s63 s63 SCR SCR SCR
Levels: SCR s61 s63

when I call glMDPlot:

glMDPlot(s61.vs.SCR.sv, counts = logCPM, groups = group, status = decideTests(s61.vs.SCR.sv))

the order of the groups in the top right plot of individual sample values seems to default to unique(group) . Could this be changed to levels(group) so that I could adjust the order by re-leveling instead of having to re-order both logCPM and group?

Thanks!

Suggestion for glMDSplot Documentation

Hi Shian,

Can the help pages for glMDSPlot.DGEList and glMDSPlot.default be merged into the one page. For a user, it seems that the only difference is in the definition of the x-argument. To get to these help pages, "?glMDSplot" takes me to the main page which doesn't tell me much about the function until I click onto glMDSPlot.DGEList or glMDSPlot.default. It would be more direct to bring up these (merged) help pages directly from "?glMDSplot".

I think by doing so, it may also help users when running "args(glMDSplot)". Currently, it doesn't tell me much about the arguments within the function. Ideally it'd serve as a reminder to what argument names are for labeling and groups, etc.

Thirdly, can you please add a legend to the groups and colors plotted?

Cheers,
Charity

Allow more groups on expressions plot

Feature proposal

Allow more groups to be displayed properly on expressions plot in MD plots

Use case

When more than 5 groups or groups with long names are used then the labels begin to overlap and become unreadable. This should be improved to allow more groups to be displayed.

Possible implementation

  • Rotate the labels 90 degrees
  • Smart rotation depending on text

Incorrect adj.P.Vals in table of glMDPlot

Check rounding of adjusted p-values (when using topTreat). Zero values appear at the top of the table for adjusted p-values, when they are not present using topTreat.

Clicking MD plot points doesn't always scroll to gene properly

Bug

  • When clicking on a gene on the MD plot, the table sometimes does not scroll such that the first highlighted entry is the clicked gene.
  • Sometimes the highlighted entry is not in the main view of the table at all.

Expectation

  • When clicking on a gene, the table scrolls such that the clicked gene is highlighted as the first entry on the table.

Reproduction

  • Unclear

Notes

  • Maybe the DataTable scroller assumes all rows are single line width and performs the wrong calculation.

Legend for MDS Plot

Proposed feature

Legend on MDS plot

Possible implementation

  • Add column to left/right of MD plot.
  • Grab colours and keys out of chart object.

glMDSPlot not doing gene.selection = "common" correctly

Whenever I try glMDSPlot(gene.selection = "common"), the resulting .html plot only has the first dimension bar visible in the Variance Explained plot, and the MDS plot looks nothing like the same plot from limma::plotMDS.

Additional colouring groups

Current behaviour is to use status vector with values {-1, 0, 1} and associated colours vector to define colours for points on glMDPlot, additional colouring options have been requested. Idea of input style:

status <- c("style1", "style1", ..., "style2", "style2", ..., "style3", ...)
status.values <- NULL # Default argument
sample.cols <- c("blue", "red", "green")

Values not specified in status.values should be treated as background and sorted to the back. Need to consider how status.values handles having levels(status) as a default.

Request legend for MDS plot

I'm starting to use the glMDSPlot more now, and one thing that would greatly improve it would be to add legends for each of the groups. As of now, I have to mouse over the points to see which color belongs to which group, but some times the group information isn't contained in the sample names. Maybe it could be added below rather than in the plot? Thanks!

Proposed MDS plot

  • Click on bars to select and deselect dimensions to display in MDS plot
  • Click on points in MDS plot to show sample label
  • Table below acts as summary to experimental design as well as Legend to MDS plot.
  • Switch colour grouping in MDS plot by selecting columns in Table.
  • What would you do with a large sample set? Display a reduced table? Allow columns to be sorted?
  • Main arguments are y (expression matrix) and targets (a dataframe of sample information), by default all columns in targets can be used to color points in MDS plot. An extra argument (call this "class" or "type"?) can be used to specify how the columns in targets should be treated, e.g. "type"=c("factor", "factor", "numeric", "none").

proposed_glimma_mds

Data.js is overwritten on by each glimma call

Each glimma call overwrites the data.js file, this causes earlier html files in the same folder to lose their data and end up sourcing from the later plot calls. The result is that html created by earlier plot calls end up creating plots from the latest html call.

Export table from glMDPlot

Feature proposal

Allow table on glMDPlot to be exported in some way.

Use case

The data from the glMDPlot can be extracted to be analysed in different ways.

Possible implementation

  • Process from the DOM into CSV.
  • Process from the data into CSV.
  • Process at R level as a table.

Issue with gene search

For volcano plots, search brings up the correct gene but counts do not show on the right after clicking on the gene in the table.

glXYPlot changing the count values from ExpressionSet object

Hi Shian,

Thanks for making an absolutely fantastic visualization tool!
I'm using glXYPlot function to visualize a volcano plot of all my expression data (microarray) and then trying to get a probe level plot on the side.

The main plot and table are ok, but the yaxis on my probe level plot is all wonky. The gene counts I am providing are already in log2 expression units and normalized, so I want them plotted as is. I tried the transform=F and side.log=F options and it doesn't fix it. Do you know what I might be doing wrong?

Thanks!

Update the data table with custom zoom

Hi There,

I was wondering if it is possible to update the data table if multiple points are selected on the plot and also if a customised zoomed set is being looked at.

Search on enter in MD plot from table search bar

When using the table option of the MD plot, the rows need to be physically clicked to execute a highlight action. It would be useful if the enter key could be pressed to execute the highlight action on the first row of the current table.

Allow insertion in .Rmd file

In your F1000 paper you say that you can put the results from running glMDplot() as a link in an Rmarkdown file, which is an option.

I think a better default behavior is to do what all of the RStudio htmlwidgets do - if you are interactive, it comes up in a browser, but if it is called non-interactively (usually within an Rmd file), it just dumps the required HTML code into the resulting HTML document.

You can save an htmlwidget to an external file, which I sometimes do, but for me at least, the more useful default is to have the results end up in the file I am generating with the Rmarkdown file.

Request and bug in P.Values in glMDPlot

I'd like to request that raw P.Values as well as adj.P.Vals are automatically output in the bottom table of glMDPlot(). I've been able to add raw P.Values by adding them in the anno argument, but when I did I noticed a bug because sorting by P.Value vs. adj.P.Vals did not give the same gene order. Looking further, it appears that p-values between 1e-05 and 5e-05 get rounded to 0, but p-values < 1e-05 get rounded to 5 significant digits (e-06 are shown as 0.0000010481 whereas < e-07 are shown as 9.8143e-7) while p-values > 5e-05 get rounded to 4 decimal places (0.0001). Probably anything > 1e-05 is getting rounded to 4 decimal places which is why those > 5e-05 get rounded to 0. Can this be fixed so they are all rounded to the same number of significant digits to maintain significance order?

Thanks!
Jenny

Remove pop-up box when selecting points

When selecting a point on the MDS plot or MD/XY plot (LHS) a pop-up box appears with the same information is shown in the table below. Often the box covers points in the rest of the plot. Can you remove the box?

argument to restrict clickable elements

For either the MD or volcano plots, it's not very performant with the number of genes on a modern microarray or RNA-Seq analysis. Part of this is because it's loading all the information for genes that are not significantly different, and by definition aren't of interest.

It would be nice to have the ability to be able to see all the data on the plot, but restrict the tool tips and mapping to the (x,y) plot to just those that are non-zero for the 'status' argument, in order to reduce the loading time for the plot.

Recommend Projects

  • React photo React

    A declarative, efficient, and flexible JavaScript library for building user interfaces.

  • Vue.js photo Vue.js

    ๐Ÿ–– Vue.js is a progressive, incrementally-adoptable JavaScript framework for building UI on the web.

  • Typescript photo Typescript

    TypeScript is a superset of JavaScript that compiles to clean JavaScript output.

  • TensorFlow photo TensorFlow

    An Open Source Machine Learning Framework for Everyone

  • Django photo Django

    The Web framework for perfectionists with deadlines.

  • D3 photo D3

    Bring data to life with SVG, Canvas and HTML. ๐Ÿ“Š๐Ÿ“ˆ๐ŸŽ‰

Recommend Topics

  • javascript

    JavaScript (JS) is a lightweight interpreted programming language with first-class functions.

  • web

    Some thing interesting about web. New door for the world.

  • server

    A server is a program made to process requests and deliver data to clients.

  • Machine learning

    Machine learning is a way of modeling and interpreting data that allows a piece of software to respond intelligently.

  • Game

    Some thing interesting about game, make everyone happy.

Recommend Org

  • Facebook photo Facebook

    We are working to build community through open source technology. NB: members must have two-factor auth.

  • Microsoft photo Microsoft

    Open source projects and samples from Microsoft.

  • Google photo Google

    Google โค๏ธ Open Source for everyone.

  • D3 photo D3

    Data-Driven Documents codes.