Giter Site home page Giter Site logo

abduallahmohamed / social-stgcnn Goto Github PK

View Code? Open in Web Editor NEW
471.0 13.0 140.0 5.88 MB

Code for "Social-STGCNN: A Social Spatio-Temporal Graph Convolutional Neural Network for Human Trajectory Prediction" CVPR 2020

License: MIT License

Python 97.08% Shell 2.92%
spatio-temporal-graphs pedestrians social-stgcnn human-trajectory-prediction pedestrian-trajectories graph-convolutional-networks gcnn graph-neural-networks realtime

social-stgcnn's Introduction

Social-STGCNN: A Social Spatio-Temporal Graph Convolutional Neural Network for Human Trajectory Prediction

Abduallah Mohamed, Kun Qian

Mohamed Elhoseiny** , Christian Claudel**

** Equal advising

Read full paper here, Presented at CVPR 2020

Check our latest work in motion prediction with new metrics (ECCV2022): Social-Implicit https://github.com/abduallahmohamed/Social-Implicit

Social-STGCNN


We propose the Social Spatio-Temporal Graph Convolutional Neural Network (Social-STGCNN), which models the problem of human trajectory prediction as a spatio-temporal graph. Our results show an improvement over the state of art by 20% on the Final Displacement Error (FDE) and an improvement on the Average Displacement Error (ADE) with 8.5 times less parameters and up to 48 times faster inference speed than previously reported methods. In addition, our model is data efficient, and exceeds previous state of the art on the ADE metric with only 20% of the training data. We propose a kernel function to embed the social interactions between pedestrians within the adjacency matrix.

Our model inference speed is 0.002s/frame (500Hz) using only 7.6K parameters.

Citaion

You can cite our paper using:

@inproceedings{mohamed2020social,
  title={Social-STGCNN: A Social Spatio-Temporal Graph Convolutional Neural Network for Human Trajectory Prediction},
  author={Mohamed, Abduallah and Qian, Kun and Elhoseiny, Mohamed and Claudel, Christian},
  booktitle={Proceedings of the IEEE/CVF Conference on Computer Vision and Pattern Recognition},
  pages={14424--14432},
  year={2020}
}

Model


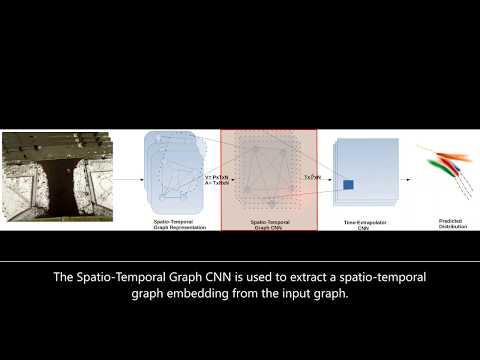
Social-STGCNN model consists of 2 building blocks:
1- ST-GCNN: A Spatio-Tempral Graph CNN that creates a spatio-temporal graph embedding representing the previous pedestrians trajectories.
2- TXP-CNN: A Time-Extrapolator CNN that utilizes the spatio-temporal graph embedding to predict future trajectories.

More details are in this description video:

Social-STGCNN description

Predictions sample


Setup:

The code was written using python 3.6. The following libraries are the minimal to run the code:

import pytorch
import networkx
import numpy
import tqdm

or you can have everything set up by running:

pip install -r requirements.txt

Using the code:

To use the pretrained models at checkpoint/ and evaluate the models performance run:

test.py

To train a model for each data set with the best configuration as in the paper, simply run:

./train.sh  

Please note: The initiation of training and testing might take a while as the code creates a cache to store the spatio-temporal graphs.
Exact CVPR version: https://github.com/abduallahmohamed/Social-STGCNN/tree/ebd57aaf34d84763825d05cf9d4eff738d8c96bb

Check our work in the 3D motion prediction (ICCV2021): https://github.com/abduallahmohamed/Skeleton-Graph

social-stgcnn's People

Contributors

abduallahmohamed avatar

Stargazers

 avatar  avatar  avatar  avatar  avatar  avatar  avatar  avatar  avatar  avatar  avatar  avatar  avatar  avatar  avatar  avatar  avatar  avatar  avatar  avatar  avatar  avatar  avatar  avatar  avatar  avatar  avatar  avatar  avatar  avatar  avatar  avatar  avatar  avatar  avatar  avatar  avatar  avatar  avatar  avatar  avatar  avatar  avatar  avatar  avatar  avatar  avatar  avatar  avatar  avatar  avatar  avatar  avatar  avatar  avatar  avatar  avatar  avatar  avatar  avatar  avatar  avatar  avatar  avatar  avatar  avatar  avatar  avatar  avatar  avatar  avatar  avatar  avatar  avatar  avatar  avatar  avatar  avatar  avatar  avatar  avatar  avatar  avatar  avatar  avatar  avatar  avatar  avatar  avatar  avatar  avatar  avatar  avatar  avatar  avatar  avatar  avatar  avatar  avatar  avatar

Watchers

 avatar  avatar  avatar  avatar  avatar  avatar  avatar  avatar  avatar  avatar  avatar  avatar  avatar

social-stgcnn's Issues

ETH Annotations Frequency

Hi,

Thanks for your great work, I would like to ask something regrading the annotations of a dataset (e.g, ETH).

In the file datasets/eth/test/biwi_eth.txt, the distance between frames is 10 (780, 790, ...). However, the original annotations in the eth dataset are sampled differently (780, 786, 792, ....). Am I missing something?

I downloaded the original ETH dataset from:
https://icu.ee.ethz.ch/research/datsets.html

Best,
Osama

Reproducing testing results

Hi,

Thanks for your nice work.
I have tried running the testing script to reproduce the results of your paper, but got different accuracies:

*************************************************
Number of samples: 20
**************************************************
Model being tested are: ['./checkpoint/social-stgcnn-zara2', './checkpoint/social-stgcnn-eth', './checkpoint/social-stgcnn-univ', './checkpoint/social-stgcnn-hotel', './checkpoint/social-stgcnn-zara1']
**************************************************
Evaluating model: ./checkpoint/social-stgcnn-zara2
Stats: {'min_val_epoch': 243, 'min_val_loss': -0.013492159500807345}
Processing Data .....
100%|█████████████████████████████████████████████████████████████████████████████████████████████████████████████████████████████████| 921/921 [01:04<00:00, 14.27it/s]
Testing ....
ADE: 0.30293984780425126  FDE: 0.4817296697245124
**************************************************
Evaluating model: ./checkpoint/social-stgcnn-eth
Stats: {'min_val_epoch': 248, 'min_val_loss': -0.015072189948775551}
Processing Data .....
100%|███████████████████████████████████████████████████████████████████████████████████████████████████████████████████████████████████| 70/70 [00:03<00:00, 22.81it/s]
Testing ....
ADE: 0.7279704030911243  FDE: 1.2104557624660832
**************************************************
Evaluating model: ./checkpoint/social-stgcnn-univ
Stats: {'min_val_epoch': 153, 'min_val_loss': -0.009756729709652235}
Processing Data .....
100%|█████████████████████████████████████████████████████████████████████████████████████████████████████████████████████████████████| 947/947 [08:32<00:00,  1.85it/s]
Testing ....
ADE: 0.4884496167238113  FDE: 0.9126036320113491
**************************************************
Evaluating model: ./checkpoint/social-stgcnn-hotel
Stats: {'min_val_epoch': 234, 'min_val_loss': -0.014858260246866567}
Processing Data .....
100%|█████████████████████████████████████████████████████████████████████████████████████████████████████████████████████████████████| 301/301 [00:14<00:00, 21.22it/s]
Testing ....
ADE: 0.4119438777295226  FDE: 0.6715785124718551
**************************************************
Evaluating model: ./checkpoint/social-stgcnn-zara1
Stats: {'min_val_epoch': 196, 'min_val_loss': -0.01428595929106405}
Processing Data .....
100%|█████████████████████████████████████████████████████████████████████████████████████████████████████████████████████████████████| 602/602 [00:29<00:00, 20.18it/s]
Testing ....
ADE: 0.3348892597563927  FDE: 0.5249404277146773
**************************************************
Avg ADE: 0.4532386010210204
Avg FDE: 0.7602616008776953

I have tried running the same script multiple times to see the effect of the generating different set of samples, but the results did not change much.

Why should we choose the normalized laplacian matrix?

Hi,

Could I ask a following question about why should we choose the normalized Laplacian matrix? (just like what have been mentioned in #22)

For the normalized Laplacian matrix nx.normalized_laplacian_matrix, the sum of the first row is equal to the sum of the first column (not guaranteed to be 0)? The example below is the same as the given example in #22 . Is there any benefit to using the normalized Laplacian matrix instead of the normalized adjacency matrix?

>>> import numpy as np
>>> import networkx as nx
>>> A = np.asarray([[0,5,9],[5,0,8],[9,8,0]])
>>> A_hat = A+np.eye(3)
>>> G = nx.from_numpy_matrix(A_hat)
>>> A_lapl = nx.normalized_laplacian_matrix(G).toarray()
>>> A_lapl
array([[ 0.93333333, -0.34503278, -0.54772256],
       [-0.34503278,  0.92857143, -0.50395263],
       [-0.54772256, -0.50395263,  0.94444444]])
>>> np.sum(A_lapl,axis=0)
array([ 0.040578  ,  0.07958602, -0.10723074])
>>> np.sum(A_lapl,axis=1)
array([ 0.040578  ,  0.07958602, -0.10723074])

In the original ST-GCN, it shows they used normalized adjacency matrix:
https://github.com/yysijie/st-gcn/blob/221c0e152054b8da593774c0d483e59befdb9061/net/utils/graph.py#L139
The function normalize_digraph is about column normalization. And the function normalize_undigraph is about the symmetric normalized matrix.

Really appreciate your help in advance!

Question about evaluation

Hi, thanks for your good work. I have a question regarding the evaluation. I notice that you follow the steps like:

  1. calculate the FDE and ADE 20 times for each pedestrian
  2. choose the min one
  3. calculate the average value
    image

However, the evaluation in social gan follows the way like:

  1. sum up the ADE and FDE scores for all pedestrians in a single scene
  2. repeat 20 times
  3. choose the min one.
  4. repeat the steps above and average the scores through all scenes.
    image

Do you think that these two different processes make the evaluation unfair? Please correct me if I misunderstand these two steps. I hope I can get your answer soon.

Data visualization

Congratulations, you have made a great contribution to trajectory prediction, I would like to ask if there is a code to output and visualize the predicted data?

About some code in test.py

In line 82 and 83 of test.py, why ues V_x[-1,:,:].copy() in line 83, but not use V_y?

V_y = seq_to_nodes(pred_traj_gt.data.cpu().numpy().copy())
V_y_rel_to_abs = nodes_rel_to_nodes_abs(V_tr.data.cpu().numpy().squeeze().copy(),
                                                 V_x[-1,:,:].copy())

normalized adjcency or laplacian matrix ?

A[s,:,:] = nx.normalized_laplacian_matrix(G).toarray()

Dear Authors

Thanks for your great work !

May I ask: above referred function (nx.normalized_laplacian_matrix) returns the normalized laplacian matrix, which is slightly away from normalized adjacency matrix. Is this your intention ?

For example, when I visualize A_obs from test-loader of eth dataset, array A_obs contains negative values, which is totally correct for normalized_laplacian_matrix.

Thanks for your time !

is the loss calculation wrong?

In train.py L187-L198, is the loss calculation wrong? loss is the mean value of a batch. The final printed result loss_batch is divided by batch_count, which should be divided by the number of gradient return.

loss = loss/args.batch_size
is_fst_loss = True
loss.backward()

if args.clip_grad is not None:
    torch.nn.utils.clip_grad_norm_(model.parameters(),args.clip_grad)


optimizer.step()
#Metrics
loss_batch += loss.item()
print('TRAIN:','\t Epoch:', epoch,'\t Loss:',loss_batch/batch_count)

And I have another question. In the training process, loss is negative, What kind of case is convergence?
Thank you for your reply.

the visualization of Social-STGCNN five datasets

Hello,
when I look into the five datasets(eth/hotel/univ/zara01/zara02) and visualization them with matplotlib, i found they are some kind of similar, as shown below. The five datasets have obvious smilar boundarys, and horizontal movement is more than vertical movement.
image

I had collected some data below to make a traj-prediction, but my dataset is extremely randomness,without such similarity like five datasets. ( I download these scenes from Youtube and do not have Homography matrix , so my dataset are only in frame coordinates ,not in real world coordinates.)
image (1)

So, Is there possible to use social-stgcnn in such randomness frame coordinates dataset with good effects? ( training with such dataset is not good, and the traj-inference effects is bad) Or is there any methods to deal with such randomness dataset before social-stgcnn training?

issues of visualize

Hello, I am very interested in your project. I would like to know how to visualize the experimental results.

Dynamic time window

Hello,
thanks for publishing the code.

I am interested in the use case where the number of people varies over time, in the time window considered, i.e. people can leave the scene. This changes the topology of the scene.

In the published code only trajectories with a certain length are considered and the rest is sorted out (seq_len=20). If the probable case occurs that a person leaves the scene, usually filler values can be entered for the position entries for the considered time window. I would like to know what would be the best strategy for the adjacency matrix. Should the kernel set a zero there?

reproduce the results

Hi,

I am wondering do you have any idea that the running environment will affect the results?

In last week I can train the model and obtain similar results. But in the weekend I installed something (to run another code), now my performance becomes much worse. I am using the same code but I can't reproduce my results in last week.

This is very wield. I am wondering have you encountered this kind of issue, and have any suggestions to solve it?

Best wishes,
Xingchen

Question about TXP-CNN

I have a question about the choose of CNN as time sequence predictor. The input of TXP-CNN is in the shape of (time length T x embedding length P x node number N), and treats the time dimension as feature channels. So the height and width of input map of CNN are P and N, correspondingly. Because CNN extracts image features in the receptive field, I don't understand what the physical meaning of information in the receptive field is under your setting. Are adjacent nodes related or adjacent values in embedding related ? Otherwise, what is the meaning of convolution? Will different sizes of convolution kernels have an impact?

Looking forward to your reply, thank you very much!

Vertices attribute is relative coordinates in the code

Hi @abduallahmohamed ,
I want to clarify one thing from the paper and code:

In paper page 3, sec 4.1 paragraph 2 it is mentioned that " the observed location (xit, yit) is the attribute of vit)"

In the code utils.py (seq_to_graph) you used step_rel[h], which is (xit-xi(t-1), yit-yi(t-1)).
https://github.com/abduallahmohamed/Social-STGCNN/blob/master/utils.py#L42

Could you please clarify if you have mentioned it in the paper.

Thanks,
Srikanth

Faster dataloader init by saving preprocessed

Hi @abduallahmohamed ,
Do you think saving the preprocessed data will be better instead of running the pre-processing everytime (which takes so much time to process).

import pickle as pkl

...

class TrajectoryDataset(Dataset):

def __init__(..):

    ....

    self.outfile = self.data_dir+"/processed.pkl"

    if not os.path.exists(self.outfile):

        ....

        # save the preprocessed variables

        out_data = {"seq_start_end": self.seq_start_end, "obs_traj": self.obs_traj, "obs_traj_rel": self.obs_traj_rel, "non_linear_ped": self.non_linear_ped, "v_obs": self.v_obs, "v_pred": self.v_pred, "num_seq": self.num_seq}

        pkl.dump(out_data, open(self.outfile,'wb'))

    else:

        data = pkl.load(open(self.outfile, 'rb'))

        self.seq_start_end = data["seq_start_end"]

        self.obs_traj = data["obs_traj"]

        self.obs_traj_rel = data["obs_traj_rel"]

        self.non_linear_ped = data["non_linear_ped"]

        self.v_obs = data["v_obs"]

        self.v_pred = data["v_pred"]

        self.num_seq = data["num_seq"]

How to implement on a custom video?

Thanks for your great work.

I want to ask how to implement this network on a custom video? Can you give some instructions on how to prepare my video and do prediction?

Thanks!

dataset

Hi, I am impressed by your great work. Regarding training, for each dataset, there are more than one data, does it mean you have used all data files (for example all files in eth/train) for your training?

Questions reagarding adjacency matrix and loss

Hi,

Interesting project, but I would like to ask a couple of questions regarding the adjacency matrix and loss calculation that are unclear to me.

Why does the adjacency matrix not have a batch dimension? I thought it was dependent on the nodes in a scene(?)

x = torch.einsum('nctv,tvw->nctw', (x, A))

Could you also explain the if else statement when computing the loss, I find it rather confusing.

if batch_count%args.batch_size !=0 and cnt != turn_point :

Cheers,

aktersnurra

It's unfair to compare the result with other methods!

#27
#14

As mentioned in above issues, the author even didn't know how the other methods calculate ADE and FDE, actually the calculations are different, but the author put all the results in one table to show the advance of Social-STGCNN.

I'm new to Human Trajectory Prediction, and I want to know the author's academic purpose.

Thanks!

Questions about the model

First of all, Thank you for your interesting work. But I have some question about some details within paper and codes.

  1. In your paper, you said the observed location (x; y) is the attribute of the node v, but in your code, you used seq_rel which means the relative position (delta_x,delta_y). Besides, you computed the adjacency matrix (A) by using the relative position, too. And then, I am confused about the meaning of your adjacency matrix (A).

  2. I am confused about the use of view() function in your code which is shown in the following picture. It seems you want to permute the dimensions of v, but why don't you use the function permute().
    image

Thanks.
And the function 'view()' will do things like the follow picture.
image
It shows the data that should be in the same dimension (eg: the temporal dimension) will cut and be placed in the different dimension.

[Question about the paper] Permutation effect ?

First of all, thank you for sharing your impressive work.

While I am reading your paper, I have some questions.

  1. How did you choose input sequence size as 8 frames and output size as 12 frames? These frame sizes showed the best performance?

  2. I wonder how the permutation did effect during training.
    These data orders showed the best performance? How did you decide the data order?

  3. Relative distance? How did you weigh the node influence if agents are far from each other?
    I think even though two agents are far from each other, if they move to the same goal from opposite position then I think they will get very high weight because of the relative location.
    I guess in this case they should get low weight because they are far away.

Thank you,

anorm problem about step_rel and step_

I have seen #15, but I still can't understand it. If people A and B don't move, both their step_rel=(0,0), use step_rel to calculate L2 distance means that A and B are closest? Because (0-0)^2+(0-0)^2=0 . I don't think the distance about velocity has a physical meaning .

My English is bad if you don't know what I ask, please let me know, thanks.

Calculation of Adjacency Matrix

Hi, thanks for your impressive work! I'm studying the implementation you released, and now there's just one issue confusing me which is related to the calculation of the adjacency matrix in utils.py.
As mentioned in your paper, an element of the adjacency matrix is calculated using the observed locations of two nodes:
image
However, in line 45 of utils.py, it's calculated using displacement (relative position) instead of absolute position:

l2_norm = anorm(step_rel[h],step_rel[k])

Could you please explain the reason for the operation? Look forward to your reply!

Questions about some details in paper and codes

Thank you for your interesting work. I have some question about some details within paper and codes.

  1. TCN
    It same that regular TCN is not introduced. In other words, it likes a mapping from input sequence to output sequence in temporal dimension, which achieved by torch.nn.Conv2d. Then, what's the meaning of the codes after that? Can you give some explanation?
n, kc, t, v = x.size()
x = x.view(n, self.kernel_size, kc//self.kernel_size, t, v)
x = torch.einsum('nkctv,kvw->nctw', (x, A))
  1. Sample
    Is Social-STGCNN a determinant model? How can it generate several different trajectories? (As shown in Figure 3, the distributions of multi-modal trajectories.)

Thanks lot for your nice work.

Unit and frame rate of data

Could you specify the unit (feet / meters) and frame rate of the processed data that is present in the datasets folder?

Question about the trajectory of three degrees of freedom

Hi, It is a great work. I am a new at this field, sorry to ask a little vague question:
Here is a scene about the trajectory of three degrees of freedom, and if I want to predict the trajectory in 3D coordinates, like (xt,yt,zt) for one person. Because I want to study the trajectory not only in the walking scene, but also some competition scene like football sports or diving, so the zt information is important for me, in another words, depth information is important for me during projection transformation.
What should I do to modify the code?
Hope your can reply at your convenience,
Your, Hu! @abduallahmohamed

batch size 1

Hi @abduallahmohamed ,
I wanted to ask you regarding the batch size. I observed that the batch is set to 1 in both training and testing. My understanding for that is because the number of pedestrians are dynamic, it's hard to get constant size tensor. But did you try padding all of them to make const size (along with having loss_mask, to ignore those predictions). Because I am curious if could improve performance along with speed (on bigger datasets).

Best,
Srikanth

Computing ADE/FDE when compared with other methods

This issue has been present in the past (#14 #27 #30), but I felt like it would be best to create another issue rather than commenting on closed ones.

I did some changes on the social GAN code, to compute the ADE and FDE metrics in the same way Social-STGCNN does (see this issue on sgan repo) - Picking the smallest error among all the samples per trajectory, instead of the overall smallest error for the entire scene/sequence.

I leave below a table comparing Social-STGCNN (results from the paper) with SGAN-P-20 (as in the paper), and also, a simpler baseline - a 'multimodal' constant velocity. I can explain it in more detail if you want, but basically the constant velocity model outputs 20 samples of trajectories with constant velocity, where for each sample the module of the velocity is weighted using a normal distribution based on the velocities of the observed trajectory.

Model ETH HOTEL UNIV ZARA1 ZARA2 AVG
Const vel 0.46 / 0.70 0.14 / 0.23 0.31 / 0.59 0.28 / 0.54 0.20 / 0.40 0.28 / 0.49
SGAN-P 0.59 / 0.92 0.34 / 0.66 0.33 / 0.60 0.23 / 0.42 0.22 / 0.39 0.34 / 0.60
Social-STGCNN 0.64 / 1.11 0.49 / 0.85 0.44 / 0.79 0.34 / 0.53 0.30 / 0.48 0.44 / 0.75

According to this, not only does SGAN-P outperform Social-STGCNN, but a multi-modal constant velocity seems to outperform both. This was also touched on another issue in sgan repository - originating from the paper What the Constant Velocity Model Can Teach Us About Pedestrian Motion Prediction (https://arxiv.org/abs/1903.079339). Although the multimodal constant velocity they employ is different than mine, it also outperforms Social GAN.

I'd like to get someone's opinion on this matter, because as of right now a multi modal version of constant velocity is achieving competite results with the state-of-the-art. This leads to many questions, many of which have been discussed, but I fear no consensus has been reached. I'll leave a few here:

  • Are the datasets in which these models are based representitive of the huge complexity of human motion and human interactions?
  • Are the models actually learning meaningful information about interactions between humans, or is it just "making things worse"?
  • Is this evaluation process enough to compare the different models? For instance some models and benchmarks have been using metrics that take into account collisions between pedestrians. I assume (or hope) that the social models will have better performance in such metrics than the constant velocity method, but I have not done enough experiments in that regard.

Thank you for reading this. Have a good day!

max_nodes =88

very interesting work I have a question about the seq_to_nodes function. why is max_nodes set to be 88? I was wondering how do you compute this number? Thanks

def seq_to_nodes(seq_,max_nodes = 88):
seq_ = seq_.squeeze()
seq_len = seq_.shape[2]

V = np.zeros((seq_len,max_nodes,2))
for s in range(seq_len):
    step_ = seq_[:,:,s]
    for h in range(len(step_)): 
        V[s,h,:] = step_[h]
        
return V.squeeze()

Visualization of the Gaussian predictions

On page 6 of your paper, figure 3, you show a very nice visualization of the predicted trajectory distribution for a few scenarios. Could you share your code on how you made this visualization?

About num_epochs?

Hello, thank you for your great work. : )

Why did you set the epoch size to 250? When I run it on my computer, I check that some overfitting has occurred, so I want to reduce this epoch size. I wonder if there is a problem with applying the Social STGCNN algorithm even if I reduce it.

How to evaluate in different setting?

I have trained a model with obs_len=12 and pred_len=24, how can I test this model under a different setting? For example, obs_len=8 and pred_len=12.

Questions about ADE and FDE

Hi,
I have read some issues about these, but I am also confused about the calculations of ADE and FDE in STGCNN.
In test.py, I find these codes:

for n in range(num_of_objs):
        ade_bigls.append(min(ade_ls[n]))
        fde_bigls.append(min(fde_ls[n]))

I can't figure out why STGCNN picks out the minimum of the results instead of average. I think average may be more convincing.
Thank you very much!

can't reproduce the test results using your models

Hi,

Thanks for your nice work.
I use the models in the checkpoint folder for testing, and run the test.py. But the accuracy is different from the accuracy shown in your paper. So I want to ask the reason.

`**************************************************
Number of samples: 20


Model being tested are: ['./checkpoint1/social-stgcnn-eth', './checkpoint1/social-stgcnn-hotel', './checkpoint1/social-stgcnn-univ', './checkpoint1/social-stgcnn-zara1', './checkpoint1/social-stgcnn-zara2']


Evaluating model: ./checkpoint1/social-stgcnn-eth
Stats: {'min_val_epoch': 248, 'min_val_loss': -0.015072189948775551}
Processing Data .....
100%|██████████| 70/70 [00:01<00:00, 43.19it/s]
Testing ....
ADE: 0.730797000639612 FDE: 1.2210648458100126


Evaluating model: ./checkpoint1/social-stgcnn-hotel
Stats: {'min_val_epoch': 234, 'min_val_loss': -0.014858260246866567}
Processing Data .....
100%|██████████| 301/301 [00:07<00:00, 38.47it/s]
Testing ....
ADE: 0.4129764052146676 FDE: 0.6802780812341801


Evaluating model: ./checkpoint1/social-stgcnn-univ
Stats: {'min_val_epoch': 153, 'min_val_loss': -0.009756729709652235}
0%| | 0/947 [00:00<?, ?it/s]Processing Data .....
100%|██████████| 947/947 [04:49<00:00, 3.27it/s]
Testing ....
ADE: 0.4877151096340023 FDE: 0.9114607573058071


Evaluating model: ./checkpoint1/social-stgcnn-zara1
Stats: {'min_val_epoch': 196, 'min_val_loss': -0.01428595929106405}
Processing Data .....
100%|██████████| 602/602 [00:17<00:00, 34.94it/s]
Testing ....
ADE: 0.33245151309488535 FDE: 0.5195364921152382


Evaluating model: ./checkpoint1/social-stgcnn-zara2
Stats: {'min_val_epoch': 243, 'min_val_loss': -0.013492159500807345}
Processing Data .....
100%|██████████| 921/921 [00:39<00:00, 23.45it/s]
Testing ....
ADE: 0.3028199381741592 FDE: 0.47966154597607014


Avg ADE: 0.45335199335146525
Avg FDE: 0.7624003444882617`

The ETH dataset's result is 0.73/1.22, while your paper is 0.64/1.11, so the ade is larger. The univ dataset's result is 0.48/0.91, while your paper is 0.44/0.79, so the fde is larger. The results of these two data sets are quite different from your original paper. Can you tell me the specific reasons?

Best,
Jincan

ValueError: The parameter covariance_matrix has invalid values

        sx = torch.exp(V_pred[:,:,2]) #sx
        sy = torch.exp(V_pred[:,:,3]) #sy
        corr = torch.tanh(V_pred[:,:,4]) #corr
        
        cov = torch.zeros(V_pred.shape[0],V_pred.shape[1],2,2).cuda()
        cov[:,:,0,0]= sx*sx
        cov[:,:,0,1]= corr*sx*sy
        cov[:,:,1,0]= corr*sx*sy
        cov[:,:,1,1]= sy*sy
        mean = V_pred[:,:,0:2]
        
        mvnormal = torchdist.MultivariateNormal(mean,cov)

What is the meaning of this code? This error occurs when I run the code on other data sets. Print the value and find the value of cov changed to INF. Exp must be used. torch.exp operation can be replaced with other ones. I sincerely hope you can give me some advice. Thank your for your help.

(Pdb) p cov[:, :, 0, 0]
tensor([[       inf,        inf,        inf,  ...,        inf,        inf,
         5.8854e-08],
        [5.2052e-12, 3.6343e+09, 5.3083e+10,  ..., 6.0116e+13, 4.4345e+26,
         1.6418e-18],
        [0.0000e+00, 1.7857e-13, 2.5362e-12,  ..., 1.8676e-09, 8.0149e+06,
         1.5469e-22],
        ...,
        [0.0000e+00, 2.1161e-21, 7.0877e-18,  ..., 6.8720e-15, 1.2533e+02,
         4.3264e-16],
        [0.0000e+00, 3.2086e-06, 4.9885e-03,  ..., 1.1735e+01, 1.8858e+19,
         4.8166e-15],
        [0.0000e+00, 2.3180e+02, 1.7170e+06,  ..., 1.6433e+09, 1.9954e+24,
         2.6417e-13]], device='cuda:0', grad_fn=<SelectBackward>)

@abduallahmohamed

About the result of test.py

Hi! Amazing work!
But when I run test.py with given checkpoints, the results of ADE and FDE seem much lower than those in the paper. So could you please explain that? Is there anything wrong with the steps? Thanks.

image

Test Accuracy varies

Thanks for sharing the code! It would be great if you could provide the random seed you used for the testing process. Since the sampling produces different samples, running test.py each time can get different results. And currently, I could not reach the results you reported in the paper.

Sampling frequency

Hello,

thanks for your work. Do you know how can I change the sampling frequency from 0.4 seconds to every frame?

Thanks in advance for help.

Question on the dataset

Hello author, I am new to trajectory prediction so I get an easy question... Are ETH and UCY dataset containing any images? I don't find any but notice that there is a background image in the main paper (i.e. in Figure 4). Where does it come from?

Question about the loss

In your paper, the loss is the sum of negative log-likehood of the position. But in the code, it is the sum of negative log-likehood of the relative position. I don't think they are the same because the prior position will influence the later position. Could you explain it for me? Thank you.

Recommend Projects

  • React photo React

    A declarative, efficient, and flexible JavaScript library for building user interfaces.

  • Vue.js photo Vue.js

    🖖 Vue.js is a progressive, incrementally-adoptable JavaScript framework for building UI on the web.

  • Typescript photo Typescript

    TypeScript is a superset of JavaScript that compiles to clean JavaScript output.

  • TensorFlow photo TensorFlow

    An Open Source Machine Learning Framework for Everyone

  • Django photo Django

    The Web framework for perfectionists with deadlines.

  • D3 photo D3

    Bring data to life with SVG, Canvas and HTML. 📊📈🎉

Recommend Topics

  • javascript

    JavaScript (JS) is a lightweight interpreted programming language with first-class functions.

  • web

    Some thing interesting about web. New door for the world.

  • server

    A server is a program made to process requests and deliver data to clients.

  • Machine learning

    Machine learning is a way of modeling and interpreting data that allows a piece of software to respond intelligently.

  • Game

    Some thing interesting about game, make everyone happy.

Recommend Org

  • Facebook photo Facebook

    We are working to build community through open source technology. NB: members must have two-factor auth.

  • Microsoft photo Microsoft

    Open source projects and samples from Microsoft.

  • Google photo Google

    Google ❤️ Open Source for everyone.

  • D3 photo D3

    Data-Driven Documents codes.