xinglab / rmats2sashimiplot Goto Github PK
View Code? Open in Web Editor NEWLicense: GNU General Public License v2.0
License: GNU General Public License v2.0


When program is run with no parameters (or with the help parameter), it should output a complete usage message to explain what the parameters are and print the current message as examples at the end.
I'm trying to run rmats2sashimiplot providing the coordinates of the region I'm interested in. I used the following commandline:
rmats2sashimiplot --b1 $B1 --b2 $B2
-c chrX:+:44873511:45112602:Homo_sapiens.GRCh38.84.clean.gff3
--l1 WT --l2 E4
--exon_s 1 --intron_s 5 -o test_coordinate_output
where $B1 and $B2 are variables containing the comma-delimited bam files. When I run the script I get the following error:
Indexing GFF...
[Note that for simplicity I replaced the initial part of all pathnames with "..."]. What am I doing wrong?
Thanks!
Hi!
Thank you for your wonderful tool to visualize RNAseq data. I have a question regarding filtering of junction reads - I am unable to plot junction reads, that I clearly see on a bam file (I am not using the min-junction parameter). The junctions are present in a patient sample as a consequence of a splicing variant, but not in a control sample. Could you help me visualize the junction?
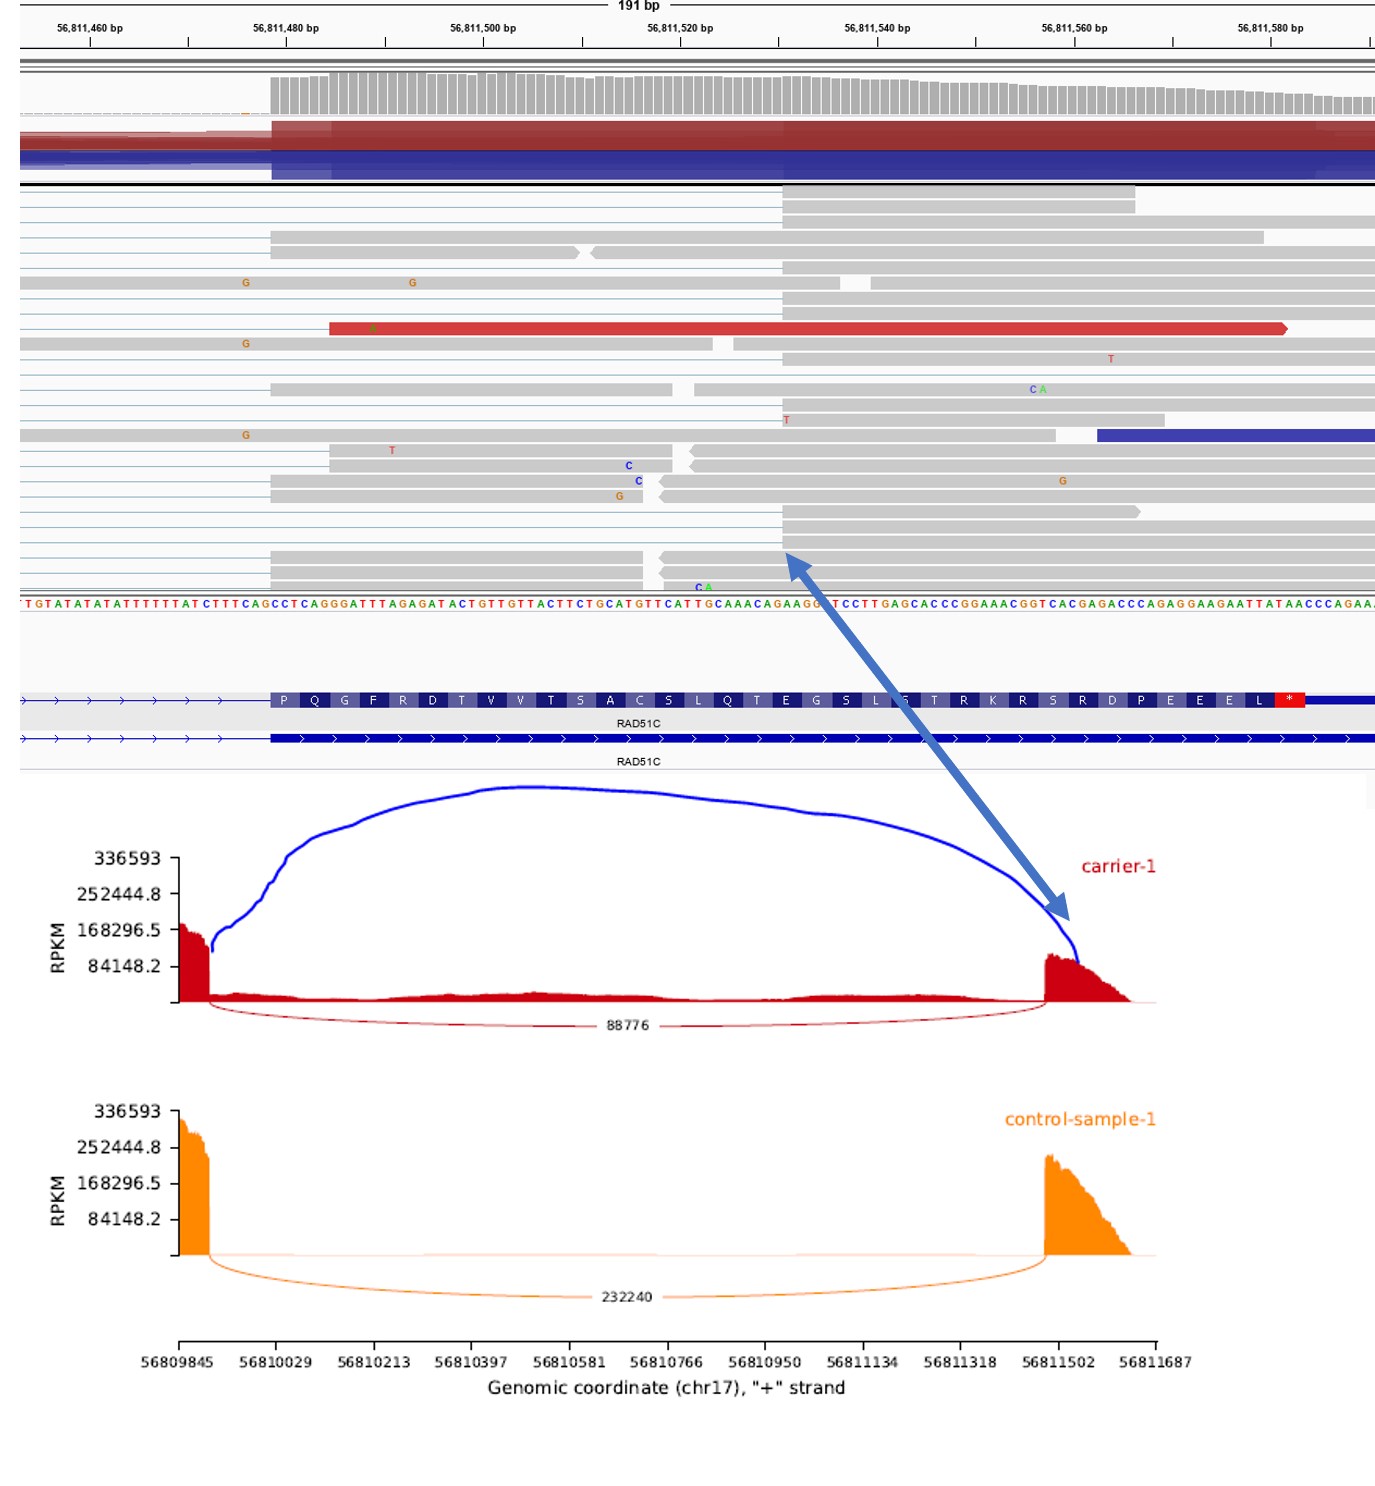
Thank you for your help!
Vita
Hi EricKutschera
when I run rmats-turbo to identified AS with one sample using parameter --statoff ;
and then I want to use rmats2sashimiplot to Visualization of AS events in one sample。 But rmats2sashimiplot only accept two samples such required parameters
--s1
--s2
--l1
--l2
if I omission some import information。
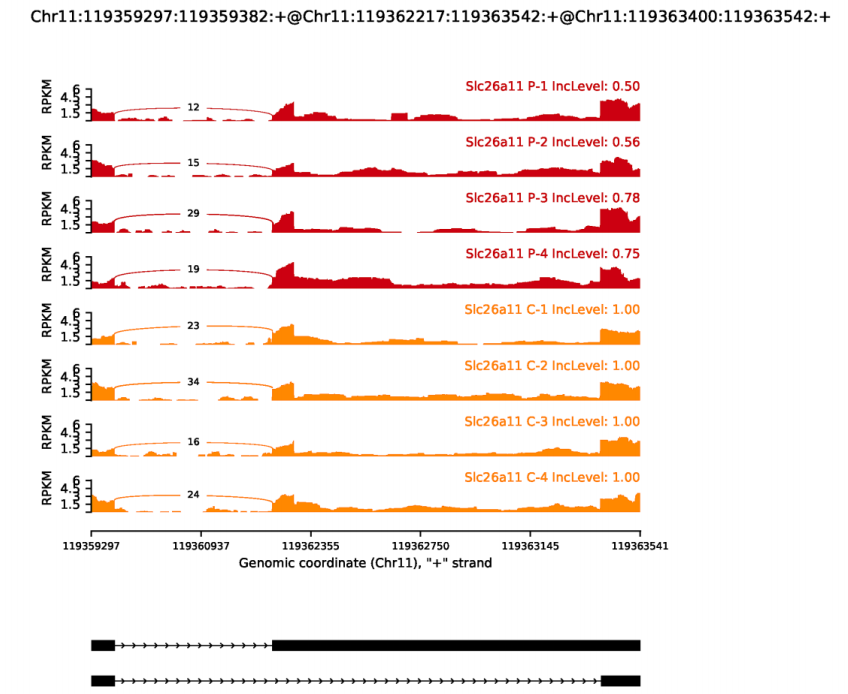
hello, rmats2sashimiplot is a wonderful tool. I've already got the result, but I'm confused about how to interpret the result, could you help with this.
for example:

in this skipped exon event, we have samples 1-3, which sample has the SE event? or which sample has the increased SE event? and what additional information we can see from the result?
appreciate your response.
my command is:
rmats2sashimiplot --b1 /orange/swanson/carter.h/ChP_Splicing_Project/Dmpk_KI_Mice/STAR_output/GSM4080197.Aligned.sortedByCoord.out.bam,/orange/swanson/carter.h/ChP_Splicing_Project/Dmpk_KI_Mice/STAR_output/GSM4080198.Aligned.sortedByCoord.out.bam,/orange/swanson/carter.h/ChP_Splicing_Project/Dmpk_KI_Mice/STAR_output/GSM4080199.Aligned.sortedByCoord.out.bam --b2 /orange/swanson/carter.h/ChP_Splicing_Project/Dmpk_KI_Mice/STAR_output/GSM4080203.Aligned.sortedByCoord.out.bam,/orange/swanson/carter.h/ChP_Splicing_Project/Dmpk_KI_Mice/STAR_output/GSM4080204.Aligned.sortedByCoord.out.bam,/orange/swanson/carter.h/ChP_Splicing_Project/Dmpk_KI_Mice/STAR_output/GSM4080205.Aligned.sortedByCoord.out.bam -t A3SS -c chr3:+:60472830:60629750:/orange/swanson/carter.h/genomes/mouse/ensembl/Mus_musculus.GRCm38.100.gff3 -e /orange/swanson/carter.h/ChP_Splicing_Project/Dmpk_KI_Mice/fastq_files/GSM4080197-99_203-205/fromGTF.novelSpliceSite.A3SS.txt --l1 wt --l2 480/480 -o /orange/swanson/carter.h/ChP_Splicing_Project/Dmpk_KI_Mice/fastq_files/GSM4080197-202
stdout:
Indexing '/orange/swanson/carter.h/ChP_Splicing_Project/Dmpk_KI_Mice/STAR_output/GSM4080197.Aligned.sortedByCoord.out.bam'.
samtools: error while loading shared libraries: libcrypto.so.1.0.0: cannot open shared object file: No such file or directory
Indexing '/orange/swanson/carter.h/ChP_Splicing_Project/Dmpk_KI_Mice/STAR_output/GSM4080198.Aligned.sortedByCoord.out.bam'.
samtools: error while loading shared libraries: libcrypto.so.1.0.0: cannot open shared object file: No such file or directory
Indexing '/orange/swanson/carter.h/ChP_Splicing_Project/Dmpk_KI_Mice/STAR_output/GSM4080199.Aligned.sortedByCoord.out.bam'.
samtools: error while loading shared libraries: libcrypto.so.1.0.0: cannot open shared object file: No such file or directory
Indexing '/orange/swanson/carter.h/ChP_Splicing_Project/Dmpk_KI_Mice/STAR_output/GSM4080203.Aligned.sortedByCoord.out.bam'.
samtools: error while loading shared libraries: libcrypto.so.1.0.0: cannot open shared object file: No such file or directory
Indexing '/orange/swanson/carter.h/ChP_Splicing_Project/Dmpk_KI_Mice/STAR_output/GSM4080204.Aligned.sortedByCoord.out.bam'.
samtools: error while loading shared libraries: libcrypto.so.1.0.0: cannot open shared object file: No such file or directory
Indexing '/orange/swanson/carter.h/ChP_Splicing_Project/Dmpk_KI_Mice/STAR_output/GSM4080205.Aligned.sortedByCoord.out.bam'.
samtools: error while loading shared libraries: libcrypto.so.1.0.0: cannot open shared object file: No such file or directory

A3SS: ['5902', '"ENSMUSG00000059326"', '"Csf2ra"', 'chr19', '-', '61225132', '61225214', '61225132', '61225176', '61225323', '61225490\n']
Traceback (most recent call last):
  File "/apps/rmats2sashimiplot/2.0.3/bin/rmats2sashimiplot", line 10, in <module>
    sys.exit(main())
  File "/apps/rmats2sashimiplot/2.0.3/lib/python2.7/site-packages/rmats2sashimiplot/rmats2sashimiplot.py", line 785, in main
    plot_with_eventsfile(options)
  File "/apps/rmats2sashimiplot/2.0.3/lib/python2.7/site-packages/rmats2sashimiplot/rmats2sashimiplot.py", line 503, in plot_with_eventsfile
    coor = EventCoor(options.event_type, items)
  File "/apps/rmats2sashimiplot/2.0.3/lib/python2.7/site-packages/rmats2sashimiplot/rmats2sashimiplot.py", line 431, in __init__
    self.inc_level1 = items[20]  # IncLevel1
IndexError: list index out of range
hi rmats team, @ShiehShieh @bahramis
Thank you for developing this tool.
I see this error when I try to plot using only co ordinate and gff3 file.
"list index out of range
There is an exception in plot_with_coordinate"
Thanks
Frank.
Hello - I tried installing rmats2sashimiplot via bioconda and just by pip install as well. For some reason pysam import seems to fail (I think). I am pasting the output example below.
"<module 'misopy' from '/opt/miniconda2/lib/python2.7/site-packages/rmats2sashimiplot-2.0.2-py2.7.egg/MISO/misopy/__init__.pyc'> Indexing GFF... /Users/a/Documents/3620sashimi/se60x_sashimiplot_SE/Sashimi_index_ZNF664_1/tmp.gff3 appears to already be indexed. Aborting. python /opt/miniconda2/lib/python2.7/site-packages/rmats2sashimiplot-2.0.2-py2.7.egg/MISO/misopy/sashimi_plot/sashimi_plot.py --plot-event "chr12:123988046:123988138:+@chr12:123989309:123989442:+@chr12:124011381:124011441:+" /Users/a/Documents/3620sashimi/se60x_sashimiplot_SE/Sashimi_index_ZNF664_1 /Users/a/Documents/3620sashimi/se60x_sashimiplot_SE/Sashimi_index_ZNF664_1/sashimi_plot_settings.txt --output-dir /Users/a/Documents/3620sashimi/se60x_sashimiplot_SE/Sashimi_plot Traceback (most recent call last): File "/opt/miniconda2/lib/python2.7/site-packages/rmats2sashimiplot-2.0.2-py2.7.egg/MISO/misopy/sashimi_plot/sashimi_plot.py", line 23, in <module> import pysam File "/opt/miniconda2/lib/python2.7/site-packages/pysam/__init__.py", line 4, in <module> from pysam.libchtslib import * ImportError: dlopen(/opt/miniconda2/lib/python2.7/site-packages/pysam/libchtslib.so, 2): Library not loaded: @rpath/libcrypto.1.0.0.dylib Referenced from: /opt/miniconda2/lib/python2.7/site-packages/pysam/libchtslib.so Reason: image not found mv: rename /Users/a/Documents/3620sashimi/se60x_sashimiplot_SE/Sashimi_plot/chr12:123988046:123988138:+@chr12:123989309:123989442:+@chr12:124011381:124011441:+.pdf to /Users/a/Documents/3620sashimi/se60x_sashimiplot_SE/Sashimi_plot/1_ZNF664_chr12_123988046_123988138_+@chr12_123989309_123989442_+@chr12_124011381_124011441_+.pdf: No such file or directory"
Hello,
I succeeded into getting rMATs output, which was great actually. Now I am trying to use rmats2sashimiplot to plot the genes in my rMATs output. As Miso had issues running on python 3.8 which caused rmats2sashimiplot to fail when I used it from the command line, I created a conda env with python 2.7 to include Miso and rmats2sashimiplot. I used the same script provided in the manual:
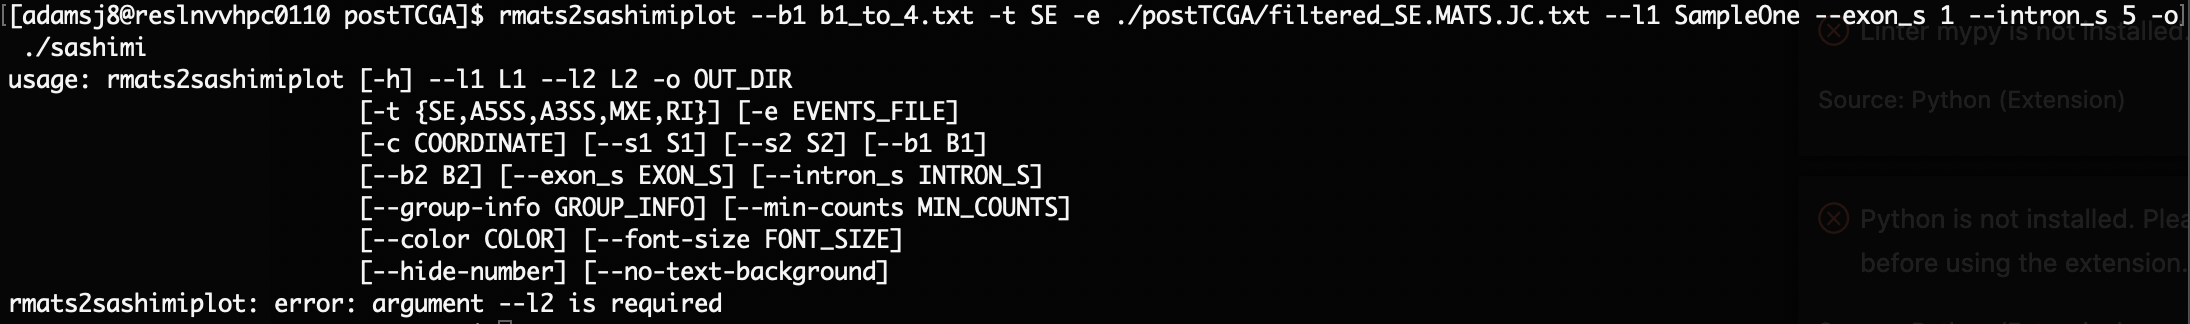
rmats2sashimiplot --b1 {group1 bam files} --b2 {group 2 bam files} --t SE --e ./SE.MATS.JCEC.txt --l1 grp1 --l2 grp2 --exon_s 1 --intron_s 5 --o SE_grouped_output --group-info SE.gf
But I got this error: rmats2sashimiplot: error: argument --exon_s: invalid int value: './SE.MATS.JC.txt'
I am not sure what's the issue here
Thanks
I run the following command:
/path/rmats2sashimiplot/src/rmats2sashimiplot/rmats2sashimiplot.py --b1 bam,bam,bam --b2 bam,bam,bam -t SE -e /path/rMATS_output/SE.MATS.JCEC.txt --l1 WT --l2 480/480 -o /path/significant_SE_wtvs480480_grouped_sashimi_plots --group-info /path/wt_vs_480480_groups.gf --color #808080,#000000 --no-text-background
I get this result:
import: unable to open X server `' @ error/import.c/ImportImageCommand/369.
import: unable to open X server `' @ error/import.c/ImportImageCommand/369.
import: unable to open X server `' @ error/import.c/ImportImageCommand/369.
import: unable to open X server `' @ error/import.c/ImportImageCommand/369.
/path/rmats2sashimiplot/src/rmats2sashimiplot/rmats2sashimiplot.py: line 9: syntax error near unexpected token `('
/path/rmats2sashimiplot/src/rmats2sashimiplot/rmats2sashimiplot.py: line 9: `def convert_sam2bam(options):'
This happens whether or not I've run 2to3.sh
Dear all,
I am trying to use data with rmats2sashimiplot that it was analyzed through a stardard pipeline with Ensembl annotation:
STAR aligner with Homo_sapiens.GRCh38.dna.primary_assembly.fa and Homo_sapiens.GRCh38.90.gtf
from Ensembl, so:
> head Homo_sapiens.GRCh38.90.gtf
#!genome-build GRCh38.p10
#!genome-version GRCh38
#!genome-date 2013-12
#!genome-build-accession NCBI:GCA_000001405.25
#!genebuild-last-updated 2017-06
1 havana gene 11869 14409 . + . gene_id "ENSG00000223972"; gene_version "5"; gene_name "DDX11L1"; gene_source "havana"; gene_biotype "transcribed_unprocessed_pseudogene";
1 havana transcript 11869 14409 . + . gene_id "ENSG00000223972"; gene_version "5"; transcript_id "E .. etcs
then standard rMats analysis with the same GTF that produce the output files (SE.MATS.JCEC.txt etc...)
>head SE.MATS.JCEC.txt
ID GeneID geneSymbol chr strand exonStart_0base exonEnd upstreamES upstreamEE downstreamES downstreamEE ID IJC_SAMPLE_1 SJC_SAMPLE_1 IJC_SAMPLE_2 SJC_SAMPLE_2 IncFormLen SkipFormLen PValue FDR IncLevel1 IncLevel2 IncLevelDifference
0 "ENSG00000160310" "PRMT2" **chr21** + 46636438 46636547 46635166 46635763 46636895 46636990 0 37,68,54,171 74,33,26,6 21,25 15,14 183 74 0.284535011242 1.0 0.168,0.455,0.456,0.92 0.361,0.419 0.11.
As you can see from the rMats output file the chromosome position is expressed as chrXX ant not just XX.
In fact when I run rmats2sashimiplot, an error occur:
Are you sure chrXX appears in your BAM file
So I changed the output of rMATS removing the 'chr'. After that rmats2sashimiplot complains with
invalid literal for int() with base 10: '' There is an exception in plot_with_eventsfile
my command was
rmats2sashimiplot --b1 T1.bam --b2 T2t.bam -t SE -e SE.MATS.JCEC.txt --l1 Tumor --l2 normal -o sashimiplots
any help, please
thank you all
Silvano
-`
Hi, I'm trying to run the pipeline on the test data, but I get the following error message:
...
File "src/rmats2sashimiplot/rmats2sashimiplot.py", line 186
" which could lead to unexpected output.".format(id_str), file=sys.stderr)
^
SyntaxError: invalid syntax
...
My input code is:
...
python src/rmats2sashimiplot/rmats2sashimiplot.py --b1 rmats2sashimiplot_test_data/sample_1_replicate_1.bam,rmats2sashimiplot_test_data/sample_1_replicate_2.bam,rmats2sashimiplot_test_data/sample_1_replicate_3.bam
--b2 rmats2sashimiplot_test_data/sample_2_replicate_1.bam,rmats2sashimiplot_test_data/sample_2_replicate_2.bam,rmats2sashimiplot_test_data/sample_2_replicate_3.bam
-c chr16:+:9000:25000:rmats2sashimiplot_test_data/annotation.gff3
--l1 samp2
--l2 samp1
--exon_s 1
--intron_s 5
-o sashi_test
...
I then tried to install it using 'python ./setup.py install', and half way down the output I get a similar error:
....
byte-compiling build/bdist.linux-x86_64/egg/MISO/misopy/pe_utils.py to pe_utils.pyc
byte-compiling build/bdist.linux-x86_64/egg/MISO/misopy/json_utils.py to json_utils.pyc
byte-compiling build/bdist.linux-x86_64/egg/MISO/misopy/cluster_utils.py to cluster_utils.pyc
byte-compiling build/bdist.linux-x86_64/egg/MISO/misopy/miso.py to miso.pyc
byte-compiling build/bdist.linux-x86_64/egg/MISO/misopy/gff_utils.py to gff_utils.pyc
File "build/bdist.linux-x86_64/egg/MISO/misopy/gff_utils.py", line 304
print("Outputting sliced GFF records to: %s" %(filename), file=sys.stderr)
^
SyntaxError: invalid syntax
...
Any help would be much appreciated!
cannot download testdata from
http://www.mimg.ucla.edu/faculty/xing/rmats2sashimiplot/testData.tar
Hello!
I downloaded rmats2sashimiplot using git clone https://github.com/Xinglab/rmats2sashimiplot.git
When I try :
mr@R4:~/rmats2sashimiplot$ python setup.py install
Traceback (most recent call last):
File "setup.py", line 24, in
from setuptools import setup, find_packages
ImportError: No module named setuptools
I'm running Ubuntu 19.0 on VMWare.
Python 2.7.17 (default, Nov 7 2019, 10:07:09)
[GCC 9.2.1 20191008] on linux2
Can someone please help me with this?
Thanks!
Hello,
I'm trying to use rmats2sashimi with the example
but I have this message:
default:rmats2sashimiplot userl$ rmats2sashimiplot -b1 ./testData/S1.R1.test.bam,./testData/S1.R2.test.bam,./testData/S1.R3.test.bam -b2 ./testData/S2.R1.test.bam,./testData/S2.R2.test.bam,./testData/S2.R3.test.bam -c chr2:+:10090000:10110000:./testData/ensGene.gff3 -l1 PC3E -l2 GS689 -exon_s 1 -intron_s 5 -o test_coordinate_output
sh: index_gff: command not found
sh: sashimi_plot: command not found
any help would be greatly appreciated.
thanks.
Hello,
When I run rmats2sashimiplot, it had this probem as follows, how can I settle this problem?
x = [graphcoords[s], graphcoords[e], graphcoords[e], graphcoords[s]]
IndexError: index 5341 is out of bounds for axis 0 with size 5126
Thank you!
If you find your sashimiplot can't run , you may check the Error as well as to find out which packages you haven't installed.
If you find your sashimiplot can run , but can not get the plot . You may check your rmats-result . In the chr colon , try to replace the chr to blank. Because in the bam file, there is no chr label on chromosome.
Try to run again , you will get your plot .
Good luck.
Hi and Merry Christmas!
I faced a problem with rmats2sashimi plot. When trying to make a plot using the -c option, the following error appears. However, it appears on some, but not all coordinates, using the same command with different coordinates can produce a plot.
Command (filenames omitted):
python2 /home/ashumskiy/Programs/rmats2sashimiplot/build/lib/rmats2sashimiplot/rmats2sashimiplot.py --b1 files --b2 files -c chr7:+:28815279:28818532:/home/ashumskiy/Mus_musculus.GRCm38.100.gtf --l1 WTND --l2 KOND --exon_s 1 --intron_s 5 -o /home/ashumskiy/SIRT6/rMATS/output_dima/sashimi/test_output
Here is the error:
Traceback (most recent call last):
File "/home/ashumskiy/Programs/rmats2sashimiplot/build/lib/MISO/misopy/sashimi_plot/sashim i_plot.py", line 293, in
main()
File "/home/ashumskiy/Programs/rmats2sashimiplot/build/lib/MISO/misopy/sashimi_plot/sashim i_plot.py", line 289, in main
plot_label=plot_label)
File "/home/ashumskiy/Programs/rmats2sashimiplot/build/lib/MISO/misopy/sashimi_plot/sashim i_plot.py", line 160, in plot_event
plot_label=plot_label)
File "/home/ashumskiy/Programs/rmats2sashimiplot/build/lib/MISO/misopy/sashimi_plot/plot_u tils/plot_gene.py", line 838, in plot_density_from_file
plot_title=plot_title)
File "/home/ashumskiy/Programs/rmats2sashimiplot/build/lib/MISO/misopy/sashimi_plot/plot_u tils/plot_gene.py", line 495, in plot_density
plot_mRNAs(tx_start, mRNAs, strand, graphcoords, reverse_minus)
File "/home/ashumskiy/Programs/rmats2sashimiplot/build/lib/MISO/misopy/sashimi_plot/plot_u tils/plot_gene.py", line 643, in plot_mRNAs
x = [graphcoords[s], graphcoords[e], graphcoords[e], graphcoords[s]]
IndexError: index out of bounds
Hi,
I'm confused about some results of rmats2sashimiplot. Some sashimiplot plots of SE events, which were found by rMATS, look like A3SS or A5SS but not SE event. For example the scrrenshot, I don't find skipping in it
I run the following command:
/path/rmats2sashimiplot/src/rmats2sashimiplot/rmats2sashimiplot.py --b1 bam,bam,bam --b2 bam,bam,bam -t SE -e /path/rMATS_output/SE.MATS.JCEC.txt --l1 WT --l2 480/480 -o /path/significant_SE_wtvs480480_grouped_sashimi_plots --group-info /path/wt_vs_480480_groups.gf --color #808080,#000000 --no-text-background
For every single gene, I get this warning:
Warning: The inclusion levels of Event '7:138845957:138846273:-@7:138840577:138840934:-@7:138835823:138837030:-' contains 'NA' value, which could lead to unexpected output.
This is reflected in the plots, which say for example "Sorbs1 WT IncLevel: nan"
I know my rMATS file has no NA values in it.
Hello, I was very excited to try out rmats2sashimiplot but when I tried to run it on my own data and with the test data, I get the same warning and no Sashimi_plot directory.
My command and the error is (I am running it in the same directory as the bam and gff3 files):
rmats2sashimiplot --b1 S1.R1.test.bam,S1.R2.test.bam,S1.R3.test.bam --b2 S2.R1.test.bam,S2.R2.test.bam,S2.R3.test.bam -c chr2:+:10090000:10110000:ensGene.gff3 --l1 PC3E --l2 GS689 --exon_s 1 --intron_s 5 -o test_coordinate_output
local variable 'warning_flag' referenced before assignment
There is an exception in preparing coordinate setting file
ls test_coordinate_output/
Sashimi_index
jamesl@atomic:/data/jamesl/NMD/AS_NMD_SFs/SRSF126_KD_CHX/rmats2sashimiplot/testData$ ls test_coordinate_output/Sashimi_index/
sashimi_plot_settings.txt SE.event.list.txt tmp.gff3
I am not sure where the problem is coming from or why. I get the same problem when I run it on my (sorted) own bam files. I am running it on python2.7 with a Ubuntu 12.04 OS and I have /lab/64/app/samtools/samtools-0.1.16/ in my PATH variable. Could my samtools be an old version?
Many thanks,
James
ran python sashimi_plot.py --plot-event and got this error
Hello rMATS Team,
I am enjoying rmats2sashimiplot very much. I have a feature request for the program. It is very convenient that you have provided a means to generate the sashimi plot using coordinate mode by providing a genomic region and gff3 file. However, the PSI value for each sample in the plot is not displayed in the plot.
Since the junction reads are provided would it be possible to calculate PSI from these reads to display them in the title for each sample similar to the rMATS events output method?
I have tried to do this myself but I cannot find the file that contains the junction information used to print the junction reads on the plot. Is it is temporary file that is deleted or am I simply overlooking the location of the file?
Thanks for your help!
Sincerely,
Sam
Program failed to generate gff in the Sashimi_index when all coordinates are right.
rmats2sashimiplot --b1 $bam/PC3E-1/PC3E-1Aligned.sort.bam,$bam/PC3E-2/PC3E-2Aligned.sort.bam,$bam/PC3E-3/PC3E-3Aligned.sort.bam --b2 $bam/GS689.LI-1/GS689.LI-1Aligned.sort.bam,$bam/GS689.LI-2/GS689.LI-2Aligned.sort.bam,$bam/GS689.LI-3/GS689.LI-3Aligned.sort.bam --l1 PC3E --l2 GS689 -c sed -n ${SGE_TASK_ID}p $coord:$gff --group-info $group -o $outputsed -n ${SGE_TASK_ID}p $gene/ --min-counts 0 > ot.log
/mnt/isilon/xing_lab/shens/bin/anaconda2/envs/turbo/lib/python2.7/site-packages/matplotlib/cbook/deprecation.py:107: MatplotlibDeprecationWarning: The mpl_toolkits.axes_grid module was deprecated in version 2.1. Use mpl_toolkits.axes_grid1 and mpl_toolkits.axisartist provies the same functionality instead.
warnings.warn(message, mplDeprecation, stacklevel=1)
Traceback (most recent call last):
File "/mnt/isilon/xing_lab/shens/bin/anaconda2/envs/turbo/lib/python2.7/site-packages/rmats2sashimiplot-2.0.2-py2.7.egg/MISO/misopy/sashimi_plot/sashimi_plot.py", line 293, in
main()
File "/mnt/isilon/xing_lab/shens/bin/anaconda2/envs/turbo/lib/python2.7/site-packages/rmats2sashimiplot-2.0.2-py2.7.egg/MISO/misopy/sashimi_plot/sashimi_plot.py", line 289, in main
plot_label=plot_label)
File "/mnt/isilon/xing_lab/shens/bin/anaconda2/envs/turbo/lib/python2.7/site-packages/rmats2sashimiplot-2.0.2-py2.7.egg/MISO/misopy/sashimi_plot/sashimi_plot.py", line 148, in plot_event
%(event_name, pickle_dir)
Exception: Event chr14:74254063:74269974:+ not found in pickled directory /mnt/isilon/xing_lab/shens/ISO_ReRun/rMATS-iso-bak/Real_PC3E_Results/output_test/ASM5822_RP5-1021I20.1_ENSG00000259065/Sashimi_index. Are you sure this is the right directory for the event?
mv: cannot stat ‘/mnt/isilon/xing_lab/shens/ISO_ReRun/rMATS-iso-bak/Real_PC3E_Results/output_test/ASM5822_RP5-1021I20.1_ENSG00000259065/Sashimi_plot/chr14:74254063:74269974:+.pdf’: No such file or directory
<module 'misopy' from '/mnt/isilon/xing_lab/shens/bin/anaconda2/envs/turbo/lib/python2.7/site-packages/rmats2sashimiplot-2.0.2-py2.7.egg/MISO/misopy/init.pyc'>
Indexing GFF...
The rMATS output that creates the error is:
ID GeneID geneSymbol chr strand exonStart_0base exonEnd upstreamES upstreamEE downstreamES downstreamEE ID IJC_SAMPLE_1 SJC_SAMPLE_1 IJC_SAMPLE_2 SJC_SAMPLE_2 IncFormLen SkipFormLen PValue FDR IncLevel1 IncLevel2 IncLevelDifference
48181 "ENSG00000213468" "RP11-453F18__B.1" chrX - 130929836 130930359 130928351 130928494 130938999 130939065 48181 35,55,21 3,5,5 62,78,61 2,2,1 672 149 0.00109497010323 0.0251135565548 0.721,0.709,0.482 0.873,0.896,0.931 -0.263
The error is:
'NoneType' object has no attribute 'split'
There is an exception in preparing coordinate setting file
The command line is:
rmats2sashimiplot --b1 exp1.bam,exp2.bam,exp3.bam --b2 ctl1.bam,ctl2.bam,ctl3.bam -t SE -e SE.MATS.JCEC_top_err.txt --l1 DAZL --l2 control --exon_s 1 --intron_s 5 -o DAZL_plots_SE
Hi rMATS team,
Recently, I have been figuring out the results in rMATs and rmats2sashimiplot. The rMATs is great and the rmats2sashimiplot creats the plots smoothly, but the read counts shown in sashimiplot confuses me. Here is a representative sashimiplot of a single gene in control group and sh1 group

In Shank3 control-1, the juction read counts shown in sashimiplot are 28 and 33, and the skipped read count is 2.
While I found the read counts in rMATS are:
Control group:
junction reads
1: 42;
2: 48;
3: 50;
4: 68
skipped reads
1: 2 ;
2: 14 ;
3: 2 ;
4: 0
The same issues happened in other genes, thus I wonder how does sashimiplot quantifying the reads and how can I make two results consistent or perhaps we can find a relationship between them.
Any help would be appreciated
Thanks!
thereallda
It works great for four types of events (SE, A3SS, A5SS and RI)
but as soon as I change the event type to MXE, with the following command,
rmats2sashimiplot --b1 exp_1.bam,exp_2.bam,exp_3.bam --b2 ctl_1.bam,ctl_2.bam,ctl_3.bam -t MXE -e MATS_output/MXE.MATS.JCEC.txt --l1 EXP --l2 CTL --exon_s 1 --intron_s 5 -o EXP_plots_MXE
It exits with this error:
'EventCoor' object has no attribute 'se_s'
There is an exception in plot_with_eventsfile
My guess is that since the file header for MXE is different than other type of AS events, it doesn't work for that event.
Please investigate.
Hi,
I'm considering installing rmats2sashimiplot on our compute cluster. However, we prefer to use tagged releases since we can't keep up with users requesting commit level updates to all our installed software. I was wondering if you would consider tagging the latest commit you consider stable as a release?
Thanks,
Wolfgang
It is possible to run the tool with just one group, but it still throws an error that --l2 and --b2 are required, when they do not need to be.
Currently line 765 of the source codes states:
required_group.add_argument("--l2", dest="l2", required=True,
                                help="The label for second sample.")
Error retrieving files from 6: invalid contig 6 Are you sure 6 appears in your BAM file? Aborting plot..
I am using rmats2sashimiplot to plot one skipped exon event.
The indexing worked, but I was not able to make any plots.
I got this error, so I changed the value under "chr" in my event file from "6" to "chr6."
Even when I do this, I get the same issue. What should I do?
Hi, I've noticed that each of the rMATs outputs has thousands of genes, and it will take up too much space and way too much time for me to make sashimi plots for every single one of them. Is there a way to specify the specific events I want to make sashimi plots for?
...are created even when they are already there
--> test if index files are there.

What the mean of lncLevel at the right side of sashimiplot?
Hi there,
I tried to install with "python setup.py install", however the following error message popped up:
**running install
Checking .pth file support in /Library/Python/2.7/site-packages/
error: can't create or remove files in install directory
The following error occurred while trying to add or remove files in the
installation directory:
[Errno 13] Permission denied: '/Library/Python/2.7/site-packages/test-easy-install-5639.pth'
The installation directory you specified (via --install-dir, --prefix, or
the distutils default setting) was:
/Library/Python/2.7/site-packages/
Perhaps your account does not have write access to this directory? If the
installation directory is a system-owned directory, you may need to sign in
as the administrator or "root" account. If you do not have administrative
access to this machine, you may wish to choose a different installation
directory, preferably one that is listed in your PYTHONPATH environment
variable.
For information on other options, you may wish to consult the
documentation at:
https://pythonhosted.org/setuptools/easy_install.html
Please make the appropriate changes for your system and try again.**
This looks like a permission error, as it doesn't allow "/Library/Python/2.7/site-packages/easy-install.pth" to run.
Any idea on how to fix this?
Looking forward to the reply.
Zhenzhen
Hi. I was wondering if there was a way to run this program on multiple threads to speed it up, since the node that I am using has multiple cores. Thanks.
Dear,
In plots generated by rmats2sashimiplot, The y-axis represents a modified RPKM value:
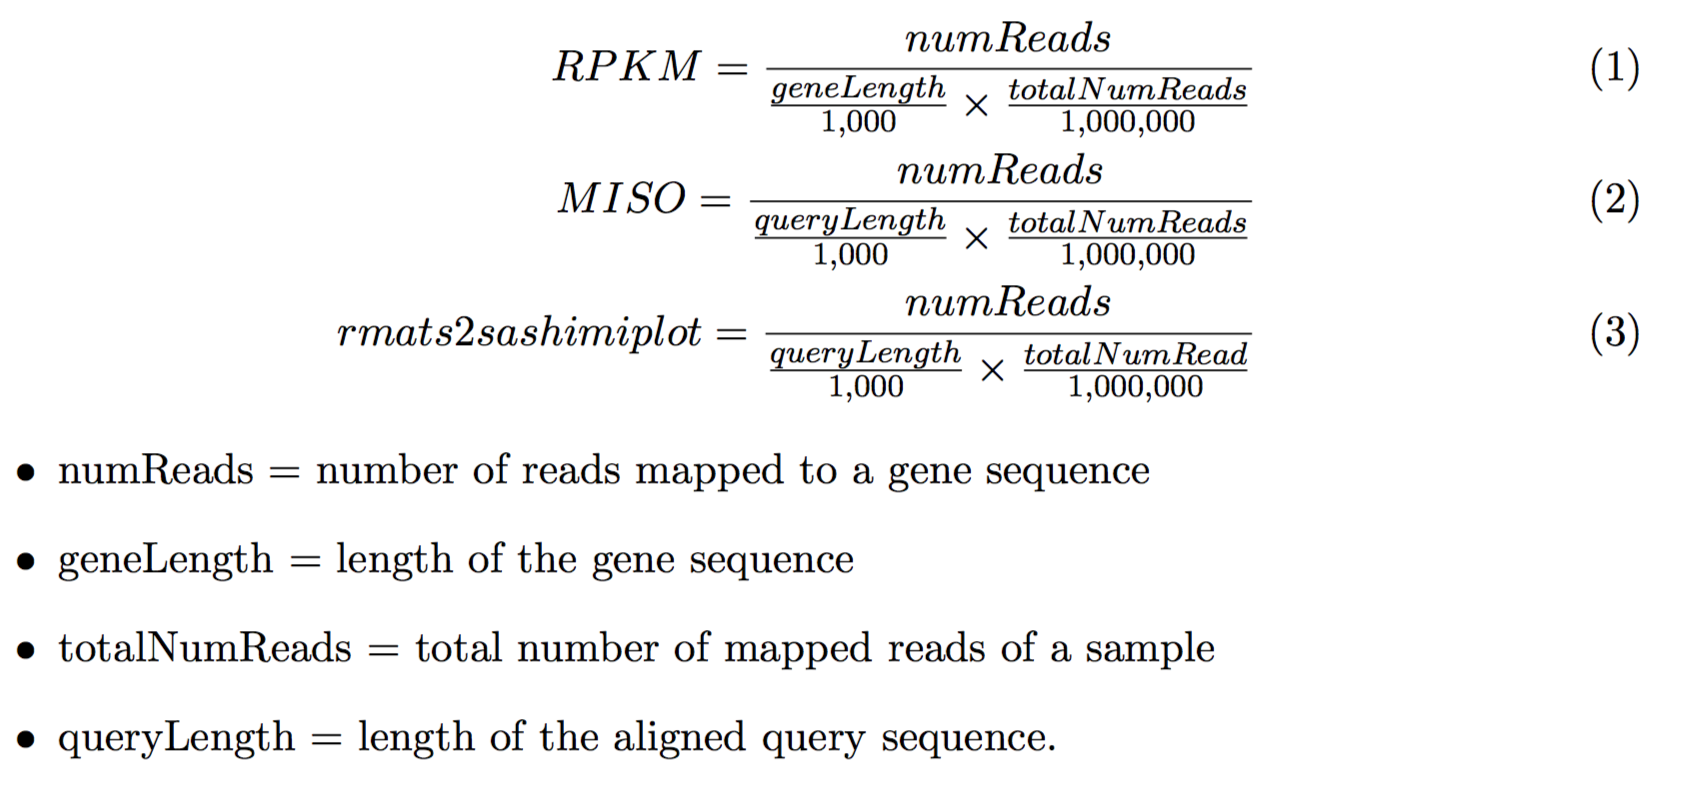
But what does query length mean ? RPKM is usually used to measure gene expression abundance, and each gene only has one RPKM. while In sashimiplot, it seems that each nucleotide site has a RPKM value (or read density), so what does it mean ? what's the difference between RPKM and coverage (as shown in Integrative Genomics Viewer (IGV) ) ?
Hi,
I tried to use rmats2sashimiplot to plot the figure. However, when I used the command:
###################
nohup rmats2sashimiplot --b1 cell1_rep1.bam,cell1_rep2.bam --b2 cell2_rep1.bam,cell2_rep2.bam -t MXE -e rMATs_res/AS/MXE.MATS.JC.txt --l1 cell1 --l2 cell2 -o MXE &
###################
I have checked the output, it is no any pdf or png output.
The following picture was the output from one gene.

Hi @ShiehShieh and team
Thank you for developing this tool,
please see below output of prpf8 gene from SE event,
ID	GeneID	geneSymbol	chr	strand	exonStart_0base	exonEnd	upstreamES	upstreamEE	downstreamES	downstreamEE	ID	IJC_SAMPLE_1	SJC_SAMPLE_1	IJC_SAMPLE_2	SJC_SAMPLE_2	IncFormLen	SkipFormLen	PValue	FDR	IncLevel1	IncLevel2	IncLevelDifference
2538	"ENSG00000174231"	"PRPF8"	17	-	1564904	1565084	1564564	1564700	1565199	1565447	2538	205,264,466	0,15,0	289,623,384	1,2,1	200	100	0.00764948226388	0.133184362837	1.0,0.898,1.0	0.993,0.994,0.995	-0.028
2536	"ENSG00000174231"	"PRPF8"	17	-	1586826	1586995	1585422	1585587	1587765	1588101	2536	544,412,690	0,0,0	670,707,465	0,1,0	200	100	1	1.0	1.0,1.0,1.0	1.0,0.997,1.0	0.001
2537	"ENSG00000174231"	"PRPF8"	17	-	1581811	1581946	1580858	1580988	1582055	1582175	2537	210,167,355	0,1,0	279,596,370	0,0,0	200	100	1	1.0	1.0,0.988,1.0	1.0,1.0,1.0	-0.004
2539	"ENSG00000174231"	"PRPF8"	17	-	1577039	1577186	1576650	1576861	1577735	1577974	2539	264,245,457	2,0,1	384,551,421	0,0,0	200	100	1	1.0	0.985,1.0,0.996	1.0,1.0,1.0	-0.006
As you can see the inclusion levels above and below in the plot are different, looks like it uses p-value/fdr instead of inclusion level in the final plot (is there a way to avoid adding the inclusion value)

errors:
pickled_file = file(pickled_filename, 'w')
IOError: [Errno 22] invalid mode ('w') or filename: '/media/user/0A9AD66165F33762/SAN/Splicing/01-hisat2/SE_plot/Sashimi_index_NA_3018/chrSc08/chrSc08:9528323:9528403:+@chrSc08:9528736:9528797:+@chrSc08:9528994:9529075:+.pickle'
python /home/user/miniconda3/envs/rmats2sashimiplot/lib/python2.7/site-packages/MISO/misopy/sashimi_plot/sashimi_plot.py --plot-event "chrSc08:9528323:9528403:+@chrSc08:9528736:9528797:+@chrSc08:9528994:9529075:+" /media/fhy/0A9AD66165F33762/SAN/Splicing/01-hisat2/SE_plot/Sashimi_index_NA_3018 /media/fhy/0A9AD66165F33762/SAN/Splicing/01-hisat2/SE_plot/Sashimi_index_NA_3018/sashimi_plot_settings.txt --output-dir /media/fhy/0A9AD66165F33762/SAN/Splicing/01-hisat2/SE_plot/Sashimi_plot
Traceback (most recent call last):
File "/home/user/miniconda3/envs/rmats2sashimiplot/lib/python2.7/site-packages/MISO/misopy/sashimi_plot/sashimi_plot.py", line 293, in
main()
File "/home/user/miniconda3/envs/rmats2sashimiplot/lib/python2.7/site-packages/MISO/misopy/sashimi_plot/sashimi_plot.py", line 289, in main
plot_label=plot_label)
File "/home/user/miniconda3/envs/rmats2sashimiplot/lib/python2.7/site-packages/MISO/misopy/sashimi_plot/sashimi_plot.py", line 142, in plot_event
%(genes_filename)
Exception: Cannot find file /media/user/0A9AD66165F33762/SAN/Splicing/01-hisat2/SE_plot/Sashimi_index_NA_3018/genes_to_filenames.shelve. Are you sure the events were indexed with the latest version of index_gff.py?
mv: Library not loaded/SE_plot/Sashimi_plot
/chrSc08:9528323:9528403:+@chrSc08:9528736:9528797:+@chrSc08:9528994:9529075:+.pdf':No such file or directory"
Warning: The inclusion levels of Event 'chrSc08:15995698:15995819:+@chrSc08:15995945:15996076:+@chrSc08:15996202:15996445:+' contains 'NA' value, which could lead to unexpected output.
<module 'misopy' from '/home/user/miniconda3/envs/rmats2sashimiplot/lib/python2.7/site-packages/MISO/misopy/init.pyc'>
then
Reinstall like this:
conda create --prefix ./new_conda_env
conda activate ./new_conda_env/
conda install -c conda-forge -c bioconda python=2 numpy scipy matplotlib pysam samtools bedtools
conda install -c bioconda rmats2sashimiplot
The same error occurred after running the command.
Please advise. thankyou!
hello, when I use the rmats and rmats2sashimiplot, I encounter several problems:
1: How to restrict the analysis to events with 10 or more reads, which is a standard cutoff used in many research papers. and I wonder how to set it in the code.
2: how to explain the result from the rmats2sashimiplot? For example, in this case, which group has the skipped exon event, the control or the case? what's the meaning of the gtf plot under the figure, do these two lines represent the control and case status?

really appreciate your response~
Hello I am using the following command:
miso
/cm/shared/apps/python/2.7.12/bin/rmats2sashimiplot --b1 ./home/seyfim/isilon/NGS_Working/Marilyn_Seyfi/Stetson_STAR_replicate_bam/P14M3M4WtM1brainAligned.out.sorted.bam,./home/seyfim/isilon/NGS_Working/Marilyn_Seyfi/Stetson_STAR_replicate_bam/P14M3M4WtM3brainAligned.out.sorted.filtered.bam,./home/seyfim/isilon/NGS_Working/Marilyn_Seyfi/Stetson_STAR_replicate_bam/P14M3M4WtM3brainAligned.out.sorted.bam --b2 ./home/seyfim/isilon/NGS_Working/Marilyn_Seyfi/Stetson_STAR_replicate_bam/P14M3M4MutM2brainAligned.out.sorted.bam,./home/seyfim/isilon/NGS_Working/Marilyn_Seyfi/Stetson_STAR_replicate_bam/P14M3M4MutM2brain_accepted_hits.bam,./home/seyfim/isilon/NGS_Working/Marilyn_Seyfi/Stetson_STAR_replicate_bam/P14M3M4MutM3brainAligned.out.sorted.bam -c chr12:-:4874271:4874336:./home/seyfim/lustre/rMATS/data/P14_candidategene.gff3 --l1 P14WT --l2 P14MUT -o ./home/seyfim/lustre/rMATS/data/sashimi_plots
And I get the following error:
rmats2sashimiplot: error: Incorrect file type. Need to provide with the right bam files for --b1 and --b2
However, these are sorted and indexed bam files that I previously used when running rMATS v 3.2.5. Is there something that I am doing wrong? @ChengyangWang @ybucla @freedomyy @ShiehShieh
hello! i'm try to use rmats2sashimiplot but come across a problem.
when i run rmats2sashimiplot, it reports:

would you help me to solve it? Thank you very much!!!!!
Hi,
I found that the counts' values showed in sashimi_plot are different from the counts' value in SE.MATS.JC.txt. I was wondering why this happens?
For example:
In SE.MATS.JC.txt
2       "TMEM181"       "TMEM181"       chr6    +       159028275       159028375       159026298       159026379       159029364       159029495
       2       240     2                       100     50      NA      NA      0.984           NA
The IJC_SAMPLE_1 value is 240, but in sashimi_plot

the counts value= 98 +114, which is not equal to 240.
Thanks in advance!
Best,
Kun
/home/bin/anaconda3/envs/python2/bin/rmats2sashimiplot --b1 bam_symlink_2017/T5rep1.bam,bam_symlink_2017/T5rep2.bam,bam_symlink_2017/T5rep3.bam --b2 bam_symlink_2017/unT5rep1.bam,bam_symlink_2017/unT5rep2.bam,bam_symlink_2017/unT5rep3.bam --l1 T5 --l2 UNT5 --exon_s 1 --intron_s 5 -o /data/data/sashimi -c chr16:-:24944500:24955500:GRCh38_PRIM_GENCODE_R25/gencode.v25.primary_assembly.annotation.gtf
File "/home/bin/anaconda3/envs/python2/lib/python2.7/site-packages/rmats2sashimiplot-2.0.2-py2.7.egg/MISO/misopy/index_gff.py", line 77
print "Making directory: %s" %(chrom_dir)
^
SyntaxError: invalid syntax
File "/home/bin/anaconda3/envs/python2/lib/python2.7/site-packages/rmats2sashimiplot-2.0.2-py2.7.egg/MISO/misopy/sashimi_plot/sashimi_plot.py", line 46
print "WARNING: %s does not end in .miso_bf, are you sure it is the "
^
SyntaxError: Missing parentheses in call to 'print'
Hi all, I hope this is not a repost. I have this issue where my plot is showing extremely low RPKM values on the axis and the Inclevel values on the plot are missing too whereas I can see the IncLevel values in the rMATS file and have verified RPKM values to be in few thousands.
About the data:
150bp PE human data aligned using STAR
Genome: GRCh38.p13.genome.fa
GTF: gencode.v34.annotation.gtf
GFF: gencode.v34.annotation.gff3 (wasn't working untill I came across Eric's workaround of using: sed 's/([^\t]\t[^\t]\t)transcript\t/\1mRNA\t/' /path/file.gff3 > /path/file_mrna.gff3)
STAR parameters:
--alignEndsType EndToEnd
--outSAMmapqUnique 60
--outSAMtype BAM Unsorted
BAM files were sorted and indexed using Samtools
rMATS command:
python rmats.py --b1 ./bam_col/b1.txt --b2 ./bam_col/b2.txt --gtf ./genome/gencode.v34.annotation.gtf --od ./diff_col/ -t paired --nthread 20 --readLength 150 --cstat 0.0001
The SE.MATS.JC.txt file created, includes over 62k lines so I decided to filter it by FDR<=0.1 which gave me around 700 candidates.
rmats2sashimiplot command:
rmats2sashimiplot --b1 ./P1_D0.Aligned.sorted.bam,./P2_D0.Aligned.sorted.bam,./P3_D0.Aligned.sorted.bam,./P4_D0.Aligned.sorted.bam,./P5_D0.Aligned.sorted.bam,./P6_D0.Aligned.sorted.bam --b2 ./P1_D100.Aligned.sorted.bam,./P2_D100.Aligned.sorted.bam,./P3_D100.Aligned.sorted.bam,./P4_D100.Aligned.sorted.bam,./P5_D100.Aligned.sorted.bam,./P6_D100.Aligned.sorted.bam -t SE -e ./SE.MATS.JC_filtered.txt --l1 VitD_0nM --l2 VitD_100nM --exon_s 1 --intron_s 5 -o ./sashimi/SE_filtered --group-info ./grouping.gf
grouping.gf content:
VitD_0nM: 1-6
VitD_100nM: 7-12
Additionally: I get his error when running the rmats2sashimiplot command:
Saving plot to:./bam_sort/col_sort_bam/sashimi/SE_filtered/Sashimi_plot/chrX:73944584:73944662:+@chrx:73946999:73947096:+@chrx:73984444:73984541:+.pdf
Warning: The inclusion levels of Event 'chrX:73944327:73944662:+@chrx:73946999:73947374:+@chrx:73984444:73984541:+' contains 'NA' value, which could lead to unexpected output.
<module 'misopy' from '/usr/local/lib/python2.7/dist-packages/rmats2sashimiplot-2.0.2-py2.7.egg/MISO/misopy/init.pyc'>
Indexing GFF...
I don't see any NA values in my SE.MATS.JC.txt file. What is triggering this warning? Is this the reason every single one of my plot is missing the IncLevel value?
Thanks!
274_MLH3_chr14_75038340_75038412_-@chr14_75033419_75033490_-@chr14_75032068_75032179_-.pdf
--Hello,
i don't know what's wrong:
rmats2sashimiplot --b1 SRR031760_61.bam --b2 SRR074428_29.bam -c 2L:+:11500000:11550000:Droso.gff3 --l1 B52_RNAi --l2 B52_control --exon_s 1 --intron_s 5 -o outDir
<module 'misopy' from 'sashimiplot/lib/python/rmats2sashimiplot-2.0.0-py2.7.egg/MISO/misopy/init.pyc'>
Indexing GFF...
Hi. Thanks for your script, its very useful.
When I have each sample plotted I am able to specify colours E.G:
rmats2sashimiplot --b1 ../../total-rna-1.sam.sorted.bam,../../total-rna-2.sam.sorted.bam,../../total-rna-3.sam.sorted.bam,../../total-rna-4.sam.sorted.bam --b2 ../../total-rna-5.sam.sorted.bam,../../total-rna-6.sam.sorted.bam,../../total-rna-7.sam.sorted.bam,../../total-rna-8.sam.sorted.bam -t SE -e MATS_SIG/slirp.txt --l1 37C_Rep_ --l2 31C_Rep_ -o plot--intron_s 10 --no-text-background --color '#ee5c42,#ee5c42,#ee5c42,#ee5c42,#00bfff,#00bfff,#00bfff,#00bfff'
But when I change to using a group file it does not seem to be possible to choose the colours used in the plot E.G:
rmats2sashimiplot --b1 ../../total-rna-1.sam.sorted.bam,../../total-rna-2.sam.sorted.bam,../../total-rna-3.sam.sorted.bam,../../total-rna-4.sam.sorted.bam --b2 ../../total-rna-5.sam.sorted.bam,../../total-rna-6.sam.sorted.bam,../../total-rna-7.sam.sorted.bam,../../total-rna-8.sam.sorted.bam -t SE -e MATS_SIG/slirp.txt --l1 37C_Rep_ --l2 31C_Rep_ -o plot--intron_s 10 --no-text-background --color '#ee5c42,#ee5c42,#ee5c42,#ee5c42,#00bfff,#00bfff,#00bfff,#00bfff' --group-info grouping.gf
Returns a plot with the same colours as found in the tutorial for grouped plots. https://github.com/Xinglab/rmats2sashimiplot/blob/master/README.md
This is an issue because the colours chosen for grouped plotting by default are too dark to see the junction counts when the --no-text-background flag is on.
Is it possible to choose the colours for groups? If not you may want to consider changing the script to have lighter colours.
Hi,
I am new to command lines and I am sorry if this is a silly mistake. Somehow I am not able to use the color argument not even with the test files. I tried the following simplified test line:
rmats2sashimiplot --b1 ./rmats2sashimiplot_test_data/sample_1_replicate_1.bam --b2 ./rmats2sashimiplot_test_data/sample_2_replicate_1.bam -c chr16:+:9000:25000:./rmats2sashimiplot_test_data/annotation.gff3 --l1 SampleOne --l2 SampleTwo --exon_s 1 --intron_s 5 --color [#808080,#000000] -o test_coordinate_output
I get the following error when I try to change colors:
ValueError: Invalid RGBA argument: '['
If I try the argument color without [, it returns: expected one argument.
I have attached the full screen in here.
Thanks,
Erick
colour_error.docx
Hello rMATS team!
I am trying to use bam files as input to rmats2sashimiplot. However, since the genome size of the species I am working on is large with many chromosomes larger than 512 Mb in size, I can only generate the csi index for the bam files. I do have the csi index in the same location as the bam files. However, I receive the following error:
[E::hts_idx_check_range] Region 536937569..536937720 cannot be stored in a bai index. Try using a csi index
[E::sam_index] Read 'A00977:192:HLMW2DSXY:3:2523:21287:23109' with ref_name='1A', ref_length=594102056, flags=163, pos=536937570 cannot be indexed
Could you please advise if csi indices are compatible with rmats2sashimiplot or is there any workaround to fix this issue.
Thanks.
A declarative, efficient, and flexible JavaScript library for building user interfaces.
🖖 Vue.js is a progressive, incrementally-adoptable JavaScript framework for building UI on the web.
TypeScript is a superset of JavaScript that compiles to clean JavaScript output.
An Open Source Machine Learning Framework for Everyone
The Web framework for perfectionists with deadlines.
A PHP framework for web artisans
Bring data to life with SVG, Canvas and HTML. 📊📈🎉
JavaScript (JS) is a lightweight interpreted programming language with first-class functions.
Some thing interesting about web. New door for the world.
A server is a program made to process requests and deliver data to clients.
Machine learning is a way of modeling and interpreting data that allows a piece of software to respond intelligently.
Some thing interesting about visualization, use data art
Some thing interesting about game, make everyone happy.
We are working to build community through open source technology. NB: members must have two-factor auth.
Open source projects and samples from Microsoft.
Google ❤️ Open Source for everyone.
Alibaba Open Source for everyone
Data-Driven Documents codes.
China tencent open source team.